Hallador Energy Company (HNRG)
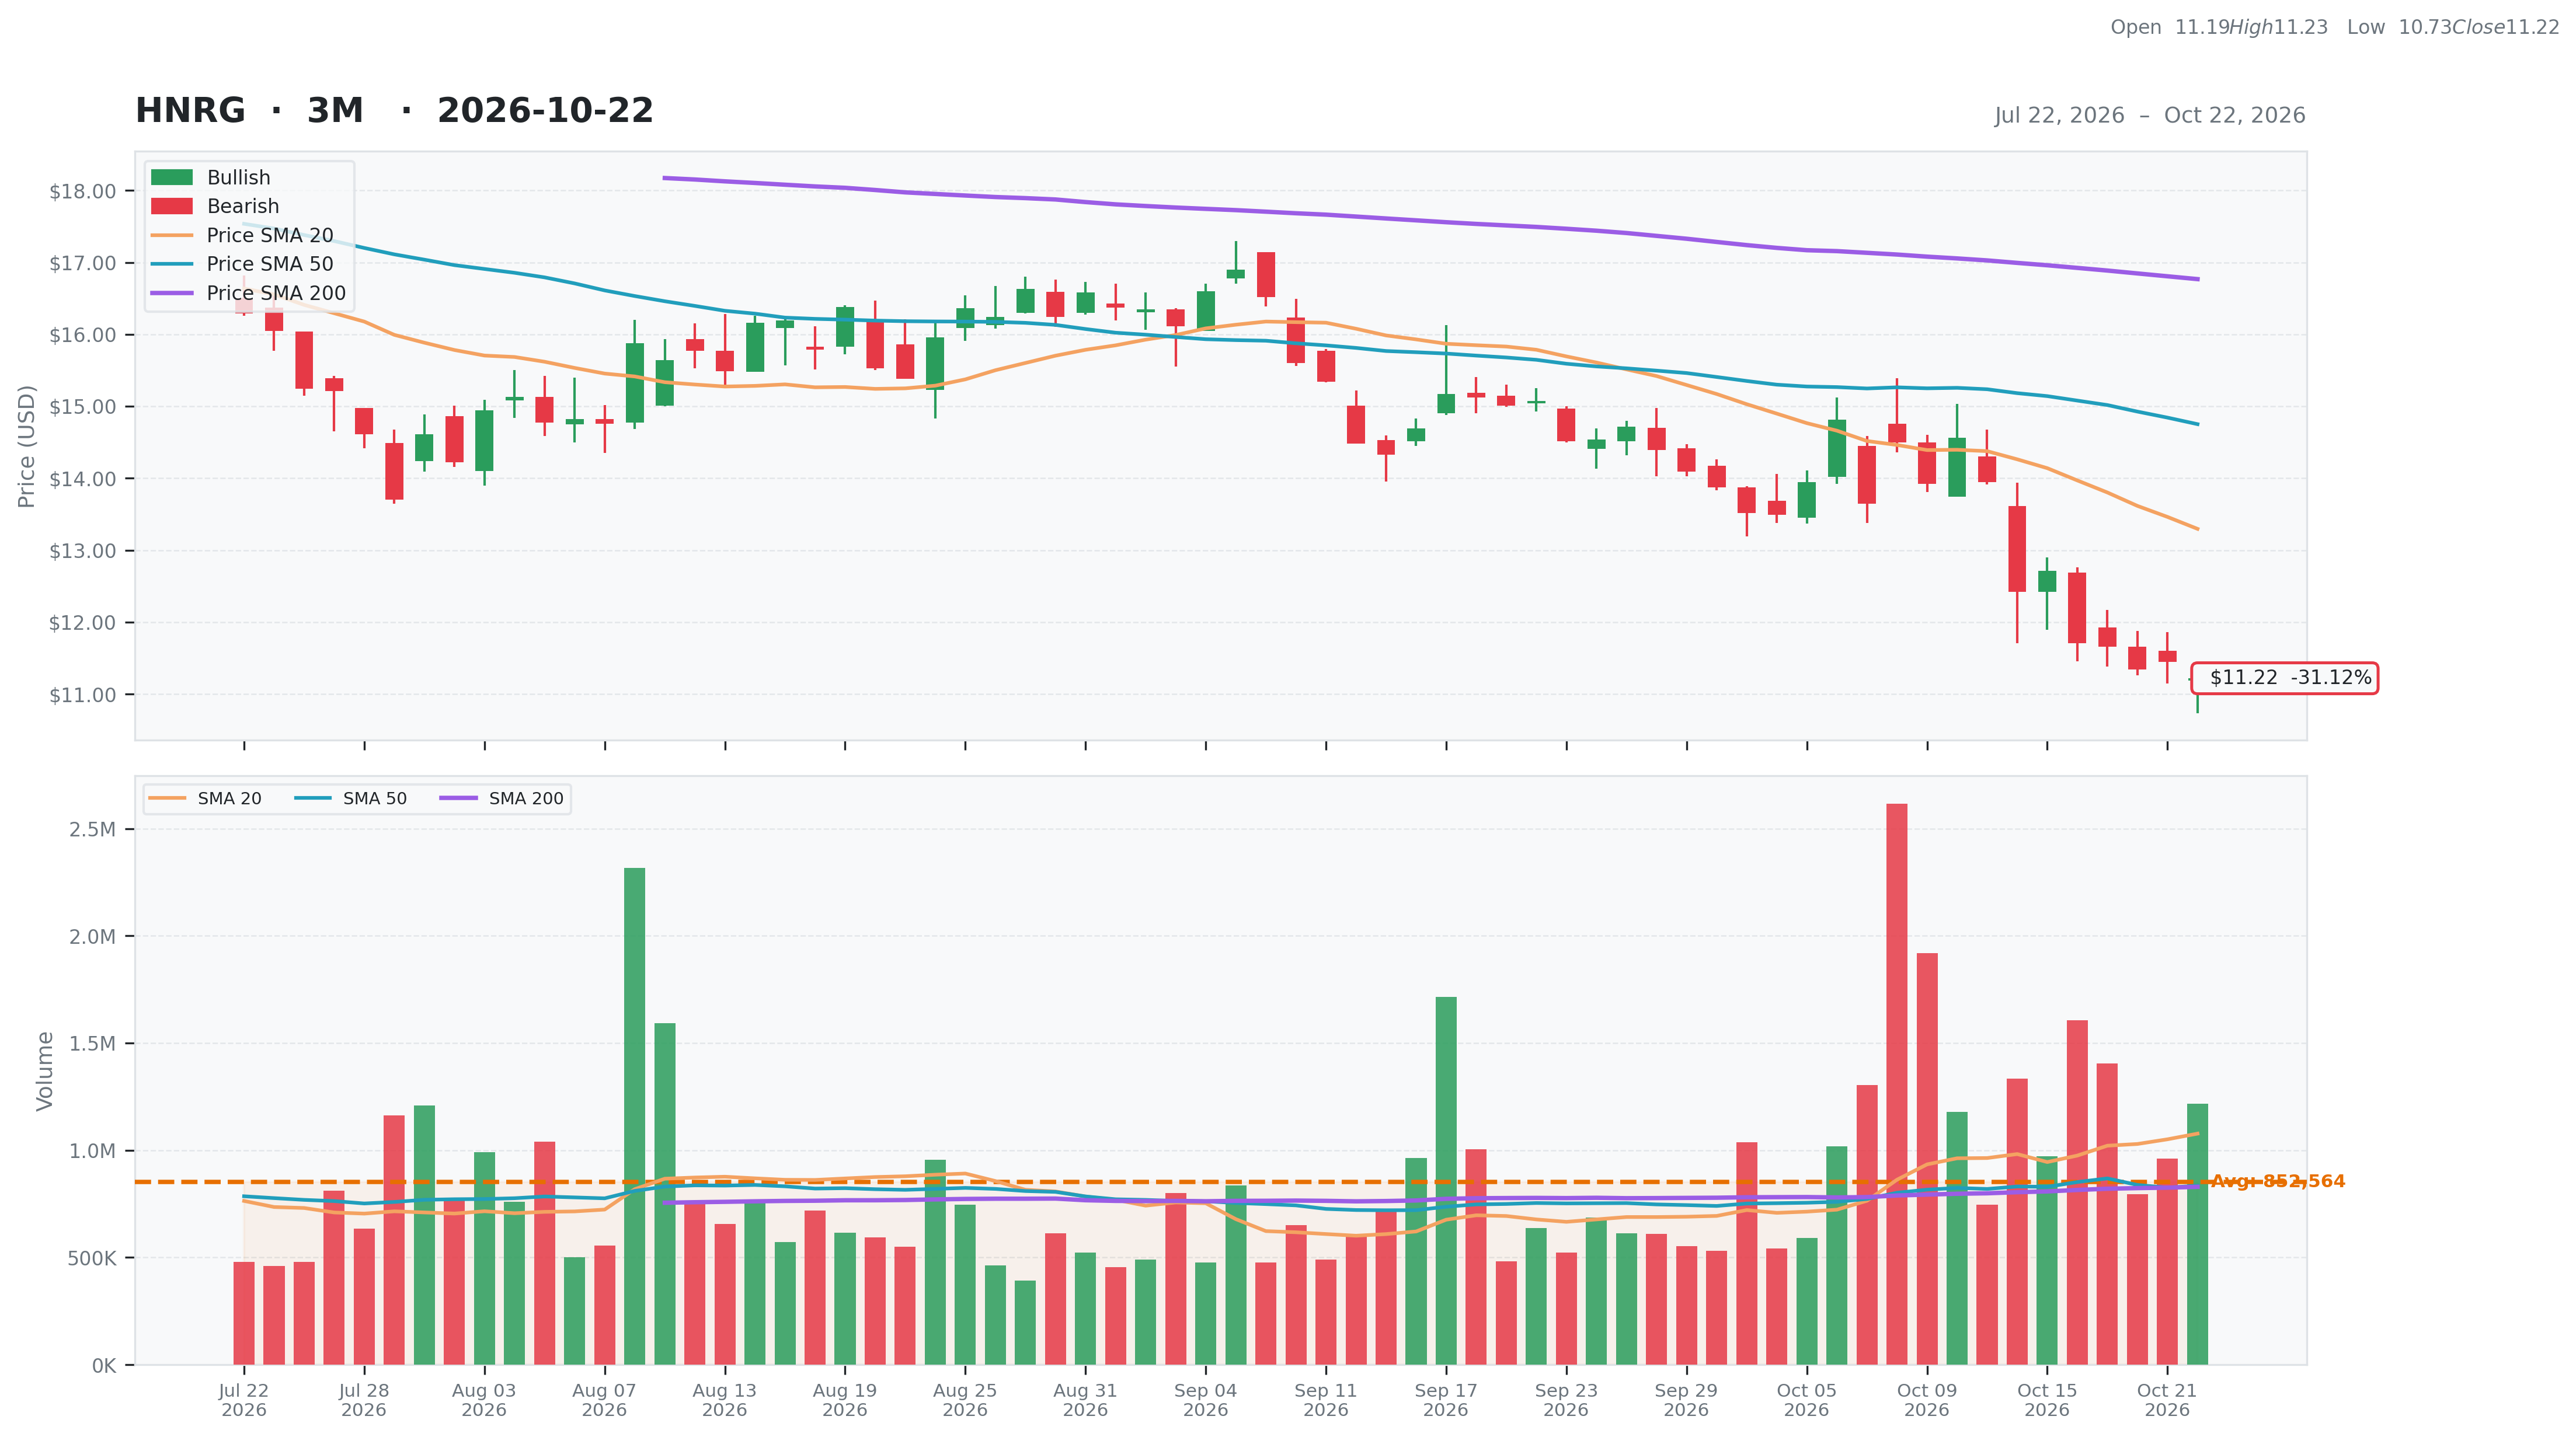
Utilities • Utilities - Independent Power Producers • $11.22 • MCap: 552,048,704
https://www.halladorenergy.com • Hallador Energy Company, through its subsidiaries, operates as an independent power producer and fuel company in the United States. It operates in two segments, Electric Operations and Coal Operations. The company owns and operates the Meron power plant, a 1,080 megawatts coal-fired power generating station that consists of two steam turbine generators and sells accredited capacity to utilities and other energy market participants. It also sells wholesale energy to utilities, generation and transmission cooperatives, and other energy market participants. In addition, the company operates the Oaktown mining complex, a coal mining and processing operation located in Knox and Sullivan counties, Indiana, and Crawford and Lawrence counties, Illinois. Hallador Energy Company was founded in 1949 and is based in Terre Haute, Indiana.
Ex-AAII
| Score | Price | 52 Week & Averages | Relative Strength | Risk | |||||
|---|---|---|---|---|---|---|---|---|---|
| Total | 29 | Current | $11.22 | 52W High | $23.81 -52.88% | Relative Strength | -0.35 | Beta | 0.44 |
| Business Quality | 1 | Weekly | $12.71 -11.72% | 52W Low | $11.22 0.00% | 3M | -0.26 | Short % | 0.1 |
| Financial Strength | 5 | Monthly | $15.07 -25.55% | Above 50DMA | $14.75 -23.94% | 6M | -0.30 | Risk Score | 4 |
| Growth Outlook | 5 | Quarterly | $15.24 -26.38% | Above 200DMA | $16.77 -33.08% | 9M | -0.45 | ||
| Momentum | 2 | Yearly | $20.67 -45.72% | 12M | -0.46 | ||||
| Valuation | Financial Strength | Growth/Profitability | |||
|---|---|---|---|---|---|
| Trailing P/E | 585.50 | Cash | 29M | Revenue Growth | -0.01% |
| Forward P/E | 54.05 | Debt | 48M | Earnings Growth | N/A |
| PEG Ratio | 1.26 | Debt/Equity | 25.07 | Qtr Earnings Growth | N/A |
| Price/Sales | 1.21 | Current Ratio | 0.72 | Gross Margin | 0.19% |
| Price/Book | 2.90 | Quick Ratio | 0.21 | Operating Margin | -0.12% |
| EV/Revenue | 1.25 | Operating CF | 28M | Profit Margin | 0.00% |
| EV/EBITDA | 9.94 | Free CF | -5M | EBITDA Margin | 0.13% |
| Ent Value | 571M | Return on Assets | 0.02% | ||
| Return on Equity | -0.01% | ||||
| Technical | Volume & Bollinger Bands | Analyst | |||
|---|---|---|---|---|---|
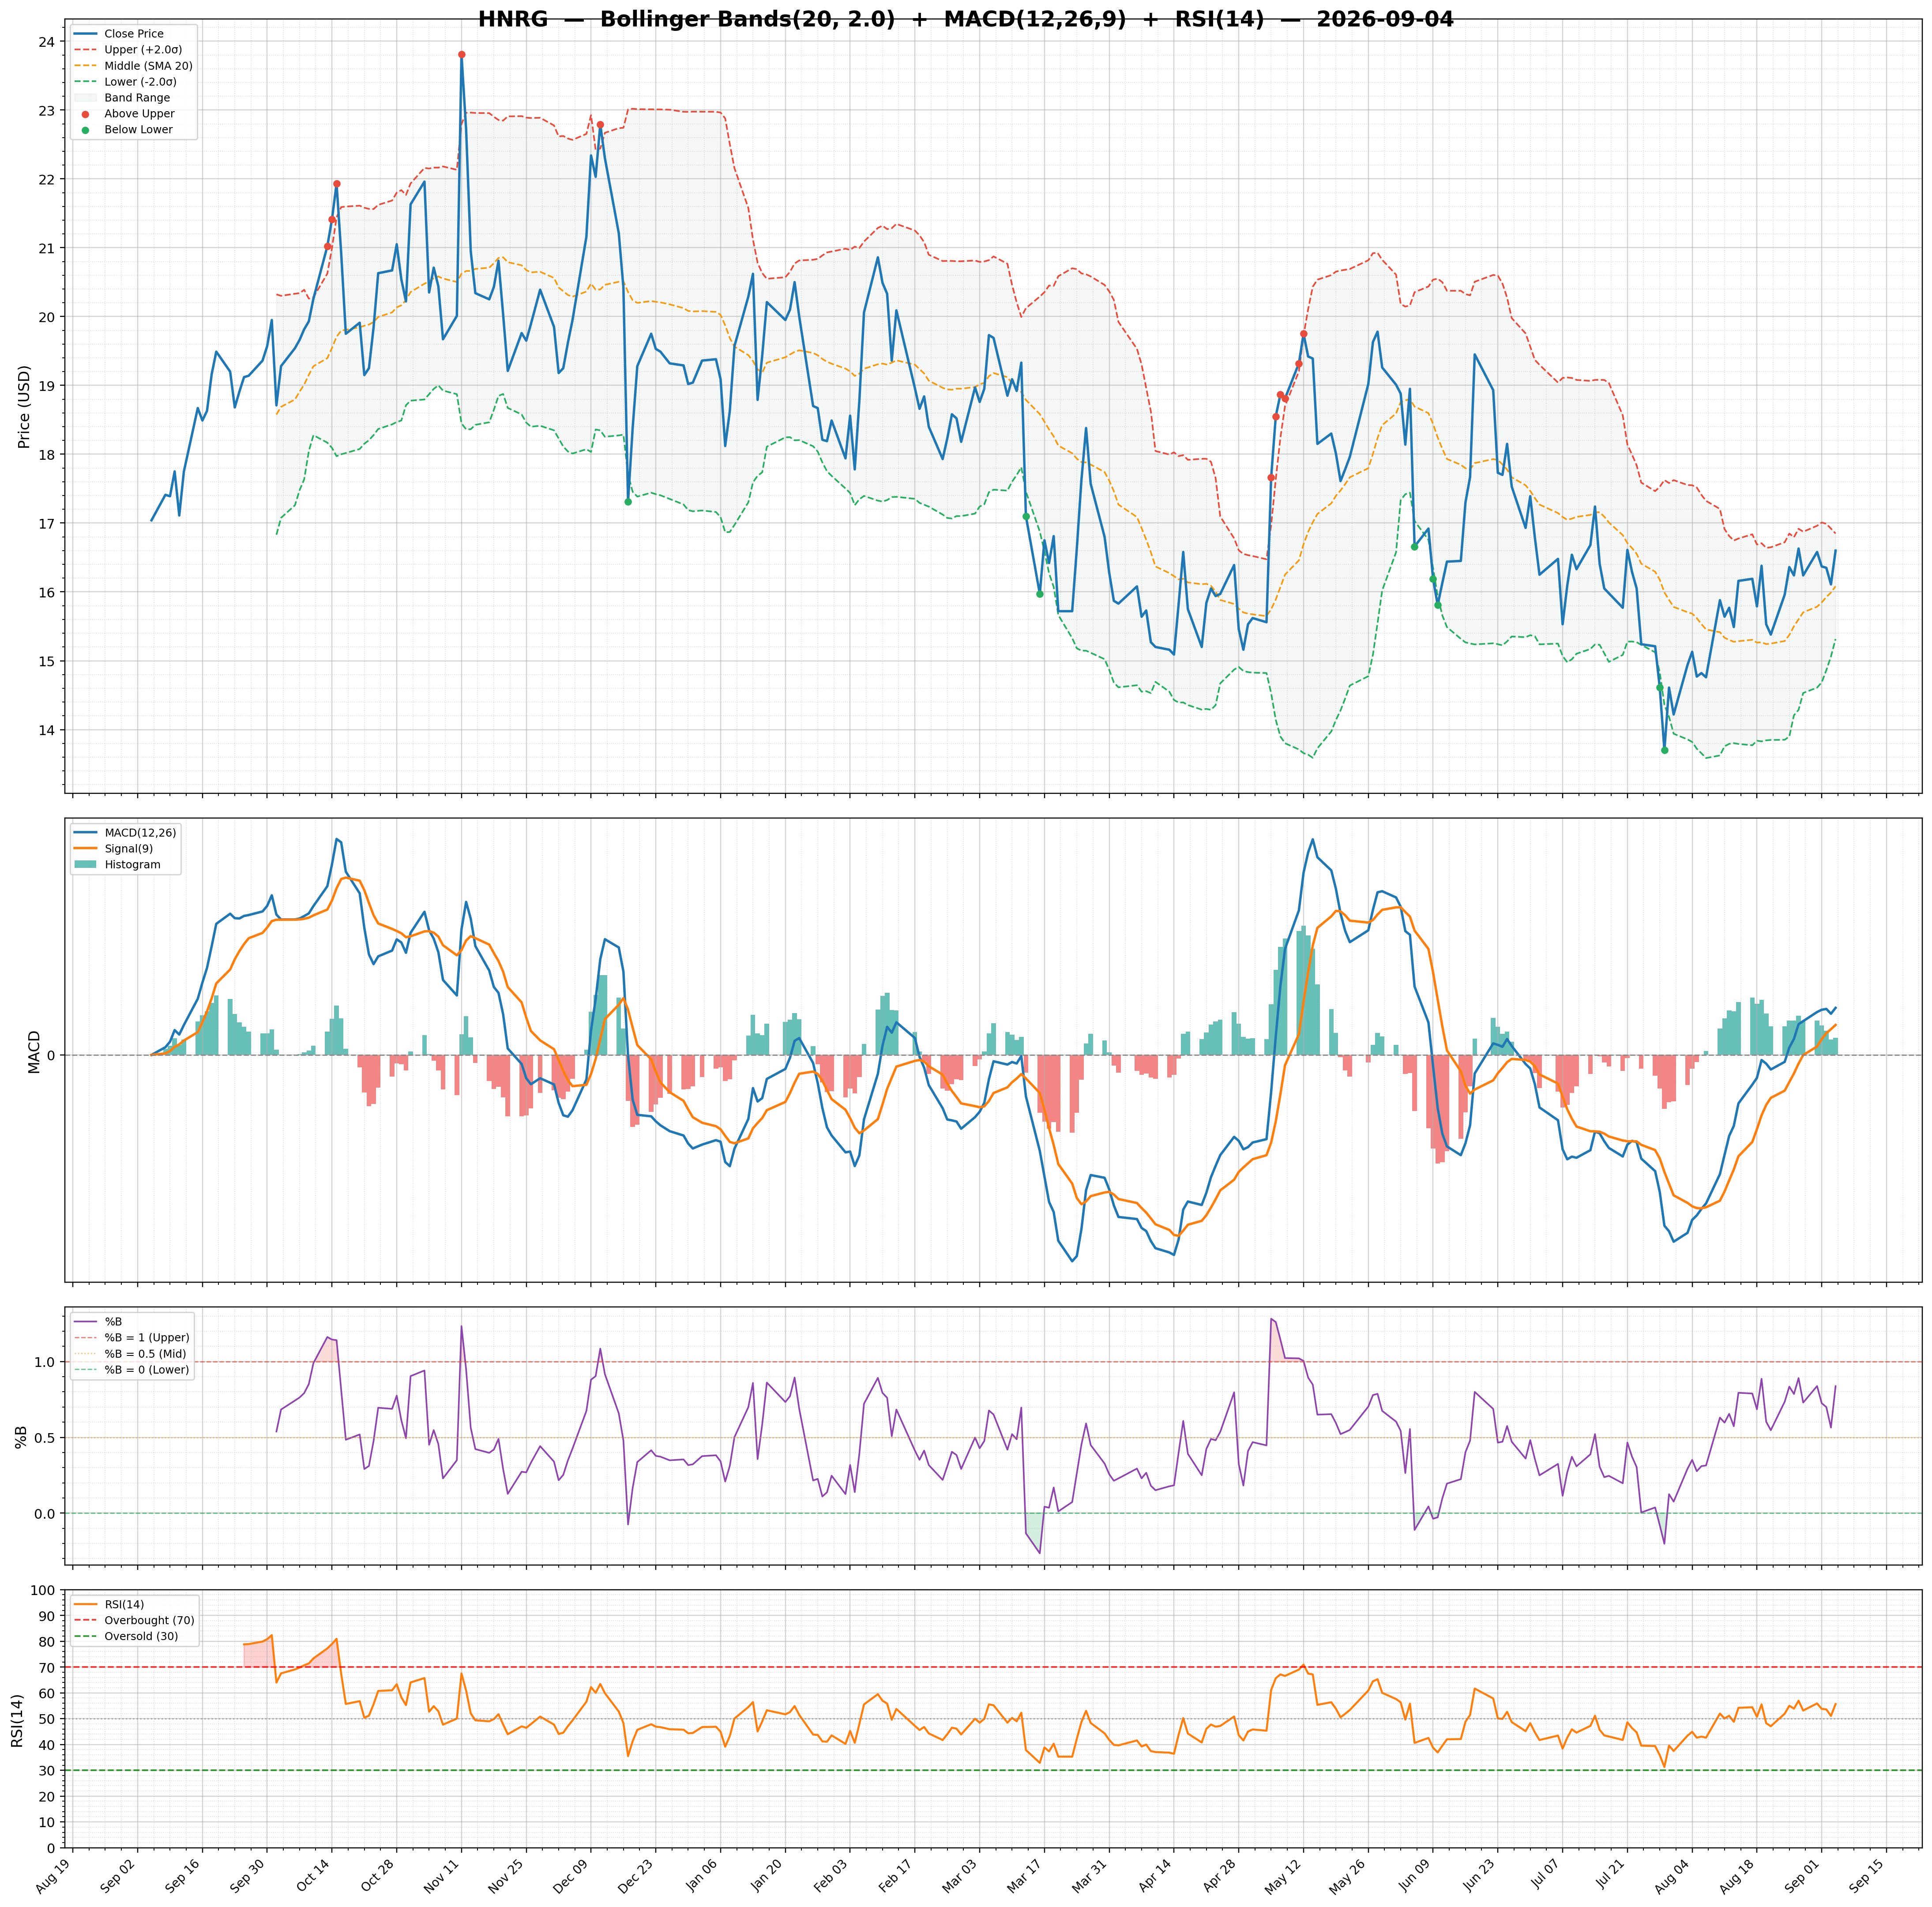
| RSI | 31.63 | Volume | 1.6M | Rating | strong_buy |
| Previous RSI | 32.79 | Avg Volume 20D | 1.08M | Target Mean | $28.00 |
| RSI Trend | Down | Relative Volume | 1.24 | Target High | $29.00 |
| MACD | -0.95 | Lower Band | 10.83 | Target Low | $27.00 |
| MACD Signal | -0.72 | Middle Band | 13.30 | Target Median | $28.00 |
| Histogram | -0.23 | Upper Band | 15.76 | Analysts | 3 |
| Previous Histogram | -0.24 | Bandwidth | 37.060 | Upside | 139.11% |
| Histogram Trend | Increasing | %B | 0.08 | ||