Hooker Furnishings Corporation (HOFT)
Consumer Cyclical • Furnishings, Fixtures & Appliances • $12.77 • MCap: 137,394,736
https://www.hookerfurniture.com • Hooker Furnishings Corporation, together with its subsidiaries, designs, manufactures, imports, and markets residential household, hospitality and contract furniture, lighting, accessories, and home décor products in North America. It operates through Hooker Branded, Domestic Upholstery, and All Other segments. The Hooker Branded Segment includes two businesses, such as Hooker Casegoods that provides various design categories, including home entertainment, home office, accent, and dining and bedroom furniture under the Hooker Furniture brand; and Hooker Upholstery which imports upholstered furniture. The Domestic Upholstery Segment offers motion and stationary leather furniture under the Bradington-Young brand; chairs, sofas, sectionals, recliners, and various accent upholstery pieces under the HF Custom brand; upholstered furniture, such as private label sectionals, modulars, sofas, chairs, ottomans, benches, beds, and dining chairs for lifestyle specialty retailers under the Shenandoah Furniture brand; and designs and manufactures outdoor furniture under the Sunset West brand. The All Other Segment designs and supplies hotel furnishings for four and five-star hotels under the Samuel Lawrence Hospitality brand. It sells its products through retailers, such as independent furniture stores, department stores, mass merchants, national chains, catalog merchants, interior designers, and e-commerce retailers. Hooker Furnishings Corporation was incorporated in 1924 and is headquartered in Martinsville, Virginia.
Ex-AAII
| Score | Price | 52 Week & Averages | Relative Strength | Risk | |||||
|---|---|---|---|---|---|---|---|---|---|
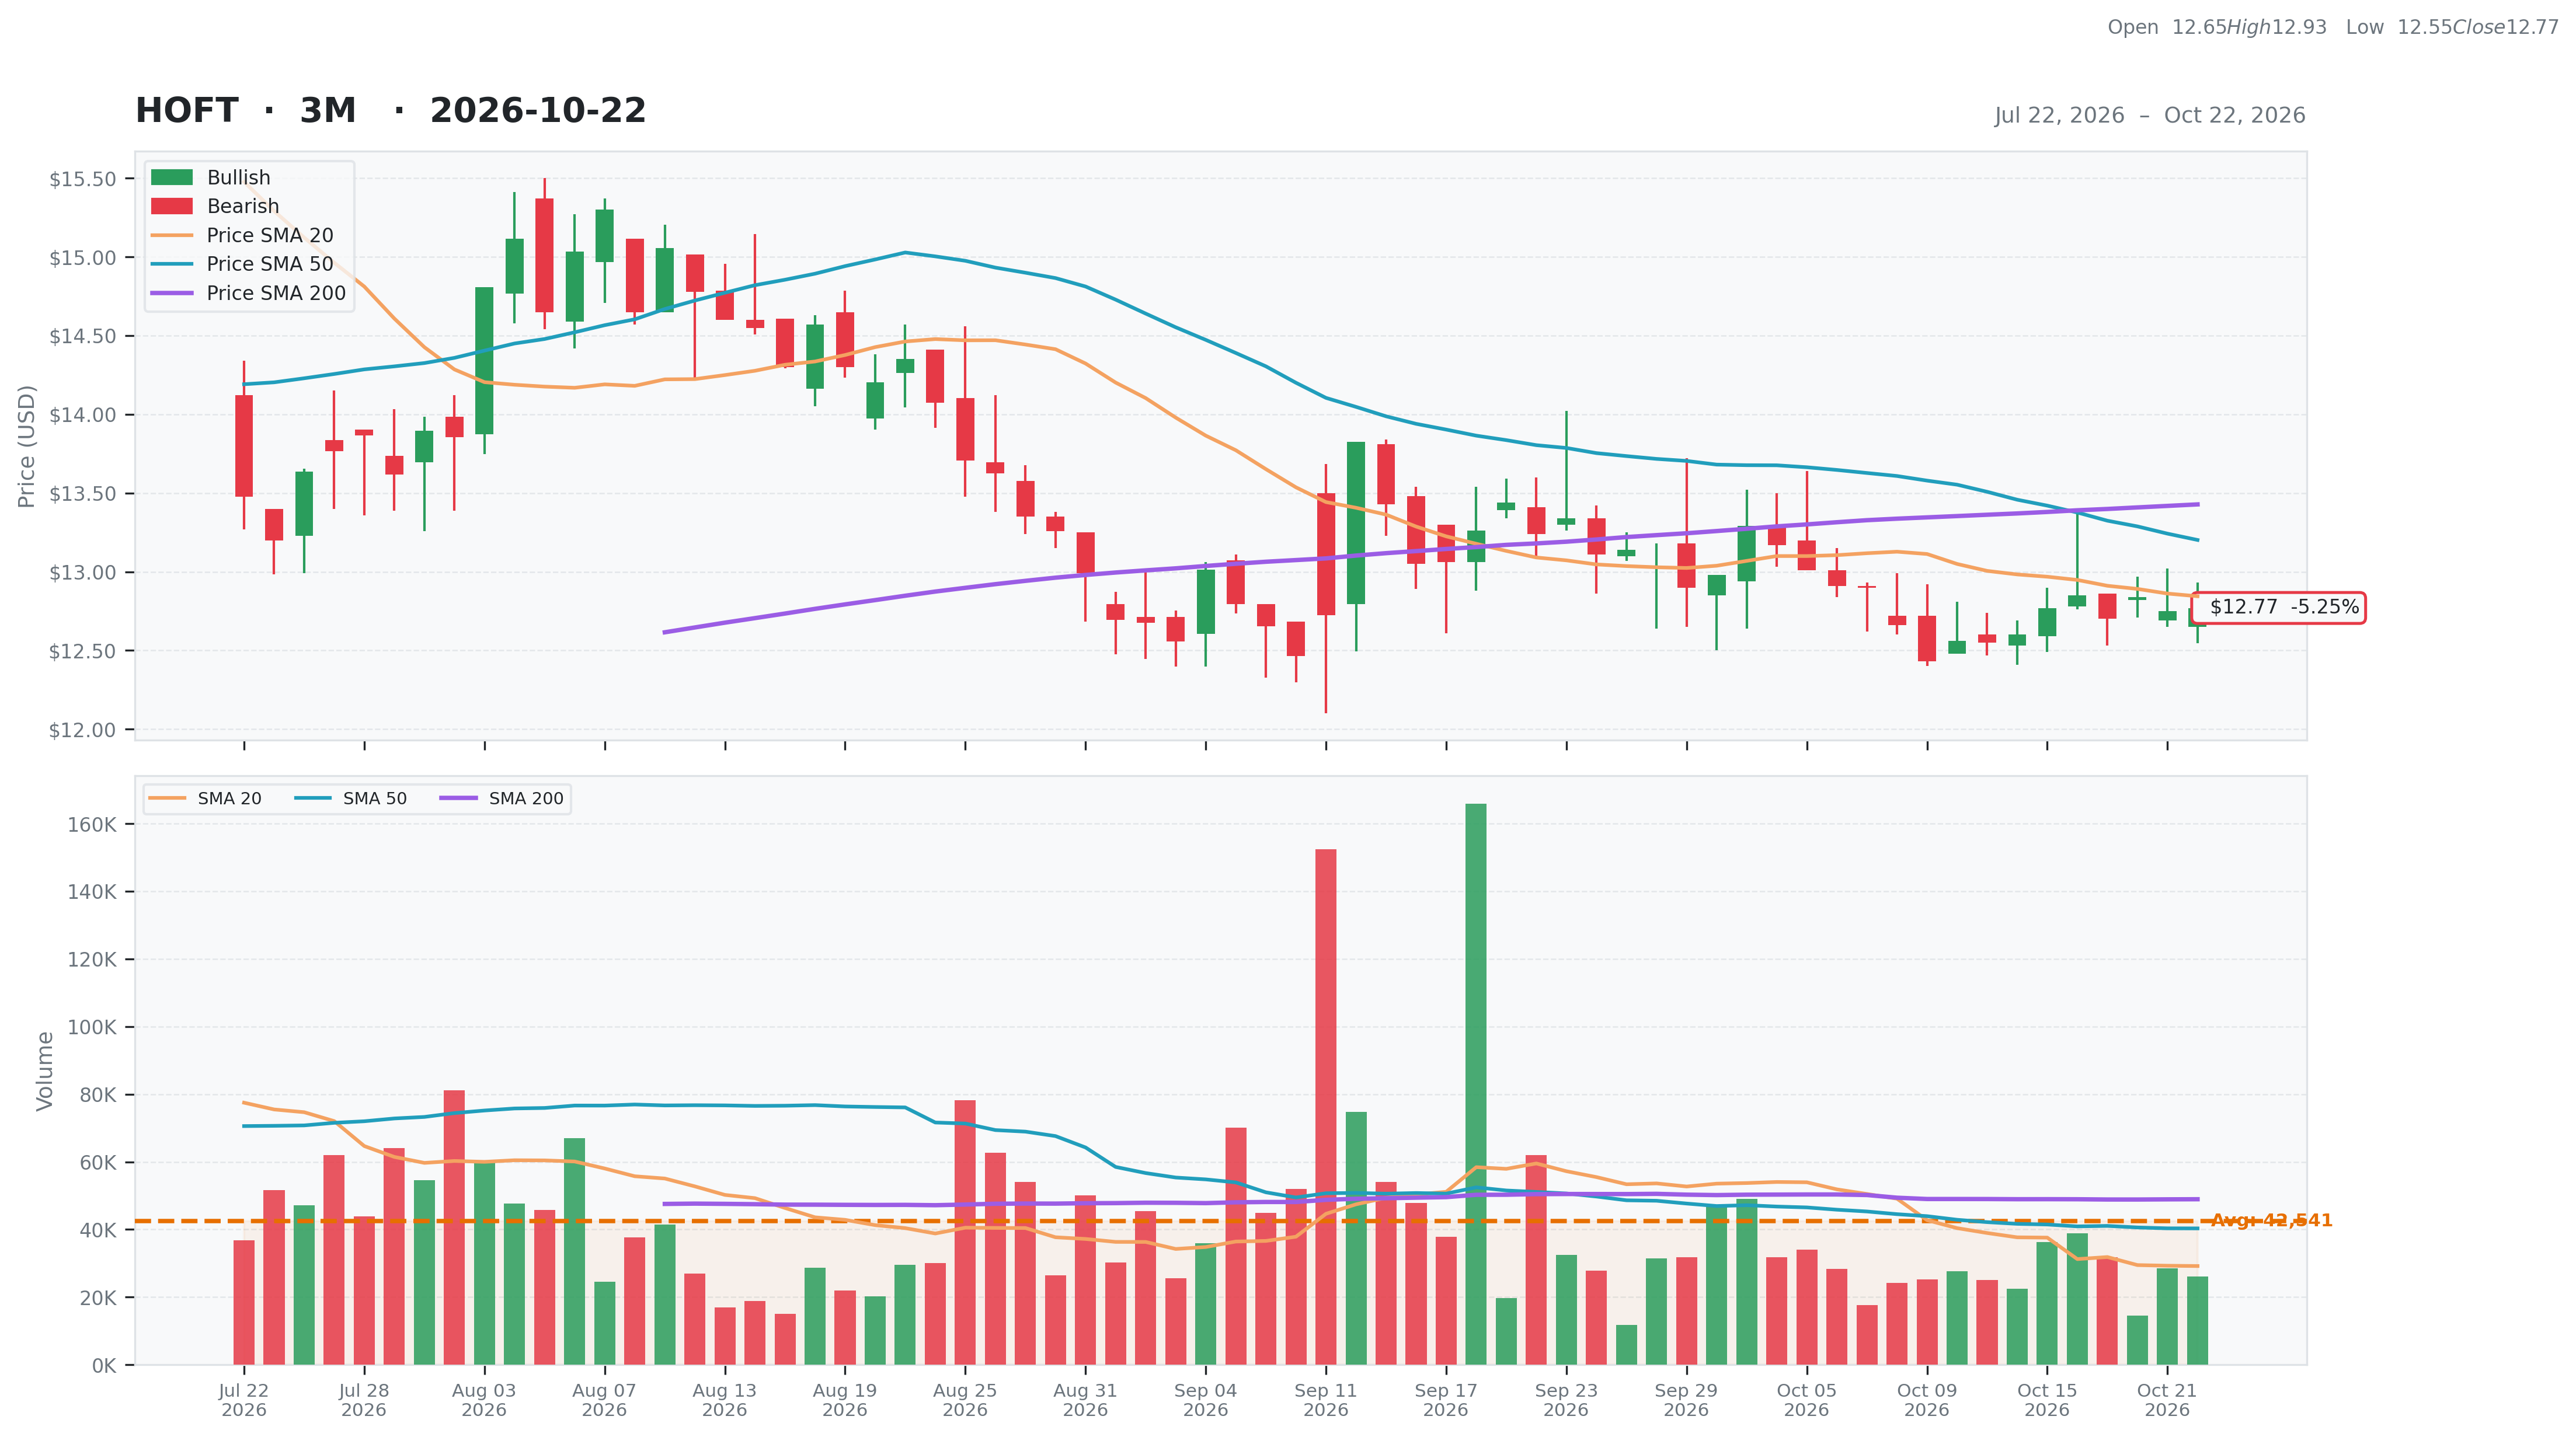
| Total | 44 | Current | $12.77 | 52W High | $17.68 -27.78% | Relative Strength | 0.08 | Beta | 1.12 |
| Business Quality | 4 | Weekly | $12.77 0.00% | 52W Low | $8.47 50.71% | 3M | -0.06 | Short % | 0.01 |
| Financial Strength | 12 | Monthly | $13.24 -3.55% | Above 50DMA | $13.20 -3.27% | 6M | 0.03 | Risk Score | |
| Growth Outlook | 1 | Quarterly | $13.64 -6.35% | Above 200DMA | $13.43 -4.90% | 9M | 0.00 | ||
| Momentum | 2 | Yearly | $8.79 45.25% | 12M | 0.50 | ||||
| Valuation | Financial Strength | Growth/Profitability | |||
|---|---|---|---|---|---|
| Trailing P/E | N/A | Cash | 19M | Revenue Growth | -0.09% |
| Forward P/E | 10.62 | Debt | 24M | Earnings Growth | N/A |
| PEG Ratio | 0.75 | Debt/Equity | 14.21 | Qtr Earnings Growth | N/A |
| Price/Sales | 0.51 | Current Ratio | 3.03 | Gross Margin | 0.28% |
| Price/Book | 0.81 | Quick Ratio | 1.45 | Operating Margin | -0.05% |
| EV/Revenue | 0.52 | Operating CF | 28M | Profit Margin | -0.07% |
| EV/EBITDA | 36.09 | Free CF | 34M | EBITDA Margin | 0.01% |
| Ent Value | 141M | Return on Assets | 0.00% | ||
| Return on Equity | -0.05% | ||||
| Technical | Volume & Bollinger Bands | Analyst | |||
|---|---|---|---|---|---|
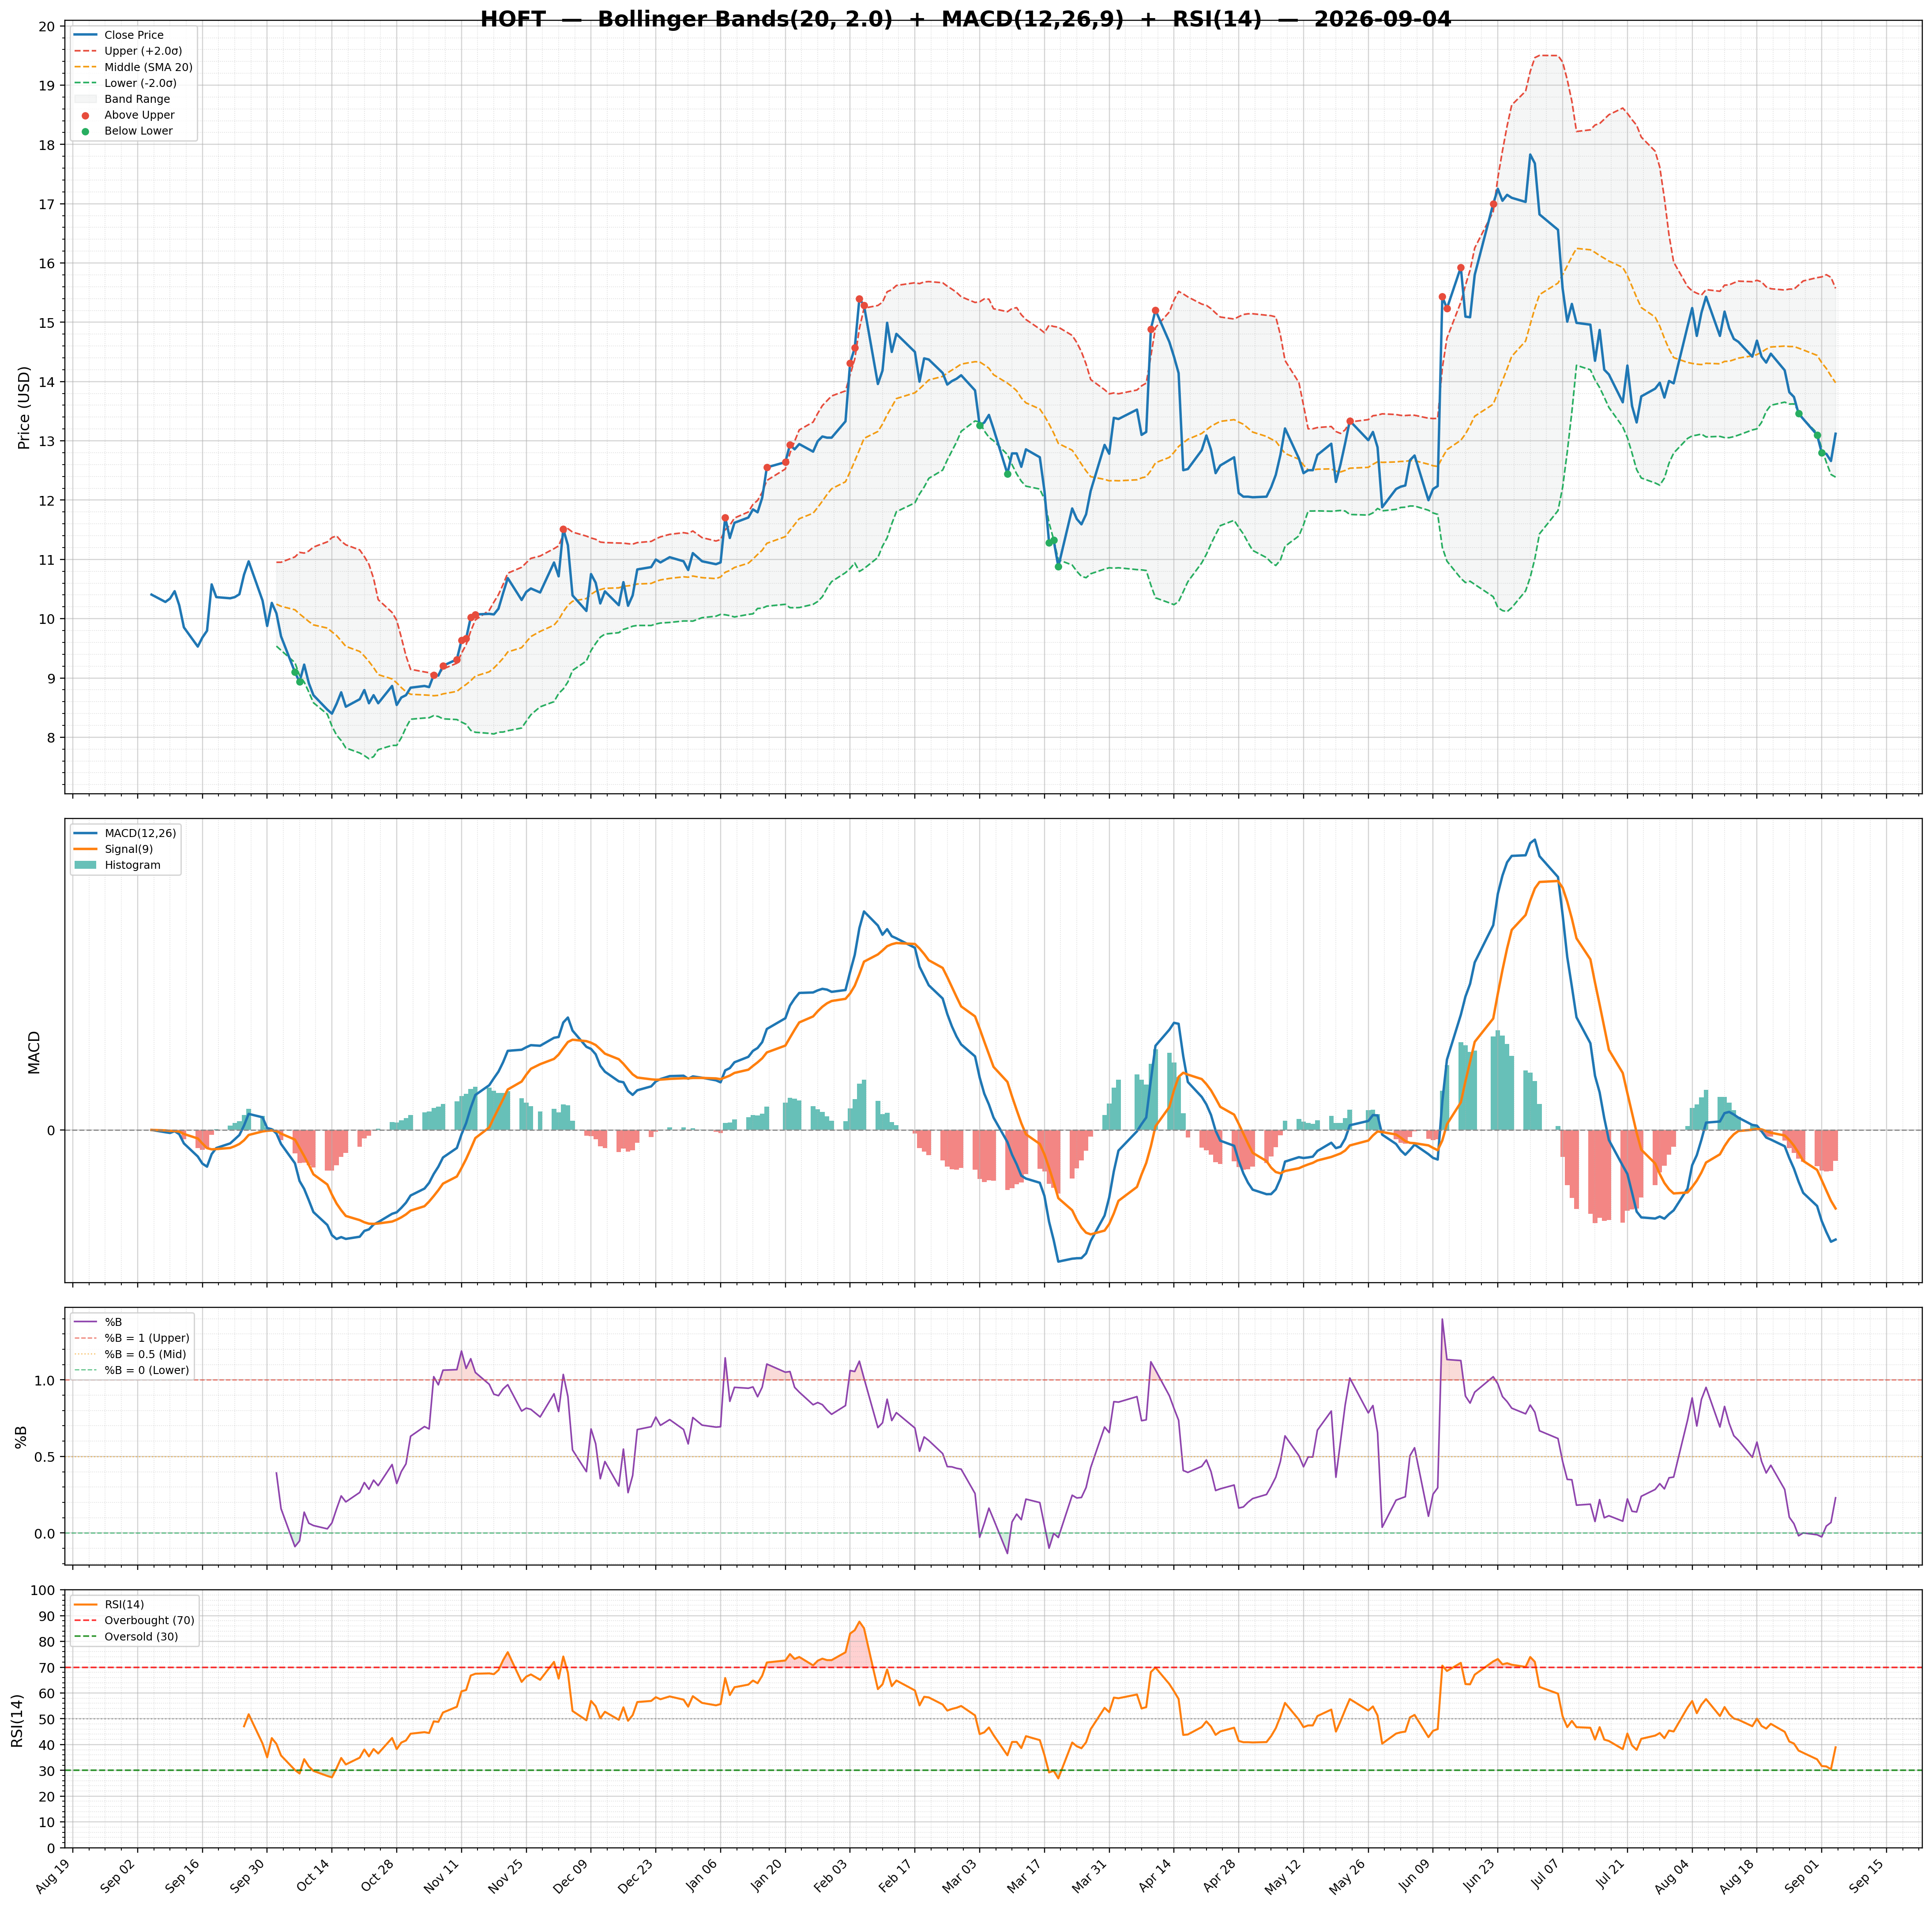
| RSI | 45.80 | Volume | 0.04M | Rating | none |
| Previous RSI | 45.27 | Avg Volume 20D | 0.03M | Target Mean | $16.50 |
| RSI Trend | Up | Relative Volume | 0.62 | Target High | $17.00 |
| MACD | -0.14 | Lower Band | 12.39 | Target Low | $16.00 |
| MACD Signal | -0.17 | Middle Band | 12.84 | Target Median | $16.50 |
| Histogram | 0.03 | Upper Band | 13.30 | Analysts | 2 |
| Previous Histogram | 0.03 | Bandwidth | 7.120 | Upside | 28.40% |
| Histogram Trend | Increasing | %B | 0.42 | ||