Hurco Companies, Inc. (HURC)
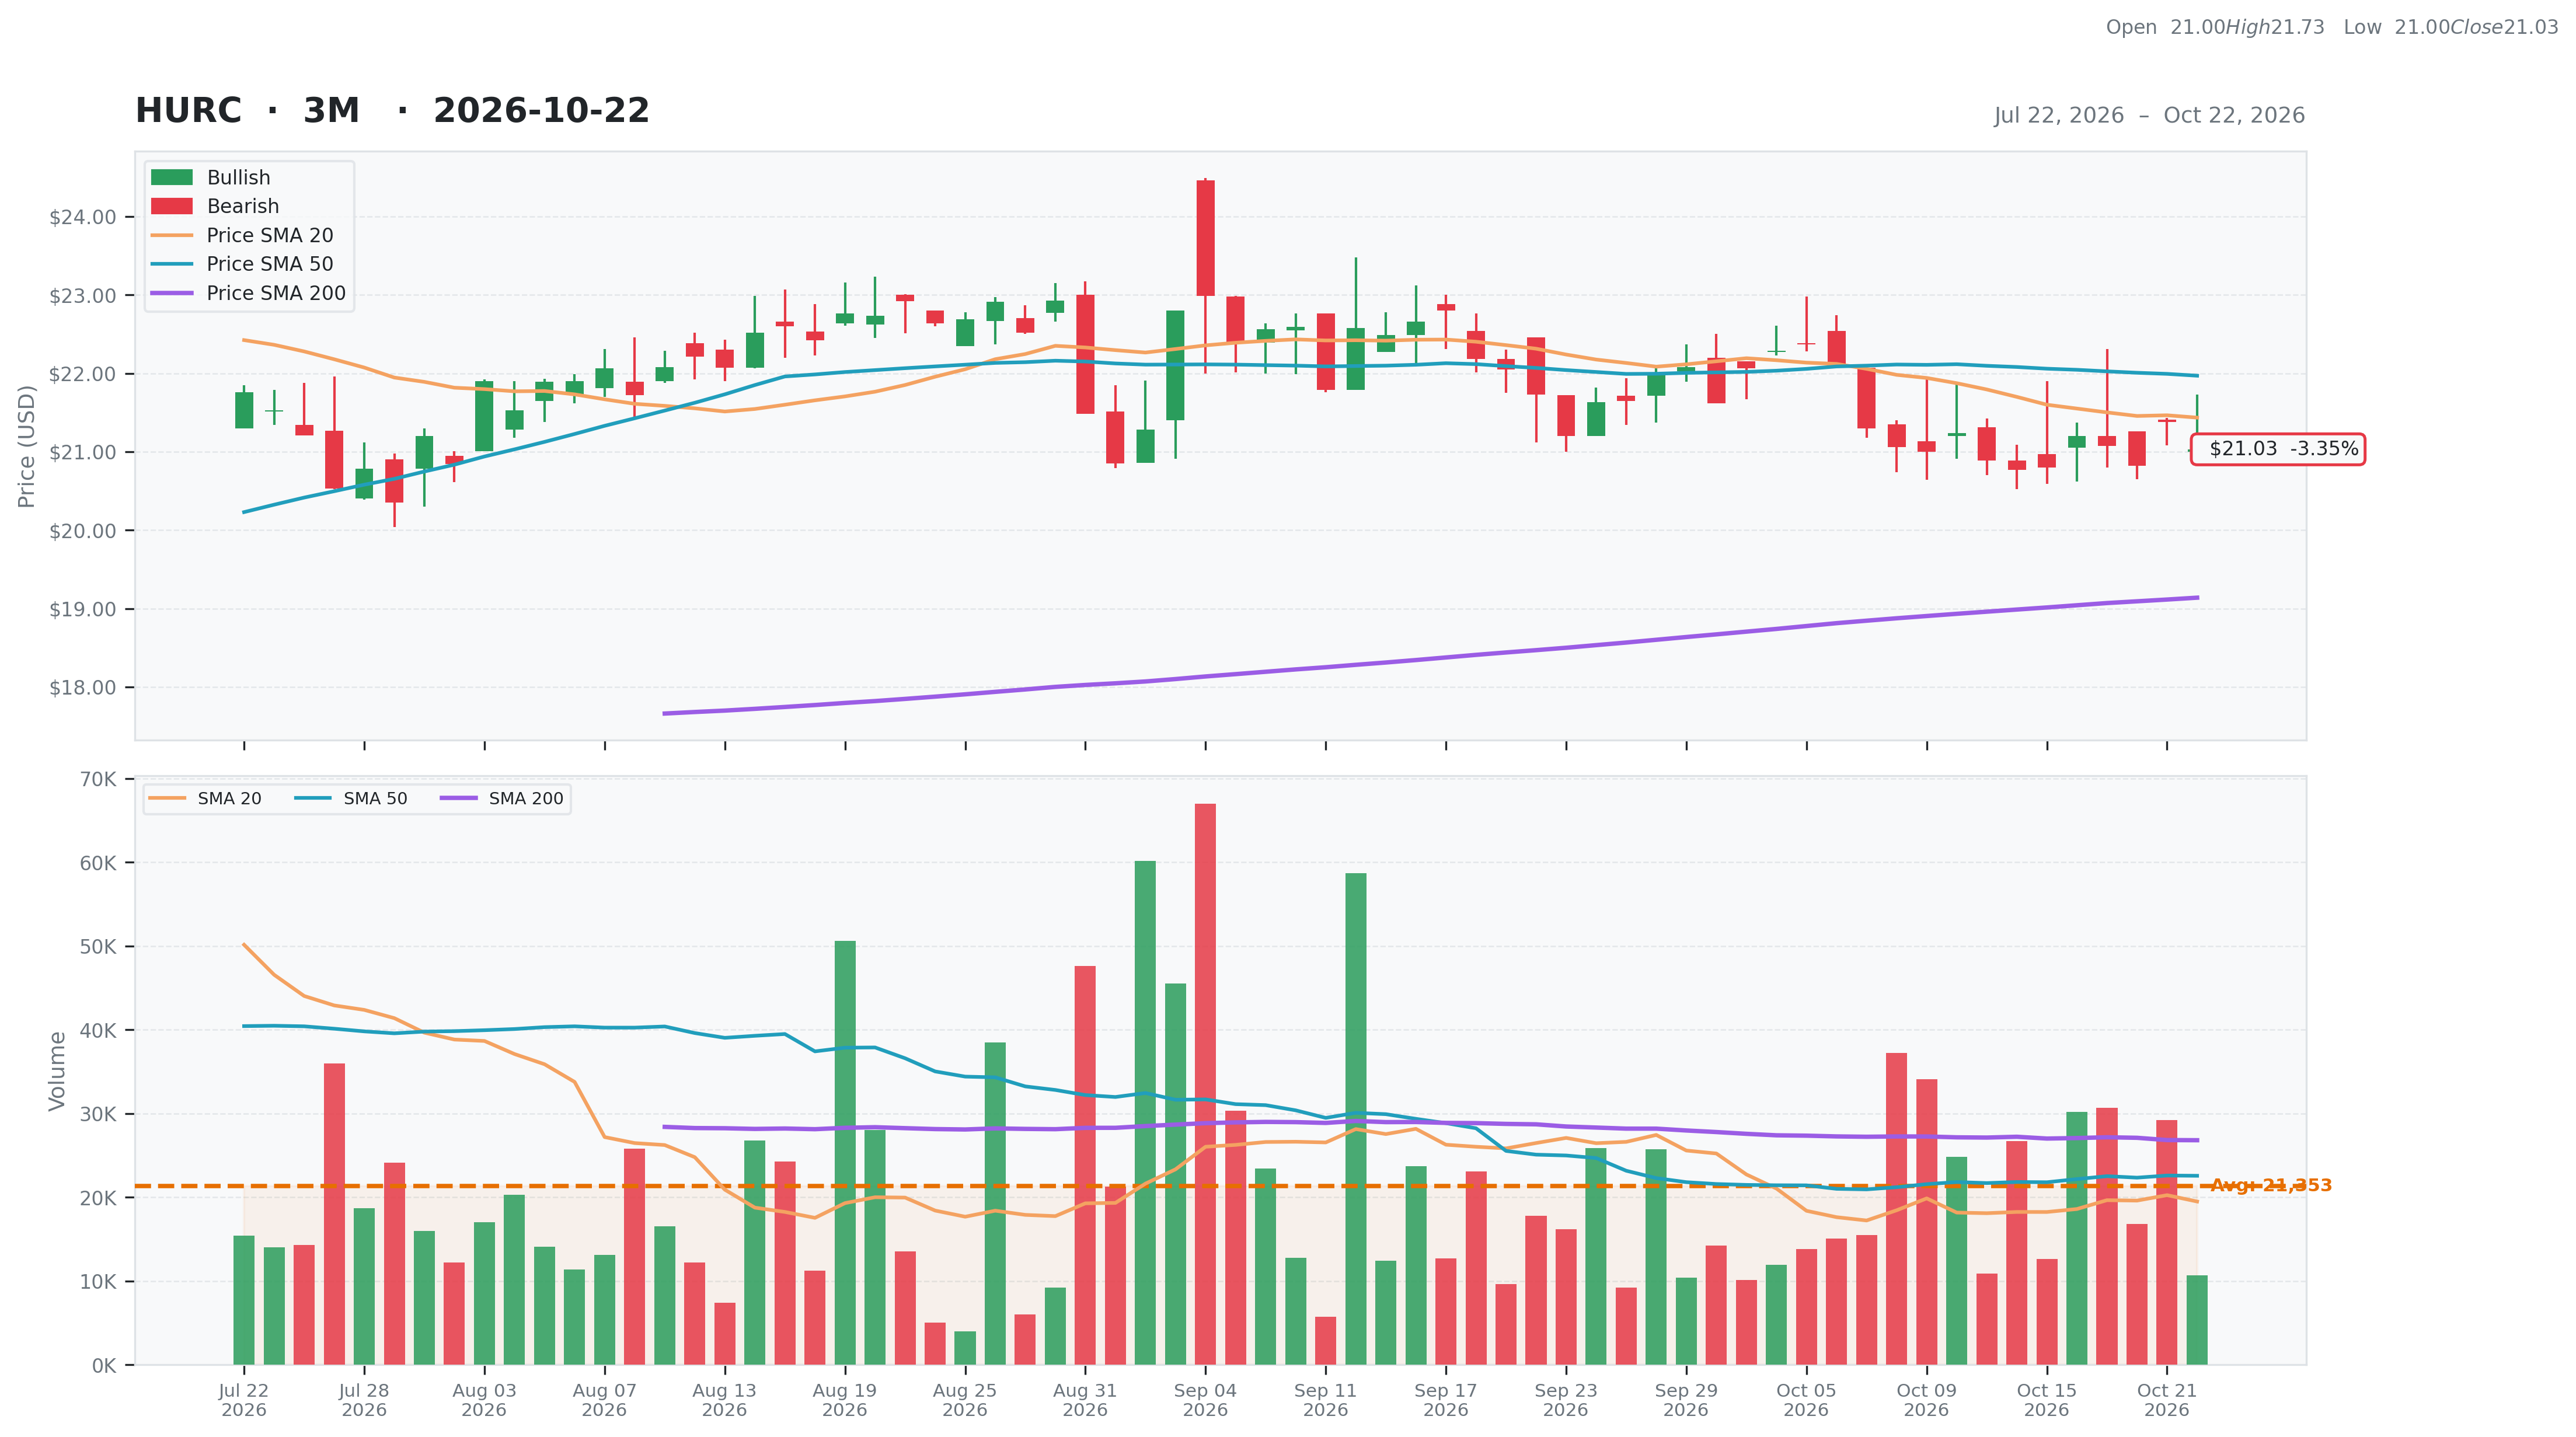
Industrials • Specialty Industrial Machinery • $21.03 • MCap: 137,298,032
https://www.hurco.com • Hurco Companies, Inc., an industrial technology company, designs, manufactures, and sells computerized machine tools to companies in the metal cutting industry in the Americas, Europe, Asia Pacific, and internationally. Its principal products include general-purpose computerized machine tools, including vertical and horizontal machining centers, turning centers, and toolroom machines. The company also provides computer control systems and related software for press brake applications. In addition, it offers machine tool components, automation integration equipment, and solutions for job shops; and software options, control upgrades, and accessories and replacement parts for its products, as well as customer service, training, and applications support services. Further, the company provides Autobend computer control systems for press brake machines; and WinMax, an integrated Hurco CNC Control software. It serves independent job shops and specialized short-run production applications within large manufacturing operations, as well as precision tool, die, and mold manufacturers in aerospace, defense, medical equipment, energy, automotive/transportation, electronics, and computer industries. The company sells its products under the Hurco, Milltronics, and Takumi brands through independent agents and distributors, as well as through its direct sales and service organizations. Hurco Companies, Inc. was founded in 1968 and is headquartered in Indianapolis, Indiana.
Ex-AAII
| Score | Price | 52 Week & Averages | Relative Strength | Risk | |||||
|---|---|---|---|---|---|---|---|---|---|
| Total | 46 | Current | $21.03 | 52W High | $23.32 -9.82% | Relative Strength | 0.13 | Beta | 0.72 |
| Business Quality | 6 | Weekly | $20.80 1.11% | 52W Low | $14.68 43.26% | 3M | -0.01 | Short % | 0 |
| Financial Strength | 13 | Monthly | $21.73 -3.22% | Above 50DMA | $21.97 -4.27% | 6M | 0.29 | Risk Score | 5 |
| Growth Outlook | 1 | Quarterly | $21.21 -0.85% | Above 200DMA | $19.14 9.89% | 9M | 0.26 | ||
| Momentum | 2 | Yearly | $18.06 16.45% | 12M | 0.14 | ||||
| Valuation | Financial Strength | Growth/Profitability | |||
|---|---|---|---|---|---|
| Trailing P/E | N/A | Cash | 52M | Revenue Growth | 0.03% |
| Forward P/E | N/A | Debt | 10M | Earnings Growth | N/A |
| PEG Ratio | 0.51 | Debt/Equity | 5.12 | Qtr Earnings Growth | N/A |
| Price/Sales | 0.75 | Current Ratio | 3.98 | Gross Margin | 0.21% |
| Price/Book | 0.71 | Quick Ratio | 1.41 | Operating Margin | 0.05% |
| EV/Revenue | 0.52 | Operating CF | 9M | Profit Margin | -0.04% |
| EV/EBITDA | -29.97 | Free CF | 16M | EBITDA Margin | -0.02% |
| Ent Value | 95M | Return on Assets | -0.01% | ||
| Return on Equity | -0.03% | ||||
| Technical | Volume & Bollinger Bands | Analyst | |||
|---|---|---|---|---|---|
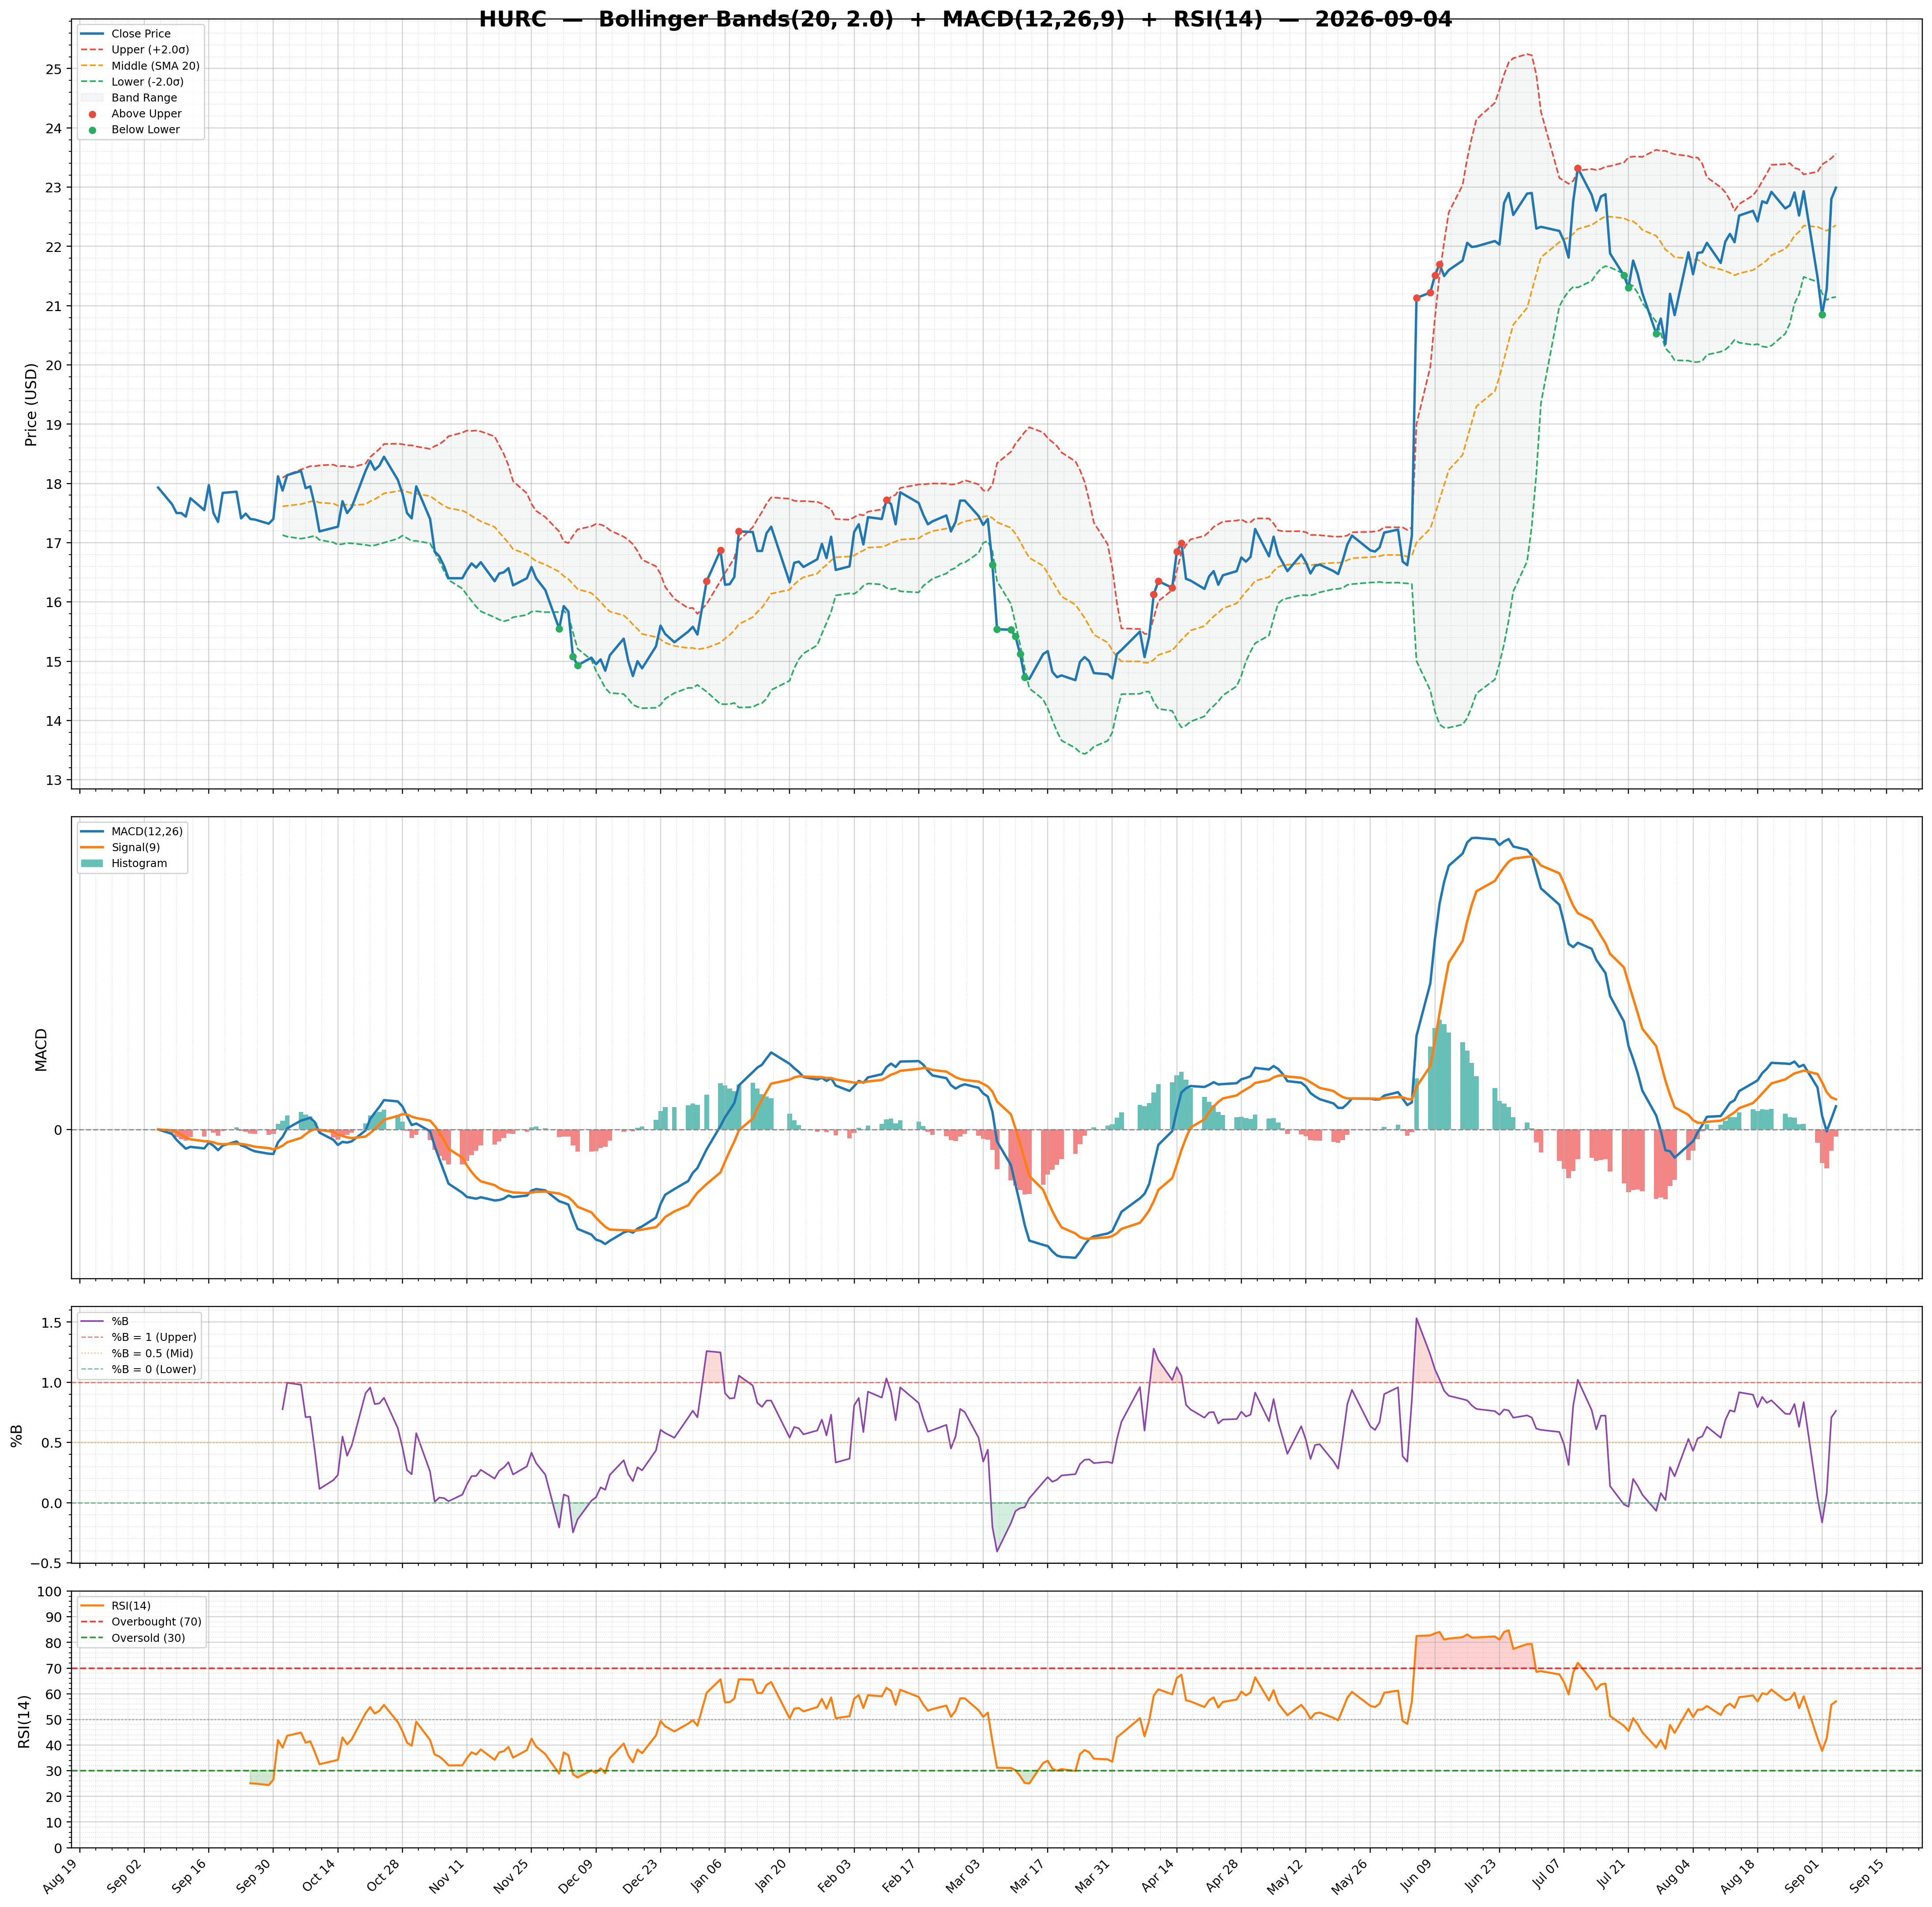
| RSI | 44.46 | Volume | 0.03M | Rating | none |
| Previous RSI | 48.37 | Avg Volume 20D | 0.02M | Target Mean | N/A |
| RSI Trend | Down | Relative Volume | 0.54 | Target High | N/A |
| MACD | -0.27 | Lower Band | 20.36 | Target Low | N/A |
| MACD Signal | -0.27 | Middle Band | 21.43 | Target Median | N/A |
| Histogram | -0.01 | Upper Band | 22.51 | Analysts | N/A |
| Previous Histogram | -0.01 | Bandwidth | 10.010 | Upside | N/A |
| Histogram Trend | Increasing | %B | 0.31 | ||