Huron Consulting Group Inc. (HURN)
Industrials • Consulting Services • $193.35 • MCap: 2,782,035,200
https://www.huronconsultinggroup.com • Huron Consulting Group Inc. provides global professional services in the United States and internationally. It operates through three segments: Healthcare, Education, and Commercial. The company offers financial and operational performance improvement consulting services; digital services; spanning technology and analytic-related services, including enterprise health record, enterprise resource planning, enterprise performance management, customer relationship management, data management, artificial intelligence and automation, technology managed services, and a portfolio of software products; organizational transformation; revenue cycle managed services and outsourcing; financial and capital advisory consulting; and strategy and innovation consulting. It also provides research-focused consulting and managed services, as well as Huron Research product suite, a software suite designed to facilitate and improve research administration service delivery and compliance. In addition, the company offers software products, financial capital advisory services, regulatory compliance and risk management consulting, and Commercial consulting. The company serves healthcare, education, financial services, industrials and manufacturing, energy and utilities, public sector, and other commercial industries. The company was incorporated in 2002 and is headquartered in Chicago, Illinois.
ET
| Score | Price | 52 Week & Averages | Relative Strength | Risk | |||||
|---|---|---|---|---|---|---|---|---|---|
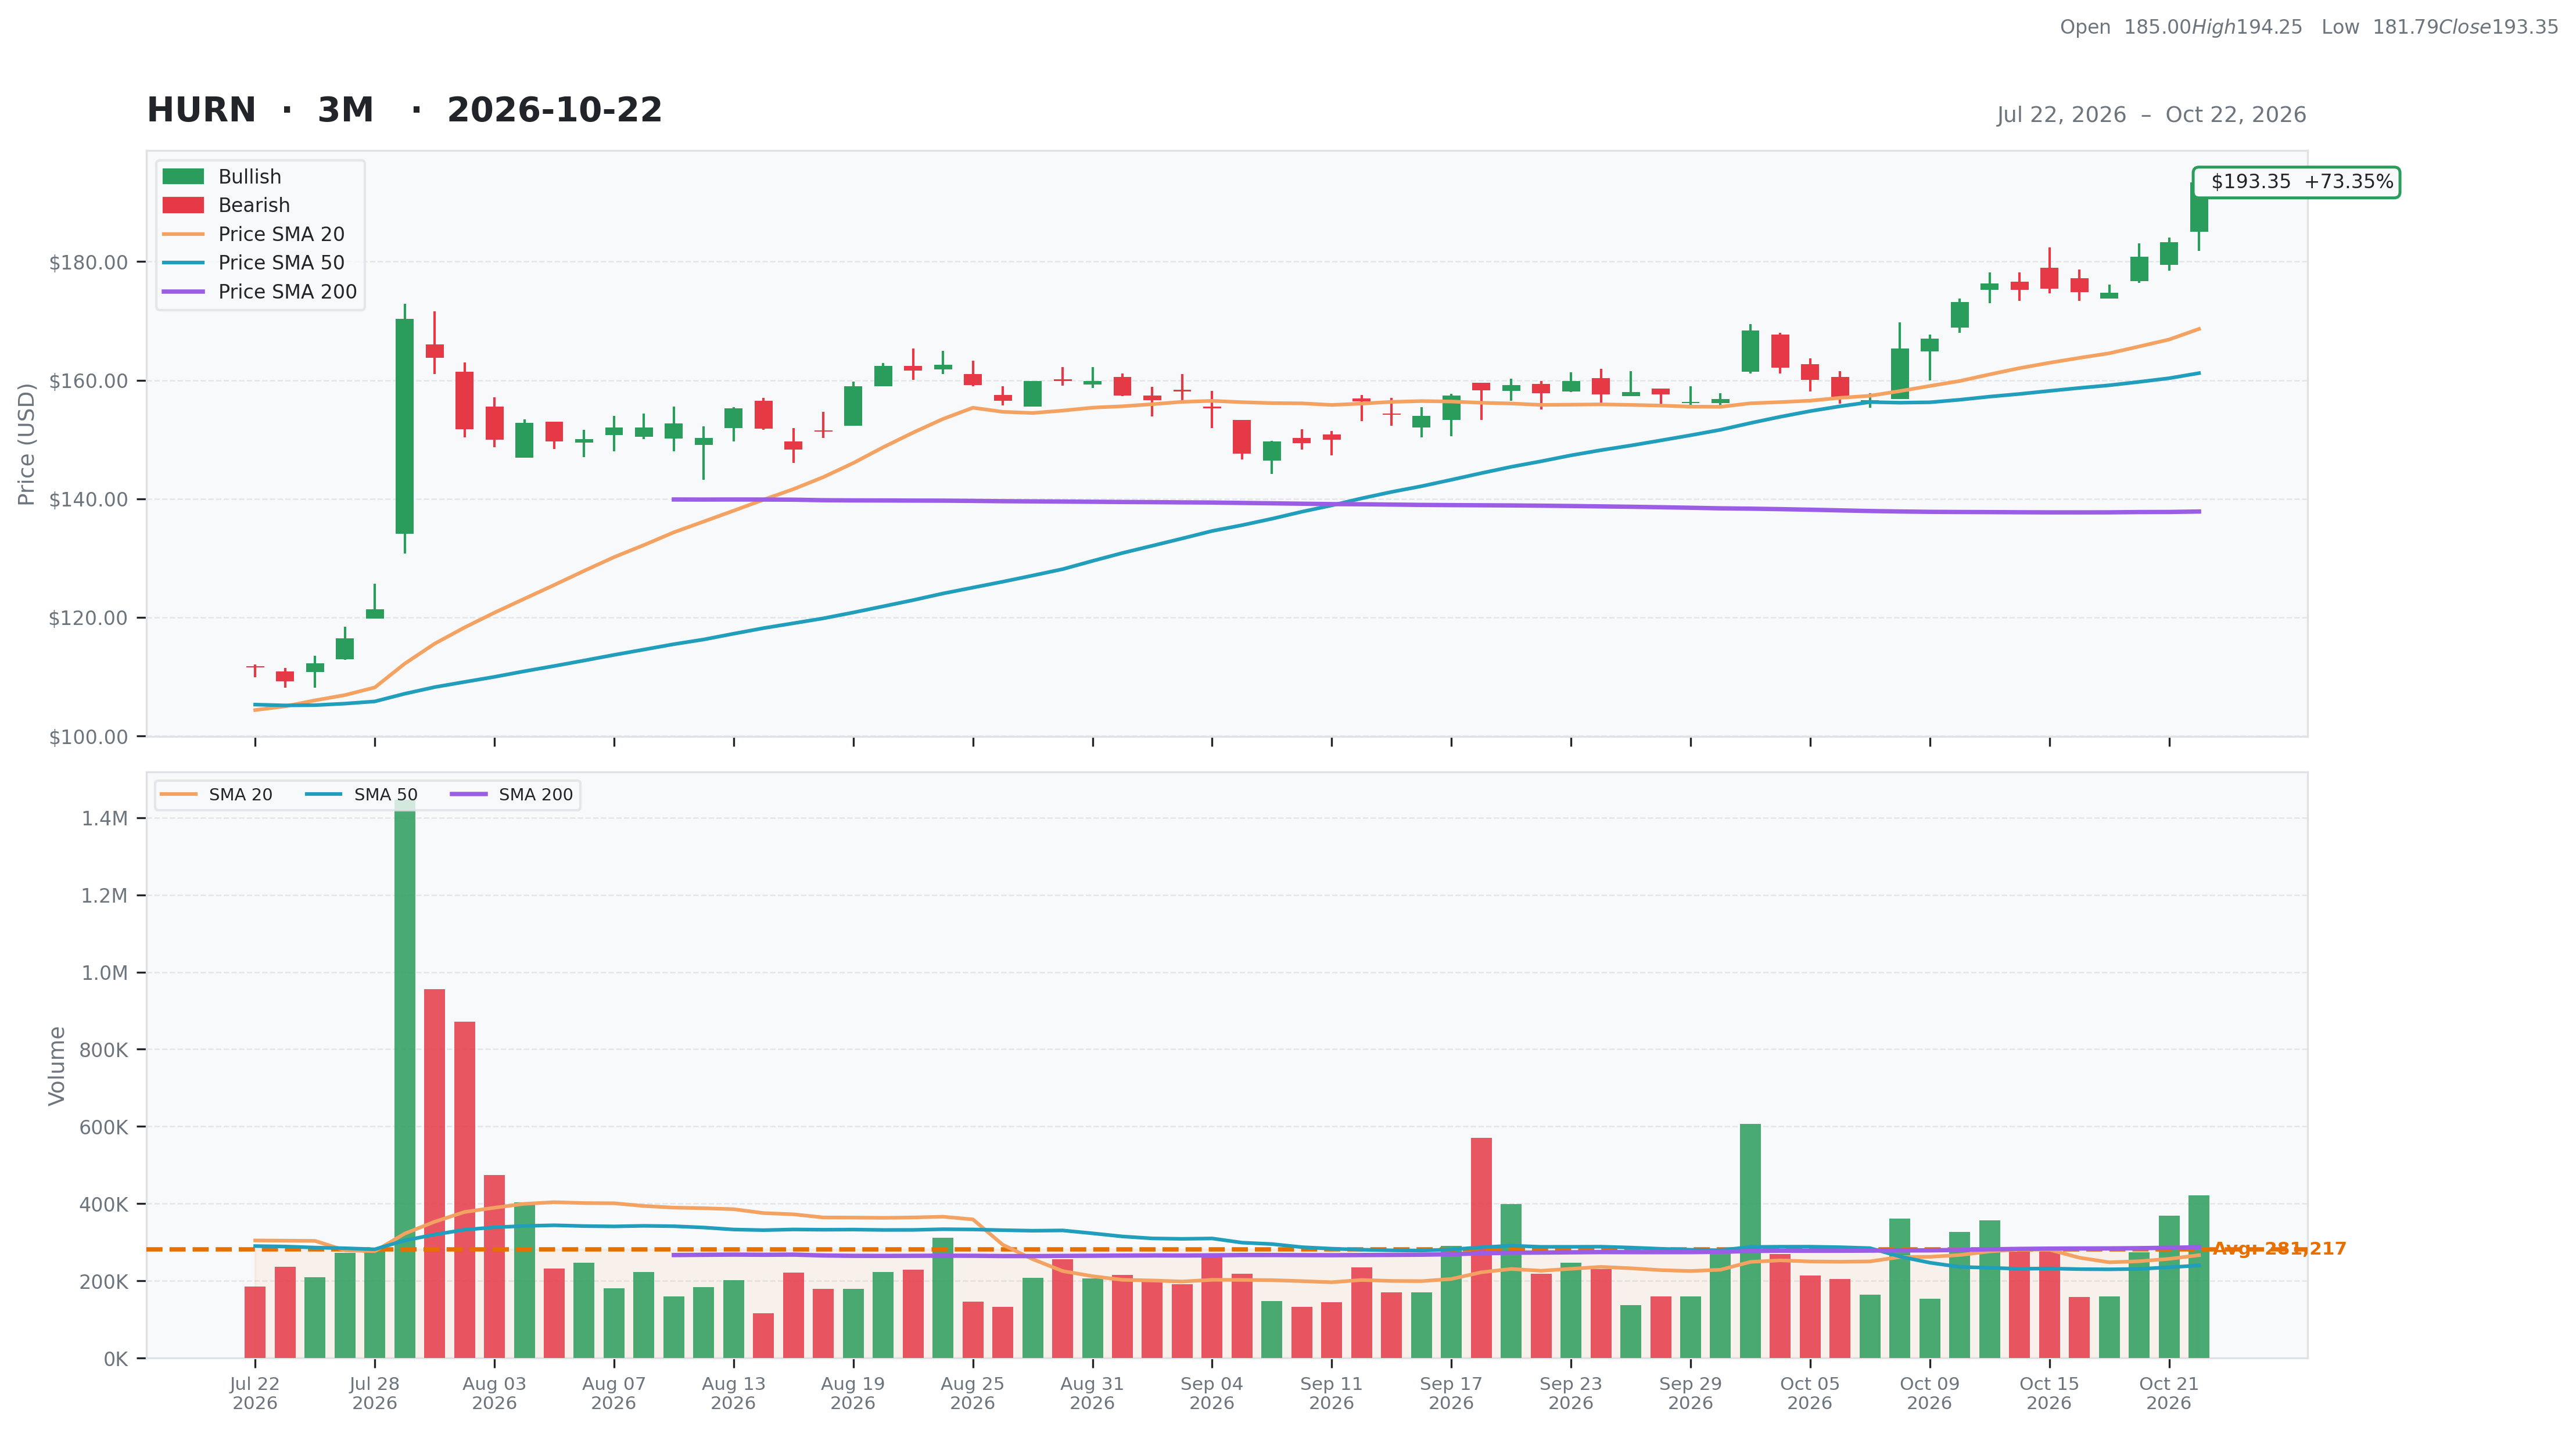
| Total | 61 | Current | $193.35 | 52W High | $193.35 0.00% | Relative Strength | 0.48 | Beta | 0.09 |
| Business Quality | 11 | Weekly | $175.47 10.19% | 52W Low | $90.16 114.45% | 3M | 0.72 | Short % | 0.05 |
| Financial Strength | 14 | Monthly | $157.86 22.48% | Above 50DMA | $161.20 19.94% | 6M | 0.59 | Risk Score | 3 |
| Growth Outlook | 15 | Quarterly | $112.30 72.17% | Above 200DMA | $137.86 40.25% | 9M | 0.11 | ||
| Momentum | 4 | Yearly | $153.64 25.85% | 12M | 0.26 | ||||
| Valuation | Financial Strength | Growth/Profitability | |||
|---|---|---|---|---|---|
| Trailing P/E | 26.33 | Cash | 32M | Revenue Growth | 0.16% |
| Forward P/E | 16.51 | Debt | 865M | Earnings Growth | 0.75% |
| PEG Ratio | 1.47 | Debt/Equity | 224.86 | Qtr Earnings Growth | 0.61% |
| Price/Sales | 1.57 | Current Ratio | 1.71 | Gross Margin | 0.33% |
| Price/Book | 6.80 | Quick Ratio | 1.58 | Operating Margin | 0.12% |
| EV/Revenue | 1.94 | Operating CF | 178M | Profit Margin | 0.07% |
| EV/EBITDA | 14.13 | Free CF | 151M | EBITDA Margin | 0.14% |
| Ent Value | 3,438M | Return on Assets | 0.09% | ||
| Return on Equity | 0.27% | ||||
| Technical | Volume & Bollinger Bands | Analyst | |||
|---|---|---|---|---|---|
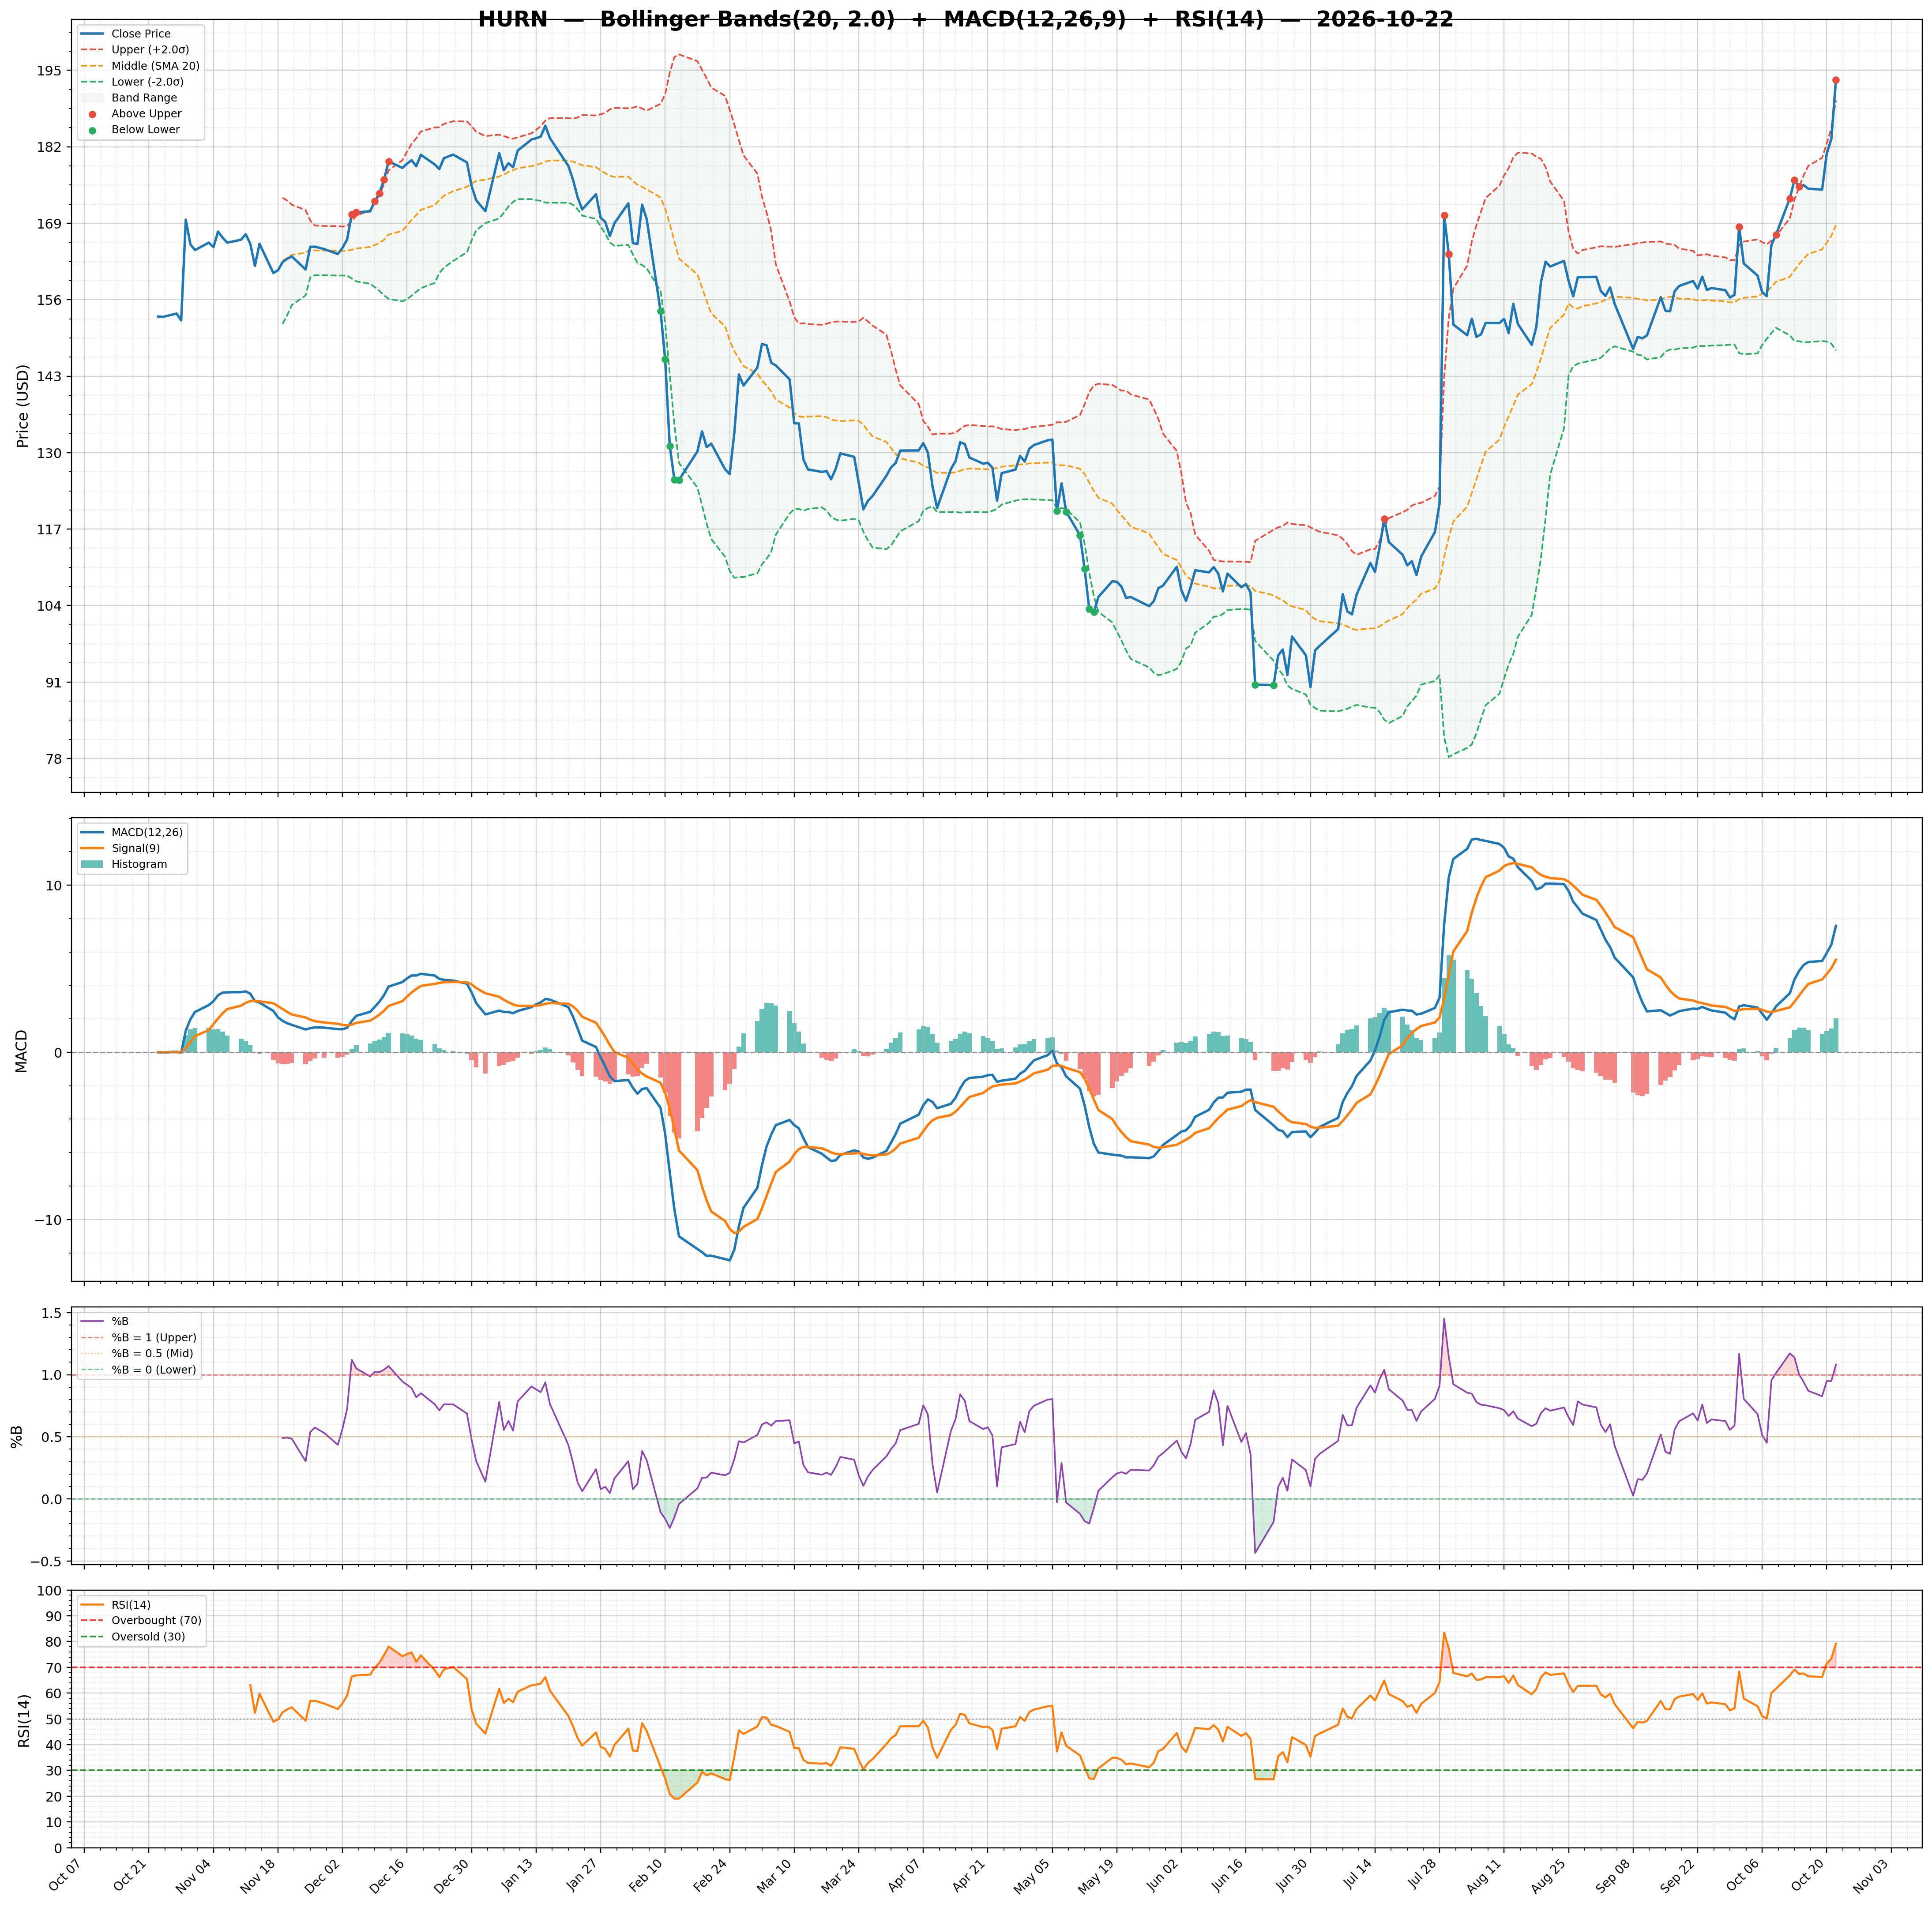
| RSI | 79.18 | Volume | 0.16M | Rating | none |
| Previous RSI | 73.38 | Avg Volume 20D | 0.27M | Target Mean | $190.75 |
| RSI Trend | Up | Relative Volume | 1.58 | Target High | $215.00 |
| MACD | 7.56 | Lower Band | 147.38 | Target Low | $160.00 |
| MACD Signal | 5.54 | Middle Band | 168.65 | Target Median | $194.00 |
| Histogram | 2.03 | Upper Band | 189.92 | Analysts | 4 |
| Previous Histogram | 1.41 | Bandwidth | 25.220 | Upside | 9.09% |
| Histogram Trend | Increasing | %B | 1.08 | ||