iShares Global Clean Energy ETF (ICLN)
• • $16.17 • MCap:
• The fund seeks to track the investment results of the index designed to track the performance of approximately 100 clean energy-related companies. The index is a subset of the S&P Global Broad Market Index and includes stocks traded on developed and emerging market exchanges which meet or exceed, at the time of inclusion, $300 million in total market capitalization, $100 million in float-adjusted market capitalization, and $3 million median daily value traded over a six-month period. It is non-diversified.
Sector
| Score | Price | 52 Week & Averages | Relative Strength | Risk | |||||
|---|---|---|---|---|---|---|---|---|---|
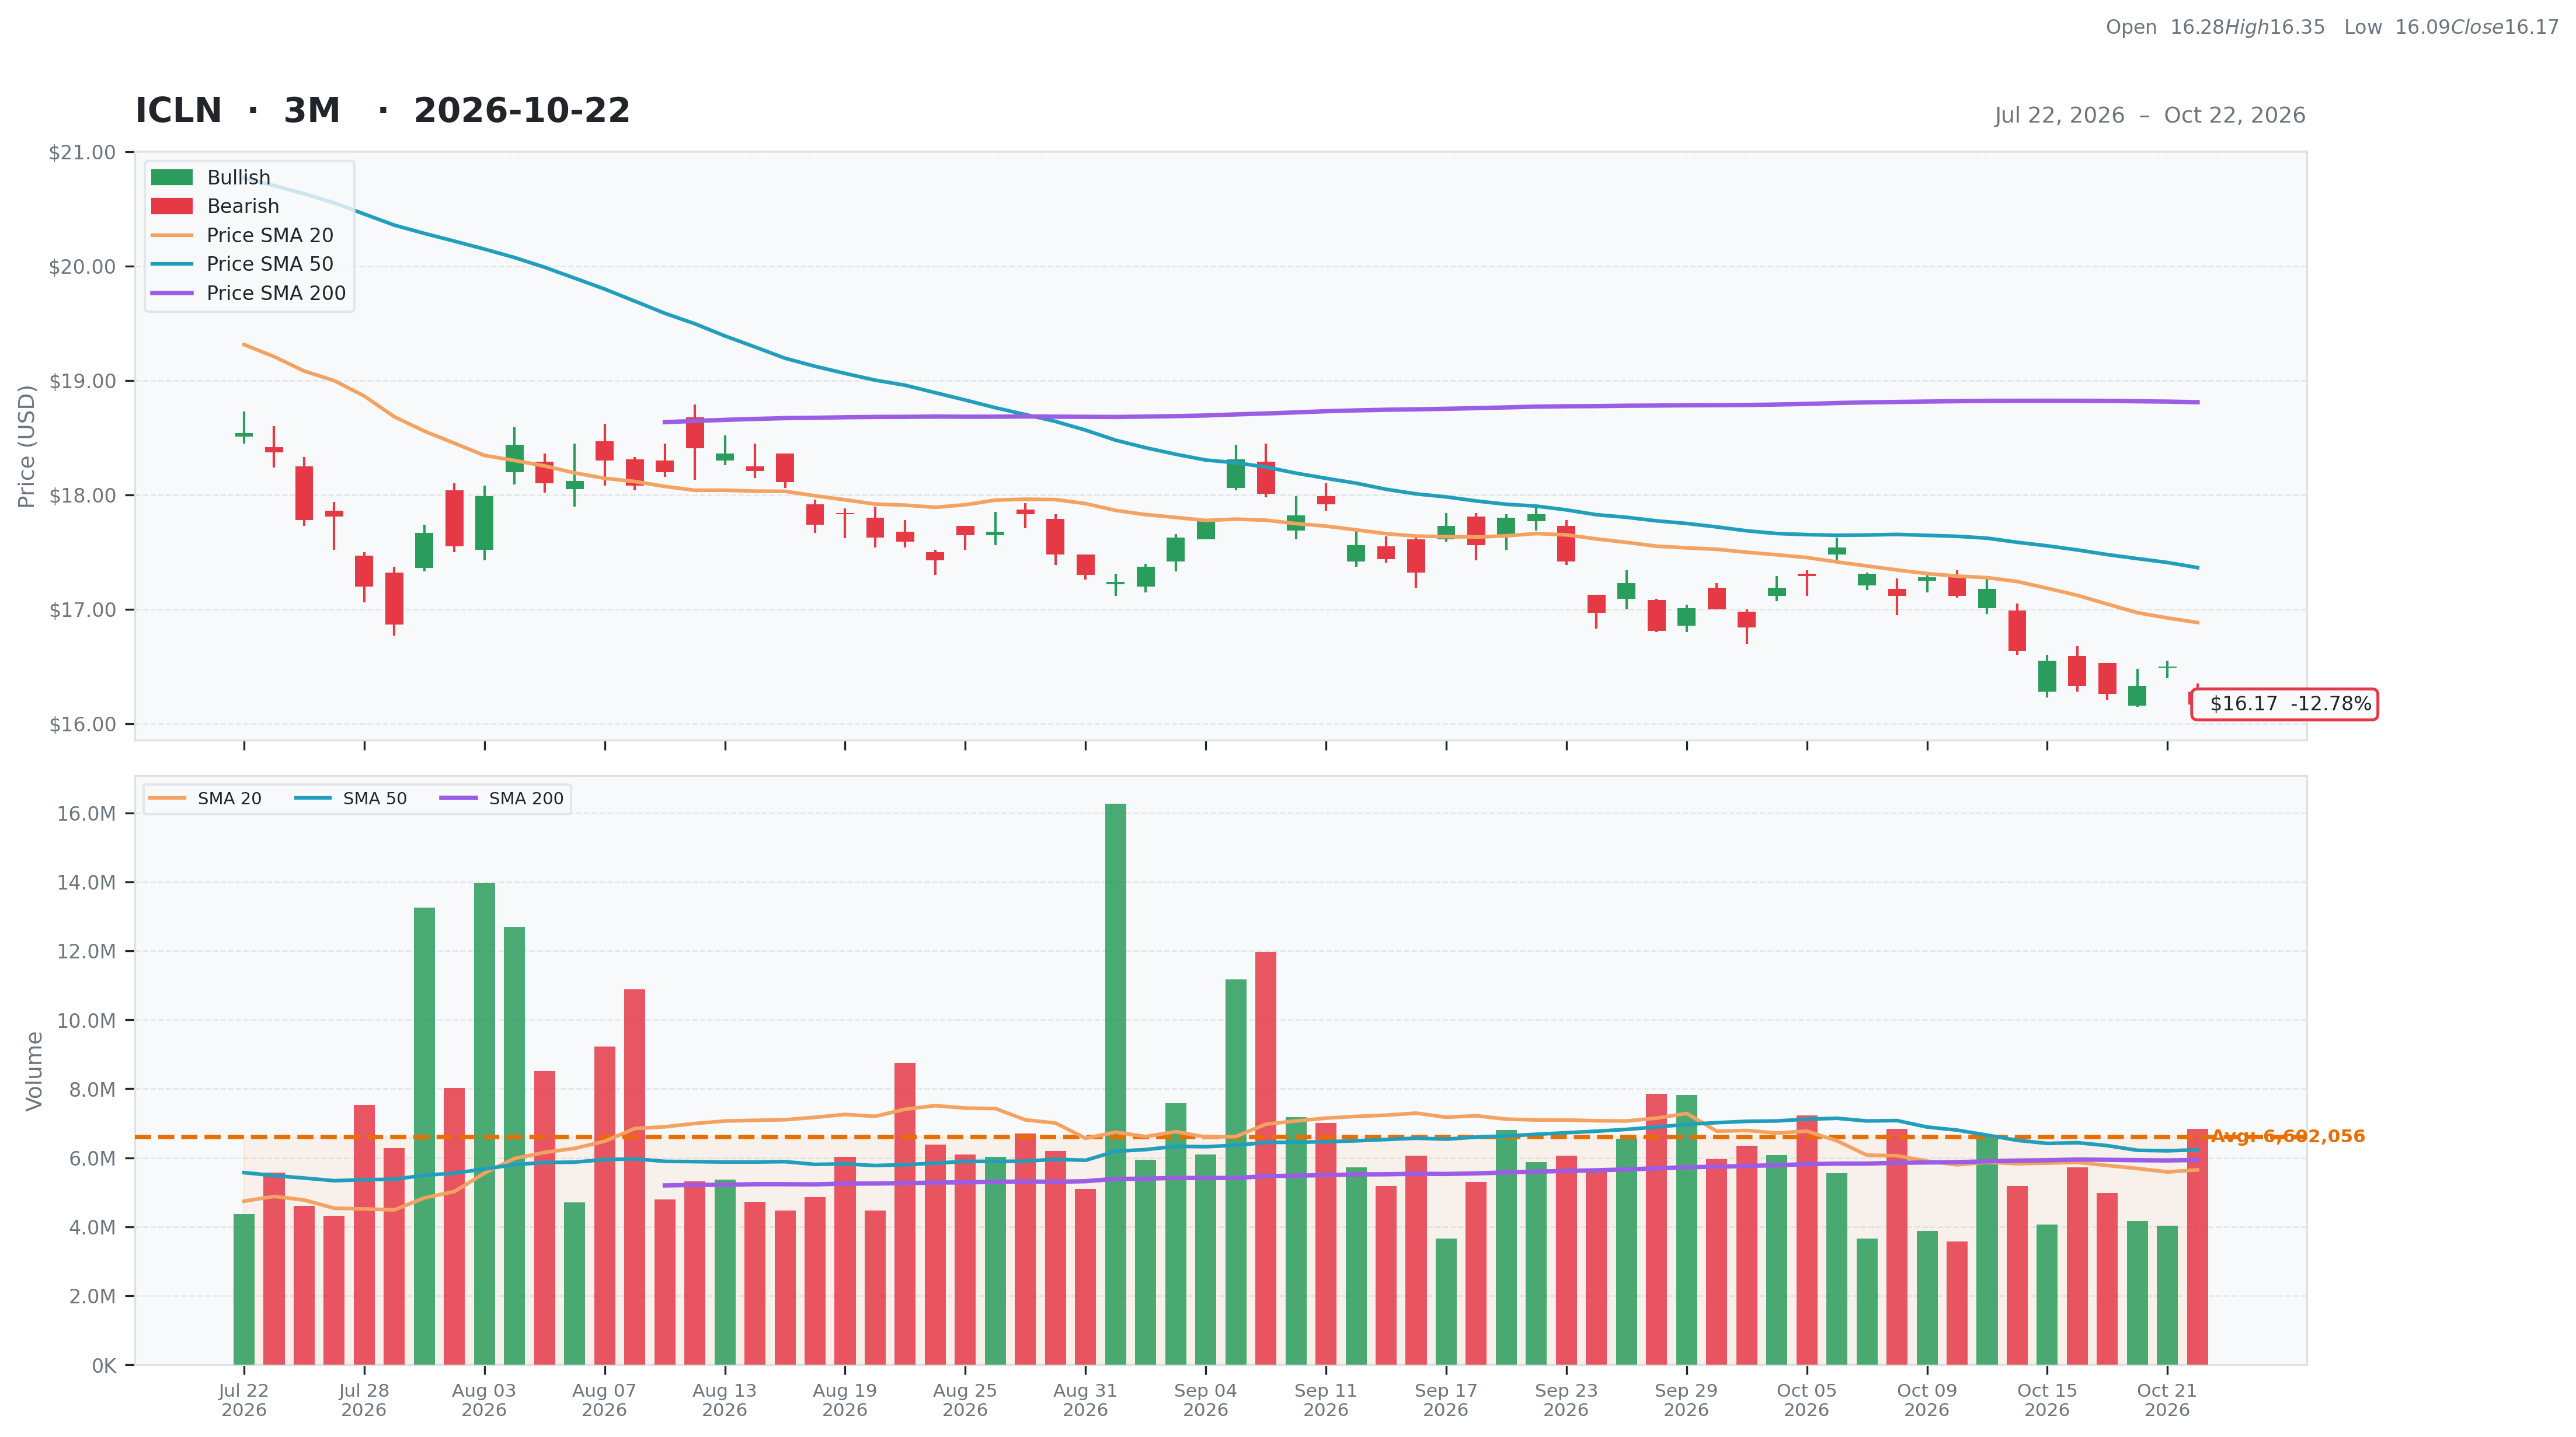
| Total | 26 | Current | $16.17 | 52W High | $23.69 -31.73% | Relative Strength | -0.10 | Beta | N/A |
| Business Quality | 1 | Weekly | $16.55 -2.30% | 52W Low | $15.90 1.68% | 3M | -0.09 | Short % | |
| Financial Strength | 6 | Monthly | $17.83 -9.31% | Above 50DMA | $17.36 -6.88% | 6M | -0.19 | Risk Score | |
| Growth Outlook | 1 | Quarterly | $17.78 -9.06% | Above 200DMA | $18.81 -14.04% | 9M | -0.10 | ||
| Momentum | 0 | Yearly | $16.58 -2.45% | 12M | -0.02 | ||||
| Valuation | Financial Strength | Growth/Profitability | |||
|---|---|---|---|---|---|
| Trailing P/E | 19.82 | Cash | N/A | Revenue Growth | N/A |
| Forward P/E | N/A | Debt | N/A | Earnings Growth | N/A |
| PEG Ratio | N/A | Debt/Equity | N/A | Qtr Earnings Growth | N/A |
| Price/Sales | N/A | Current Ratio | N/A | Gross Margin | N/A |
| Price/Book | N/A | Quick Ratio | N/A | Operating Margin | N/A |
| EV/Revenue | N/A | Operating CF | N/A | Profit Margin | N/A |
| EV/EBITDA | N/A | Free CF | N/A | EBITDA Margin | N/A |
| Ent Value | N/A | Return on Assets | N/A | ||
| Return on Equity | N/A | ||||
| Technical | Volume & Bollinger Bands | Analyst | |||
|---|---|---|---|---|---|
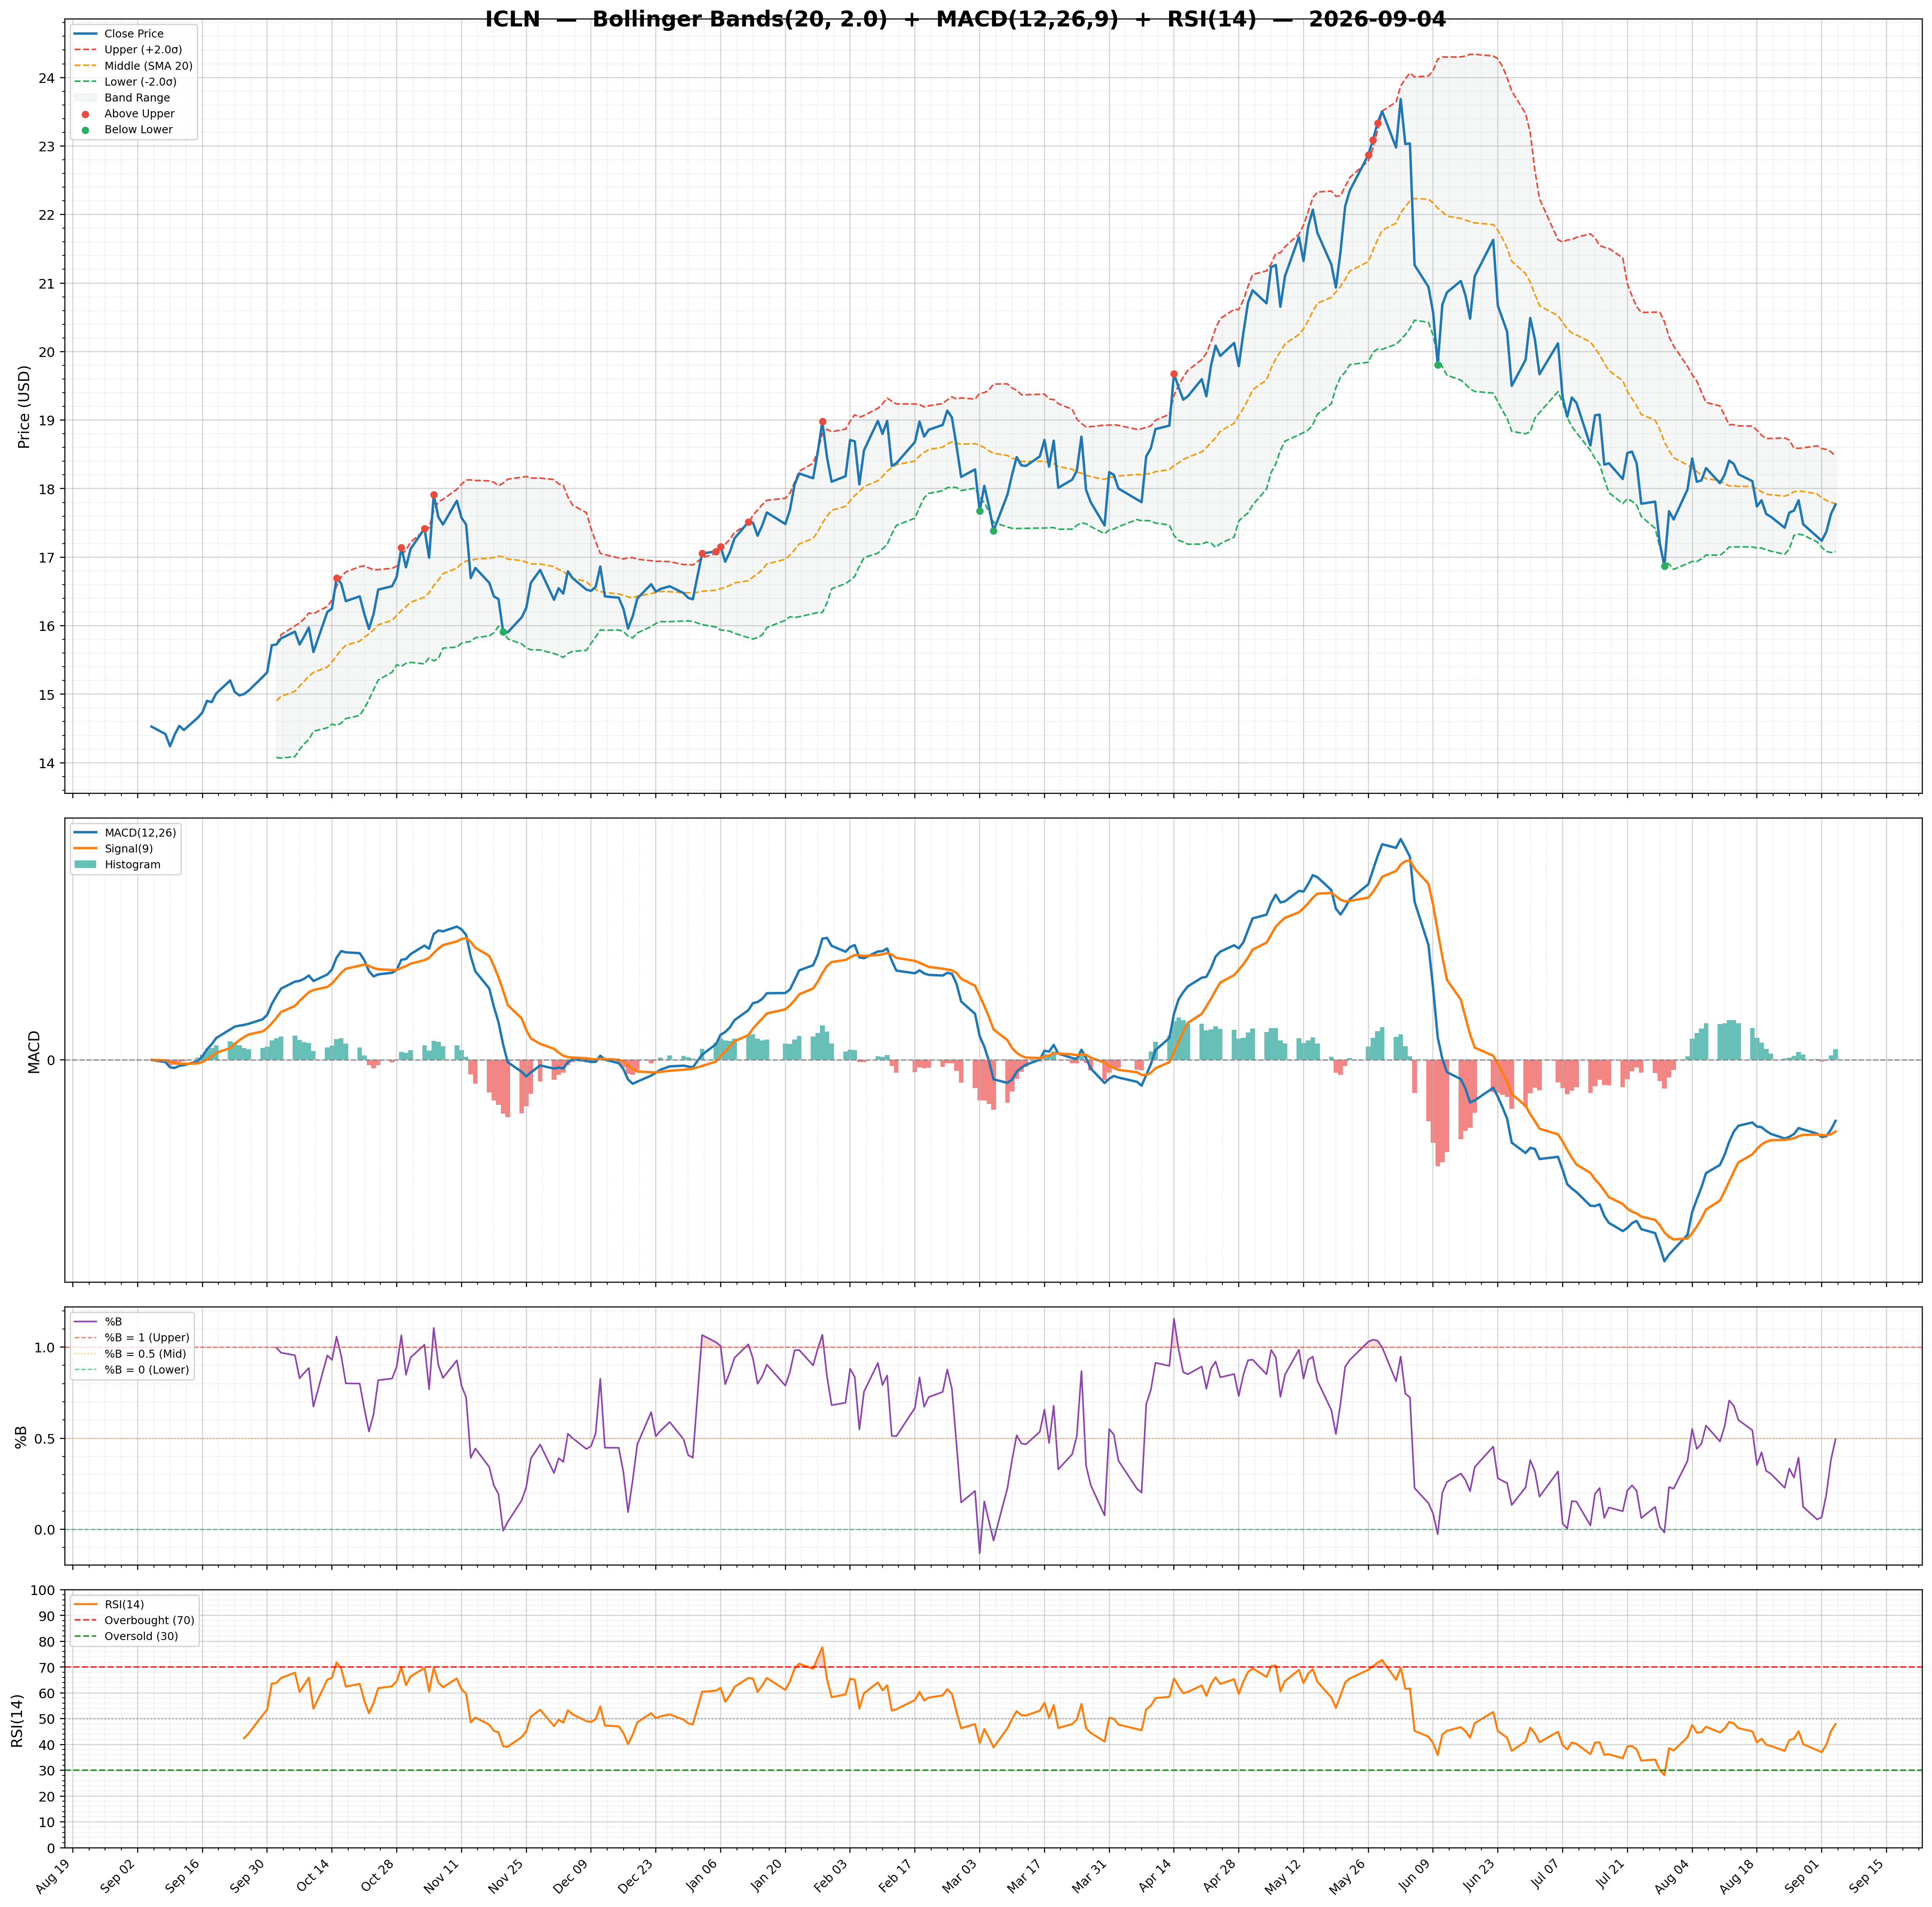
| RSI | 35.07 | Volume | 5.72M | Rating | |
| Previous RSI | 39.58 | Avg Volume 20D | 5.65M | Target Mean | N/A |
| RSI Trend | Down | Relative Volume | 1.20 | Target High | N/A |
| MACD | -0.32 | Lower Band | 16.06 | Target Low | N/A |
| MACD Signal | -0.26 | Middle Band | 16.89 | Target Median | N/A |
| Histogram | -0.06 | Upper Band | 17.71 | Analysts | N/A |
| Previous Histogram | -0.06 | Bandwidth | 9.740 | Upside | N/A |
| Histogram Trend | Decreasing | %B | 0.06 | ||