iShares Core S&P Small-Cap ETF (IJR)
• • $138.65 • MCap:
• The fund seeks to track the investment results of the S&P SmallCap 600 (the “underlying index”), which measures the performance of the small-capitalization sector of the U.S. equity market, as determined by S&P Dow Jones Indices LLC (the “index provider” or “SPDJI”). The underlying index consists of securities from a broad range of industries.
Ani
Joie
| Score | Price | 52 Week & Averages | Relative Strength | Risk | |||||
|---|---|---|---|---|---|---|---|---|---|
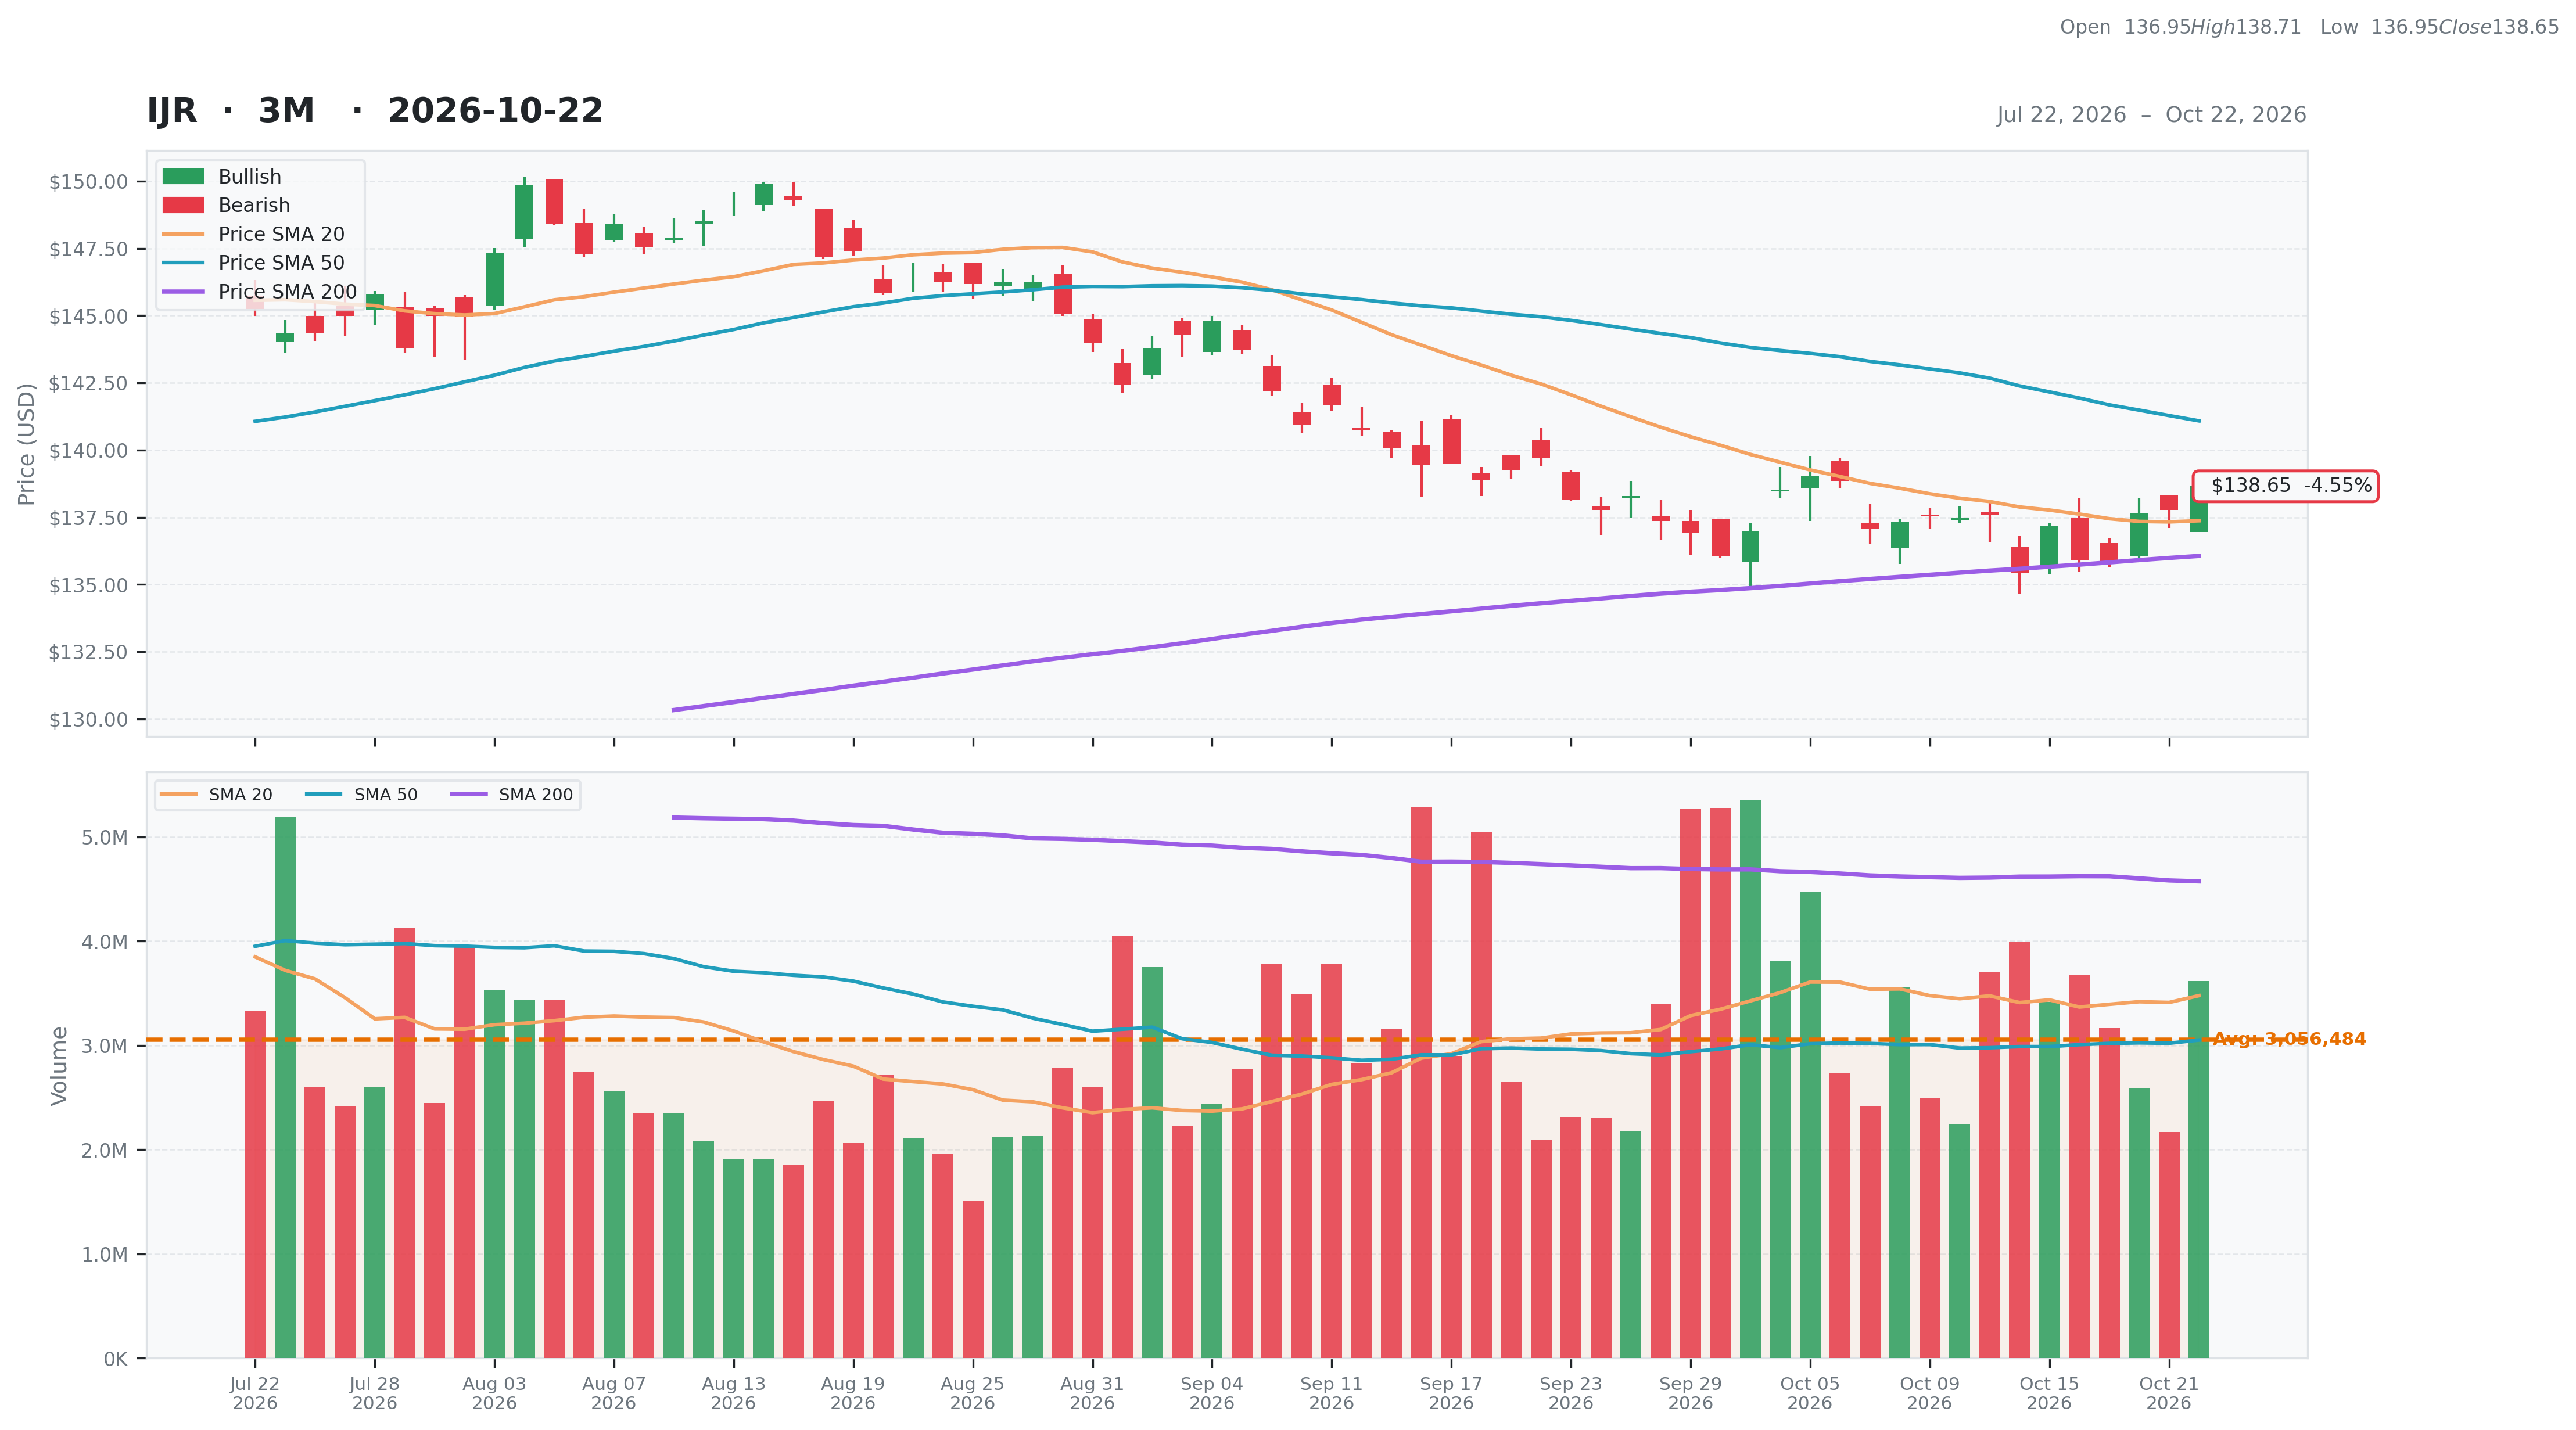
| Total | 28 | Current | $138.65 | 52W High | $149.90 -7.50% | Relative Strength | 0.04 | Beta | N/A |
| Business Quality | 1 | Weekly | $137.19 1.06% | 52W Low | $110.62 25.34% | 3M | -0.04 | Short % | |
| Financial Strength | 6 | Monthly | $139.70 -0.75% | Above 50DMA | $141.08 -1.73% | 6M | 0.03 | Risk Score | |
| Growth Outlook | 1 | Quarterly | $144.34 -3.94% | Above 200DMA | $136.06 1.90% | 9M | 0.07 | ||
| Momentum | 2 | Yearly | $119.60 15.92% | 12M | 0.16 | ||||
| Valuation | Financial Strength | Growth/Profitability | |||
|---|---|---|---|---|---|
| Trailing P/E | 17.15 | Cash | N/A | Revenue Growth | N/A |
| Forward P/E | N/A | Debt | N/A | Earnings Growth | N/A |
| PEG Ratio | N/A | Debt/Equity | N/A | Qtr Earnings Growth | N/A |
| Price/Sales | N/A | Current Ratio | N/A | Gross Margin | N/A |
| Price/Book | 1.24 | Quick Ratio | N/A | Operating Margin | N/A |
| EV/Revenue | N/A | Operating CF | N/A | Profit Margin | N/A |
| EV/EBITDA | N/A | Free CF | N/A | EBITDA Margin | N/A |
| Ent Value | N/A | Return on Assets | N/A | ||
| Return on Equity | N/A | ||||
| Technical | Volume & Bollinger Bands | Analyst | |||
|---|---|---|---|---|---|
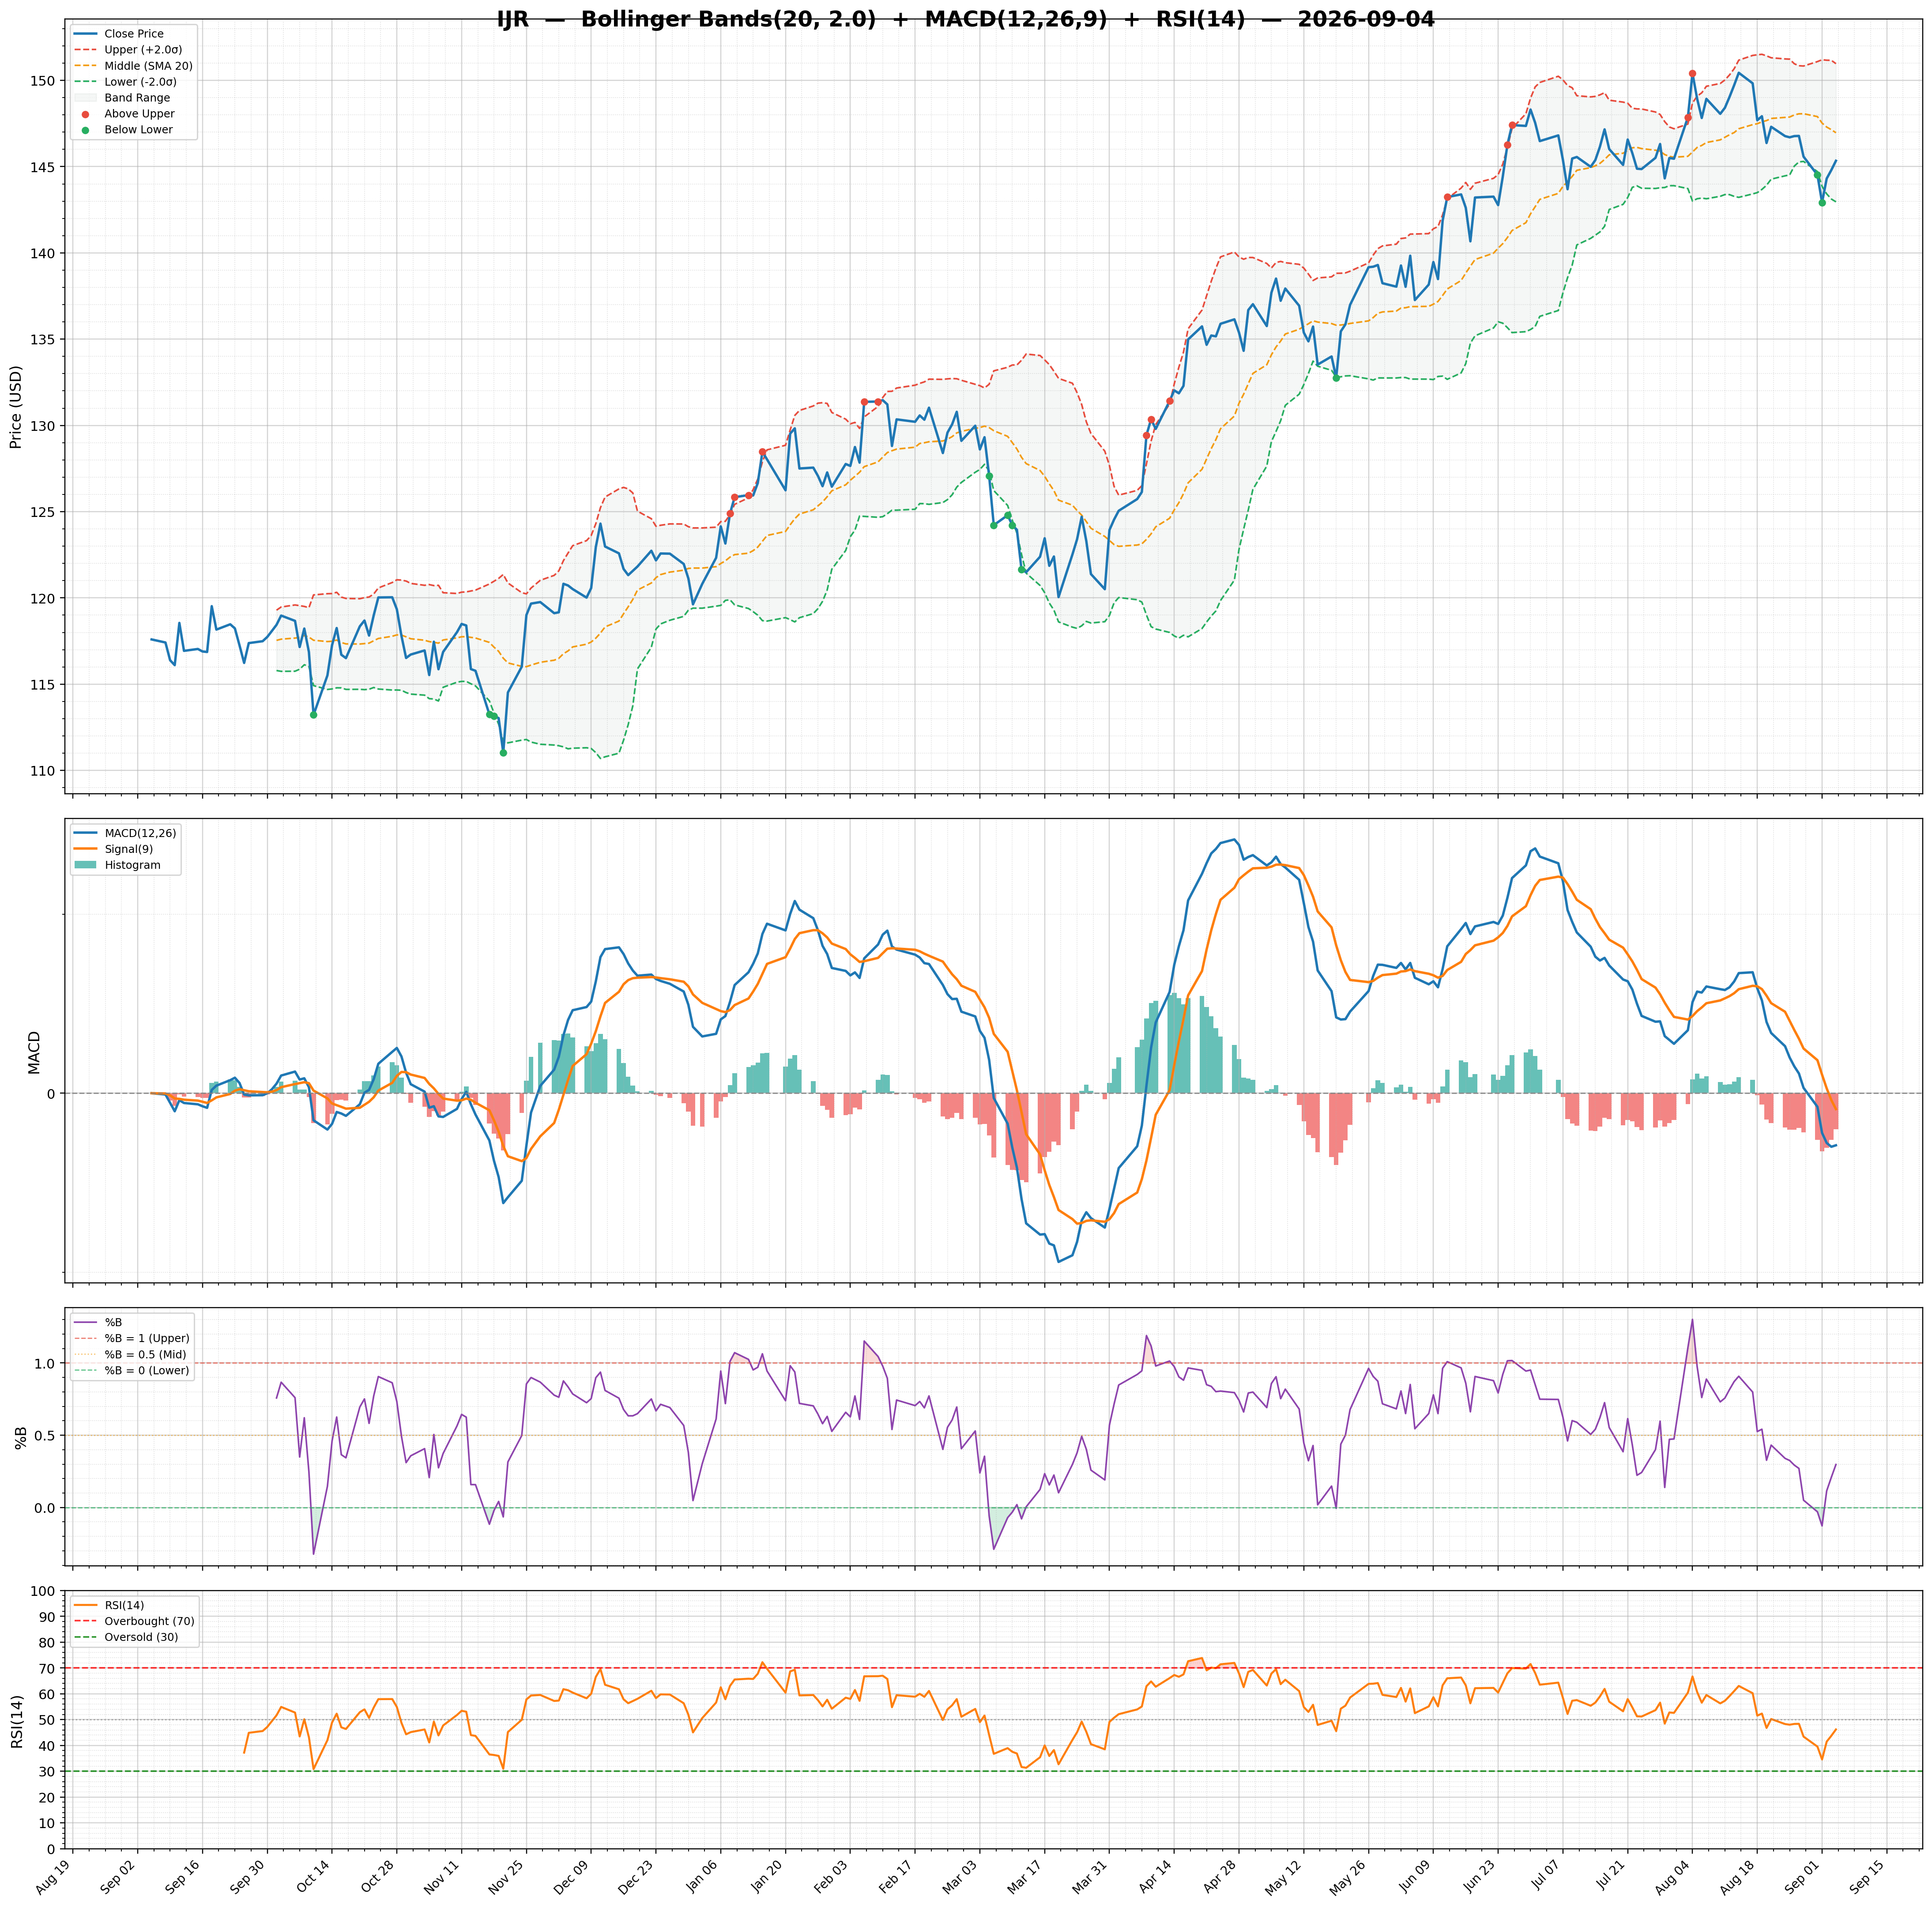
| RSI | 51.18 | Volume | 3.68M | Rating | |
| Previous RSI | 47.27 | Avg Volume 20D | 3.48M | Target Mean | N/A |
| RSI Trend | Up | Relative Volume | 1.06 | Target High | N/A |
| MACD | -0.88 | Lower Band | 135.33 | Target Low | N/A |
| MACD Signal | -1.24 | Middle Band | 137.37 | Target Median | N/A |
| Histogram | 0.36 | Upper Band | 139.41 | Analysts | N/A |
| Previous Histogram | 0.26 | Bandwidth | 2.960 | Upside | N/A |
| Histogram Trend | Increasing | %B | 0.81 | ||