Invitation Homes Inc. (INVH)
Real Estate • REIT - Residential • $27.53 • MCap: 15,988,170,752
https://www.invitationhomes.com • Invitation Homes Inc., an S&P 500 company, is the nation's premier single-family home leasing and management company, helping to expand housing through new development and strategic partnerships. Their purpose, Unlock the Power of Home, reflects their commitment to address America's housing needs by delivering high-quality living solutions and genuine care to those who choose the flexibility and value of leasing. Invitation Homes Inc. was incorporated in 6th June 2012 and is based in Dallas, United States.
RND_10_7_2026
Notes
10/07/2026
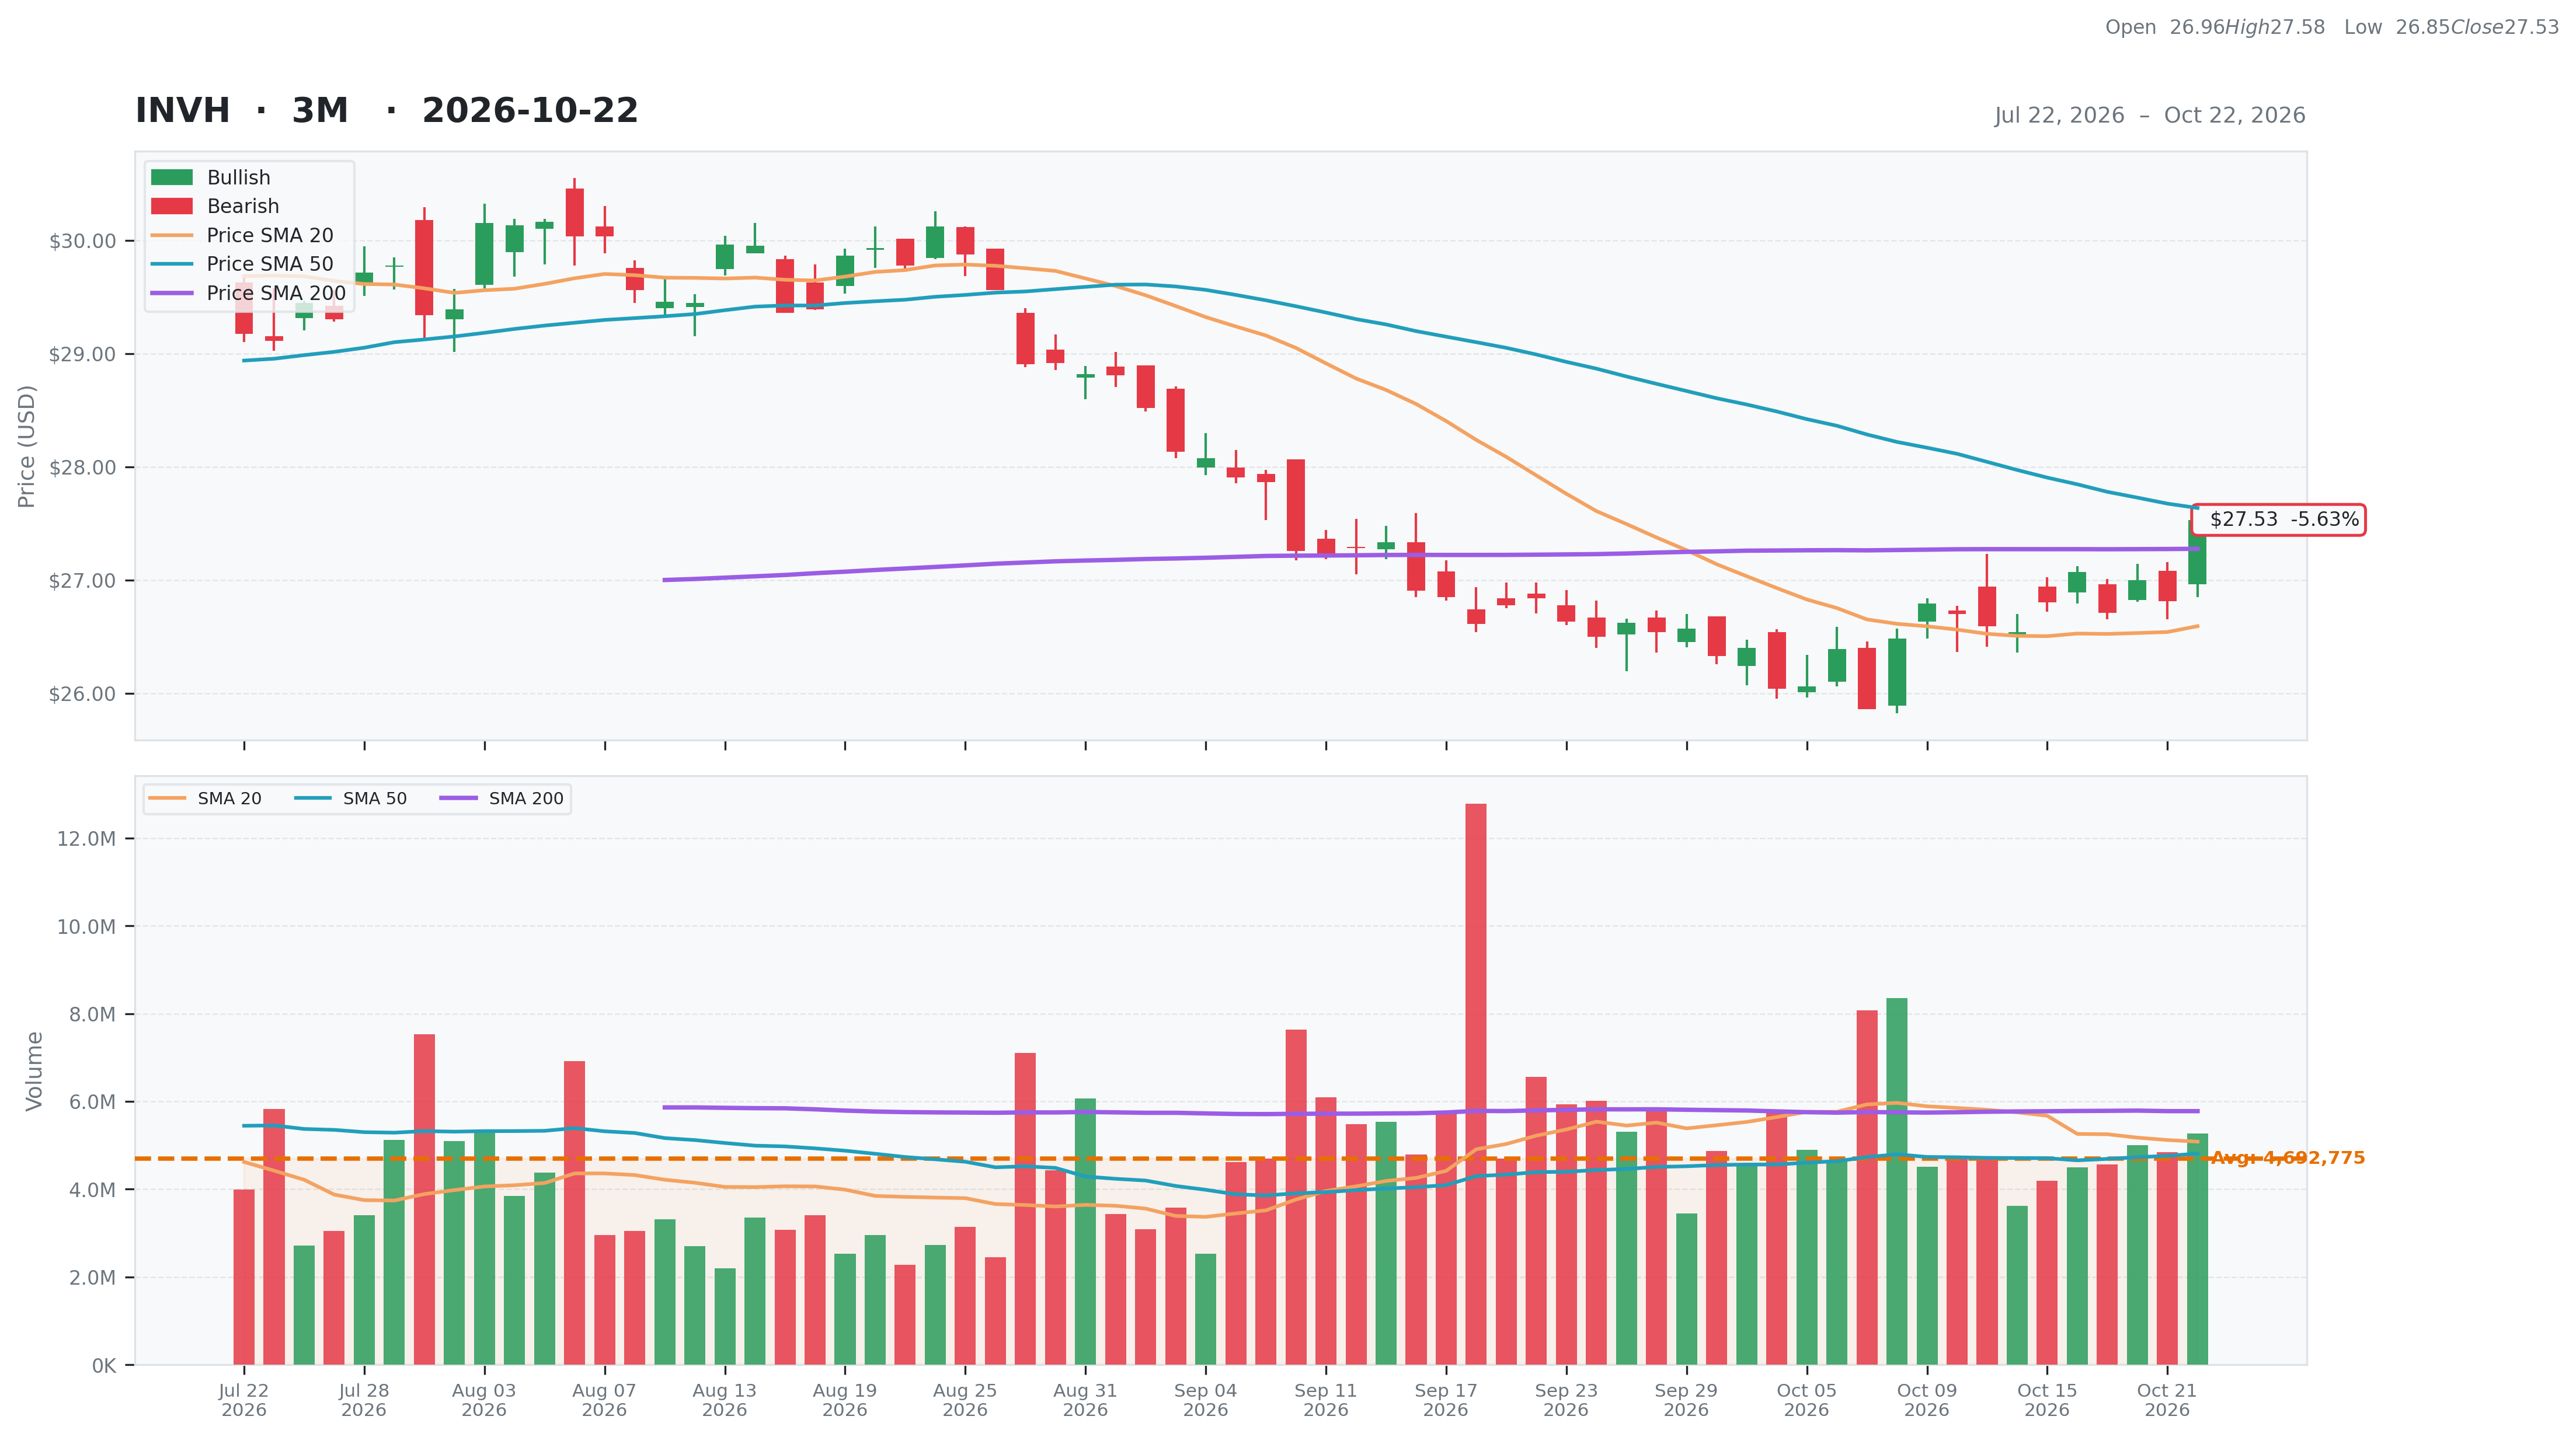
Volume is becoming better
10/07/2026
Good says BUY
| Score | Price | 52 Week & Averages | Relative Strength | Risk | |||||
|---|---|---|---|---|---|---|---|---|---|
| Total | 57 | Current | $27.53 | 52W High | $30.25 -8.99% | Relative Strength | -0.01 | Beta | 0.83 |
| Business Quality | 25 | Weekly | $26.80 2.72% | 52W Low | $23.59 16.72% | 3M | -0.07 | Short % | 0.04 |
| Financial Strength | 9 | Monthly | $26.84 2.58% | Above 50DMA | $27.64 -0.38% | 6M | 0.03 | Risk Score | 7 |
| Growth Outlook | 11 | Quarterly | $29.45 -6.51% | Above 200DMA | $27.27 0.94% | 9M | 0.05 | ||
| Momentum | 4 | Yearly | $27.62 -0.33% | 12M | 0.00 | ||||
| Valuation | Financial Strength | Growth/Profitability | |||
|---|---|---|---|---|---|
| Trailing P/E | 24.83 | Cash | 113M | Revenue Growth | 0.10% |
| Forward P/E | 38.08 | Debt | 8,586M | Earnings Growth | 0.60% |
| PEG Ratio | 13.14 | Debt/Equity | 94.42 | Qtr Earnings Growth | 0.55% |
| Price/Sales | 5.61 | Current Ratio | 0.43 | Gross Margin | 0.56% |
| Price/Book | 1.77 | Quick Ratio | 0.14 | Operating Margin | 0.25% |
| EV/Revenue | 8.60 | Operating CF | 1,200M | Profit Margin | 0.23% |
| EV/EBITDA | 16.33 | Free CF | 1,169M | EBITDA Margin | 0.53% |
| Ent Value | 24,499M | Return on Assets | 0.02% | ||
| Return on Equity | 0.07% | ||||
| Technical | Volume & Bollinger Bands | Analyst | |||
|---|---|---|---|---|---|
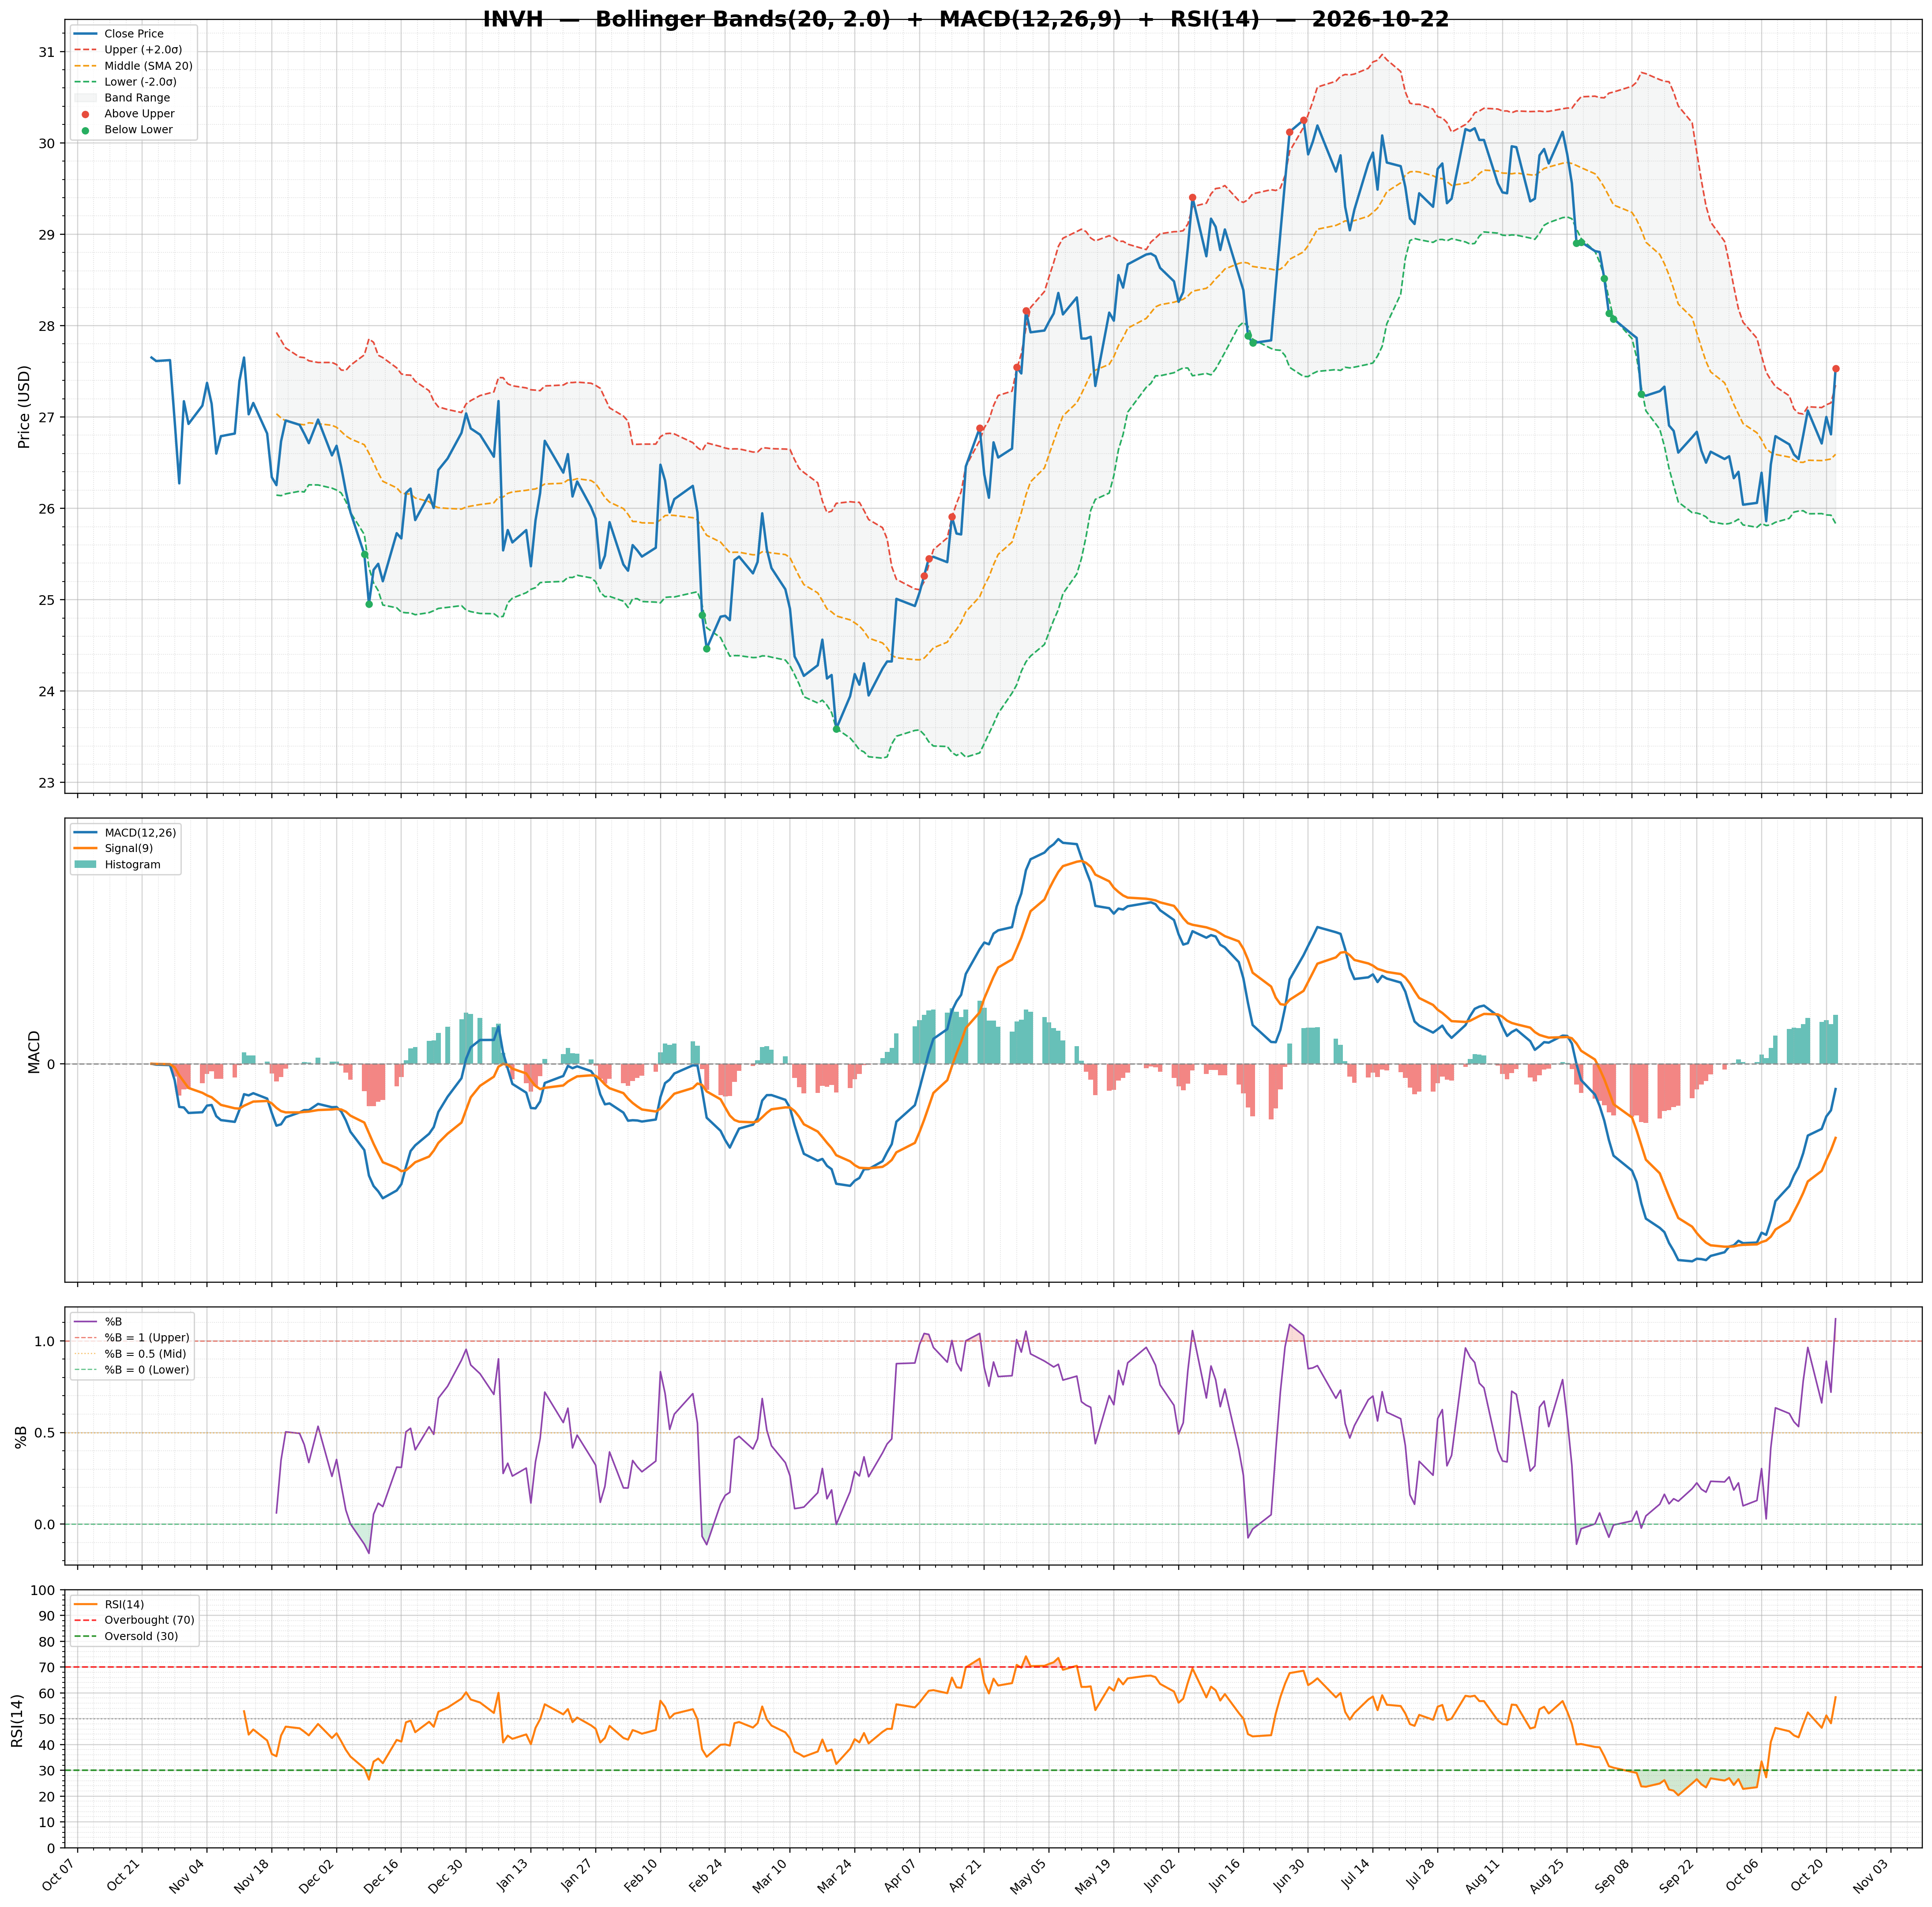
| RSI | 58.34 | Volume | 4.5M | Rating | buy |
| Previous RSI | 48.23 | Avg Volume 20D | 5.08M | Target Mean | $33.13 |
| RSI Trend | Up | Relative Volume | 0.96 | Target High | $41.00 |
| MACD | -0.09 | Lower Band | 25.84 | Target Low | $28.00 |
| MACD Signal | -0.27 | Middle Band | 26.59 | Target Median | $33.00 |
| Histogram | 0.18 | Upper Band | 27.35 | Analysts | 23 |
| Previous Histogram | 0.14 | Bandwidth | 5.690 | Upside | 22.39% |
| Histogram Trend | Increasing | %B | 1.12 | ||