iRhythm Holdings, Inc. (IRTC)
Healthcare • Medical Devices • $119.64 • MCap: 3,581,760,256
https://www.irhythmtech.com • iRhythm Holdings, Inc., a digital healthcare company, engages in the design, development, and commercialization of device-based technology that provides ambulatory cardiac monitoring services to diagnose arrhythmias in the United States. The company offers Zio ambulatory cardiac monitoring services, including long-term and short-term continuous monitoring and mobile cardiac telemetry monitoring services. It also provides Zio Monitor System, a prescription-only remote electrocardiogram (ECG) monitoring system consisting a patch ECG monitor that records the electric signal from the heart continuously for up to 14 days; Zio XT System, a prescription-only remote ECG monitoring system that consists of the Zio XT patch that records the electric signal from the heart continuously for up to 14 days; and Zio ECG Utilization Software System, which supports the capture and analysis of ECG data. In addition, the company offers Zio AT System, a prescription-only remote ECG monitoring system, which consists of the Zio AT patch that records the electric signal from the heart continuously for up to 14 days, as well as incorporates the Zio AT wireless gateway to provide connectivity between the patch and the ZEUS System during the patient wear period. It has a development collaboration agreement with BioIS to develop and commercialize pulse oximetry, accelerometry, and trending non-invasive blood pressure technologies for use within ambulatory cardiac monitoring products and services. The company was formerly known as iRhythm Technologies, Inc. and changed its name to iRhythm Holdings, Inc. in January 2026. iRhythm Holdings, Inc. was incorporated in 2006 and is headquartered in San Francisco, California.
Google_BUY_Rating
| Score | Price | 52 Week & Averages | Relative Strength | Risk | |||||
|---|---|---|---|---|---|---|---|---|---|
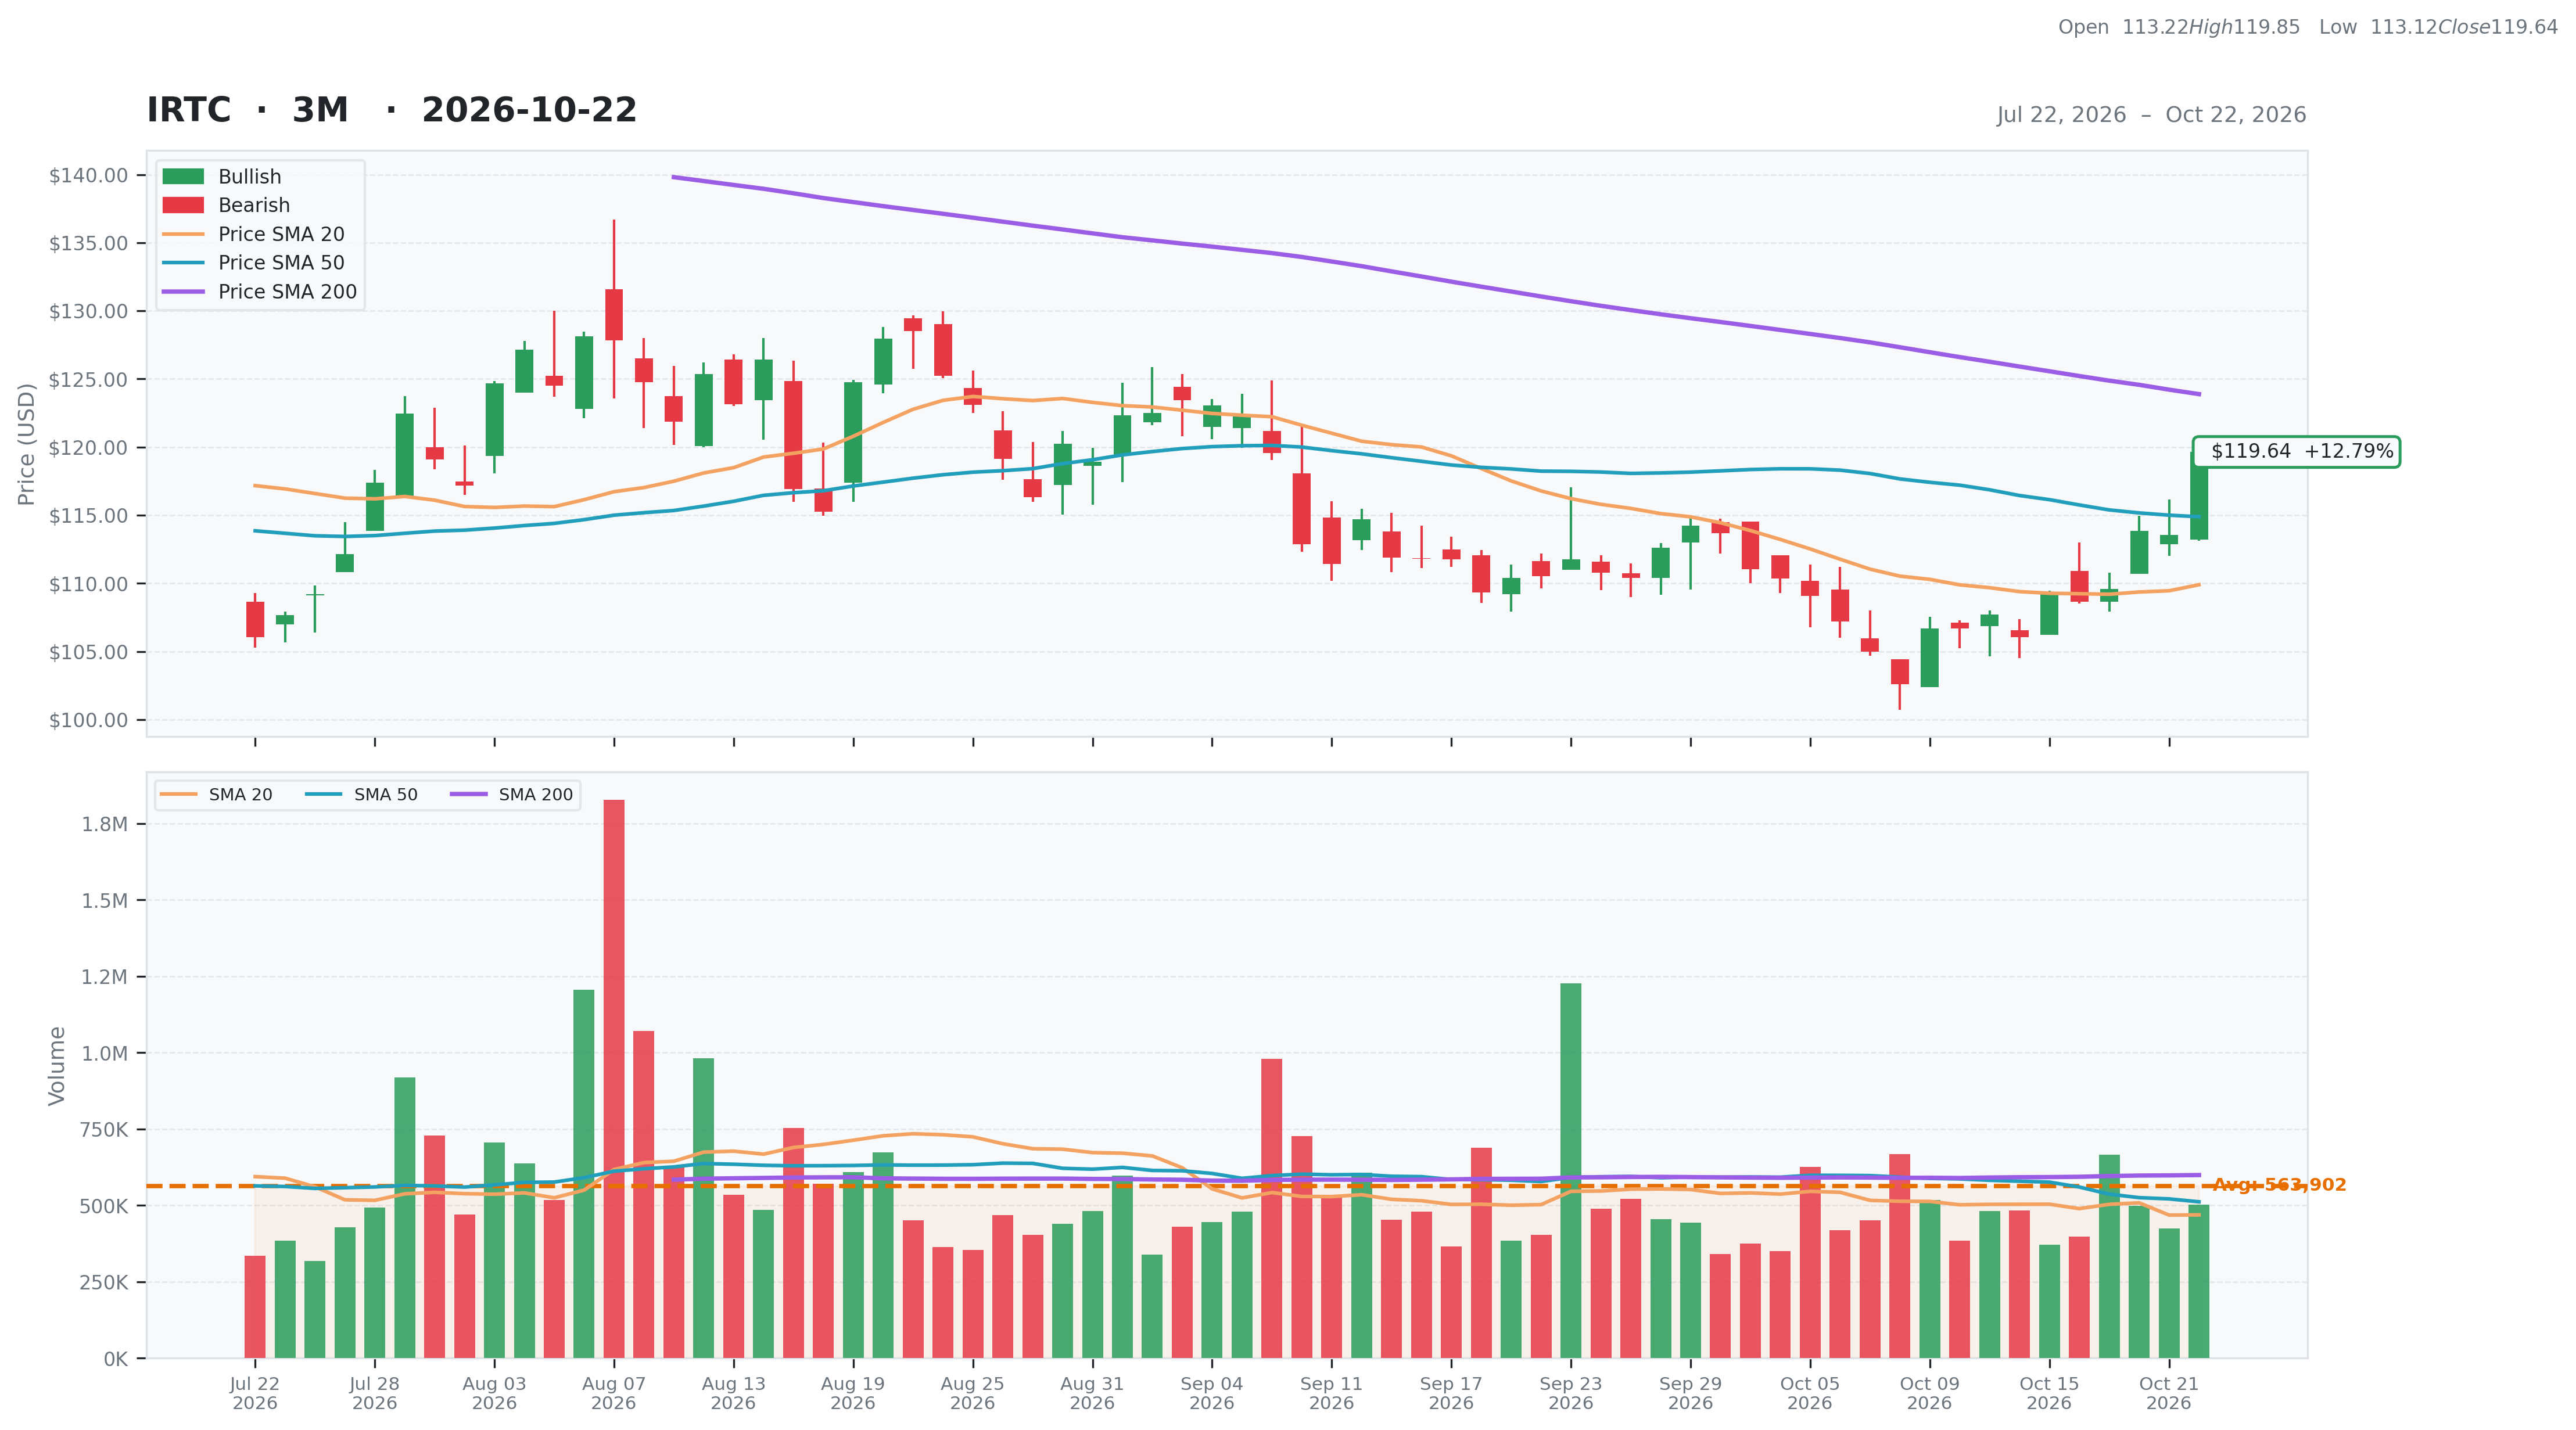
| Total | 40 | Current | $119.64 | 52W High | $189.25 -36.78% | Relative Strength | -0.09 | Beta | 1.46 |
| Business Quality | 12 | Weekly | $109.35 9.41% | 52W Low | $101.79 17.54% | 3M | 0.10 | Short % | 0.09 |
| Financial Strength | 13 | Monthly | $110.53 8.24% | Above 50DMA | $114.89 4.14% | 6M | -0.01 | Risk Score | 5 |
| Growth Outlook | 1 | Quarterly | $109.20 9.56% | Above 200DMA | $123.89 -3.43% | 9M | -0.27 | ||
| Momentum | 3 | Yearly | $182.71 -34.52% | 12M | -0.34 | ||||
| Valuation | Financial Strength | Growth/Profitability | |||
|---|---|---|---|---|---|
| Trailing P/E | N/A | Cash | 591M | Revenue Growth | 0.20% |
| Forward P/E | 87.23 | Debt | 727M | Earnings Growth | N/A |
| PEG Ratio | N/A | Debt/Equity | 391.08 | Qtr Earnings Growth | N/A |
| Price/Sales | 4.34 | Current Ratio | 3.86 | Gross Margin | 0.71% |
| Price/Book | 19.25 | Quick Ratio | 3.65 | Operating Margin | 0.08% |
| EV/Revenue | 4.50 | Operating CF | 86M | Profit Margin | -0.02% |
| EV/EBITDA | 210.11 | Free CF | 82M | EBITDA Margin | 0.02% |
| Ent Value | 3,718M | Return on Assets | 0.01% | ||
| Return on Equity | -0.10% | ||||
| Technical | Volume & Bollinger Bands | Analyst | |||
|---|---|---|---|---|---|
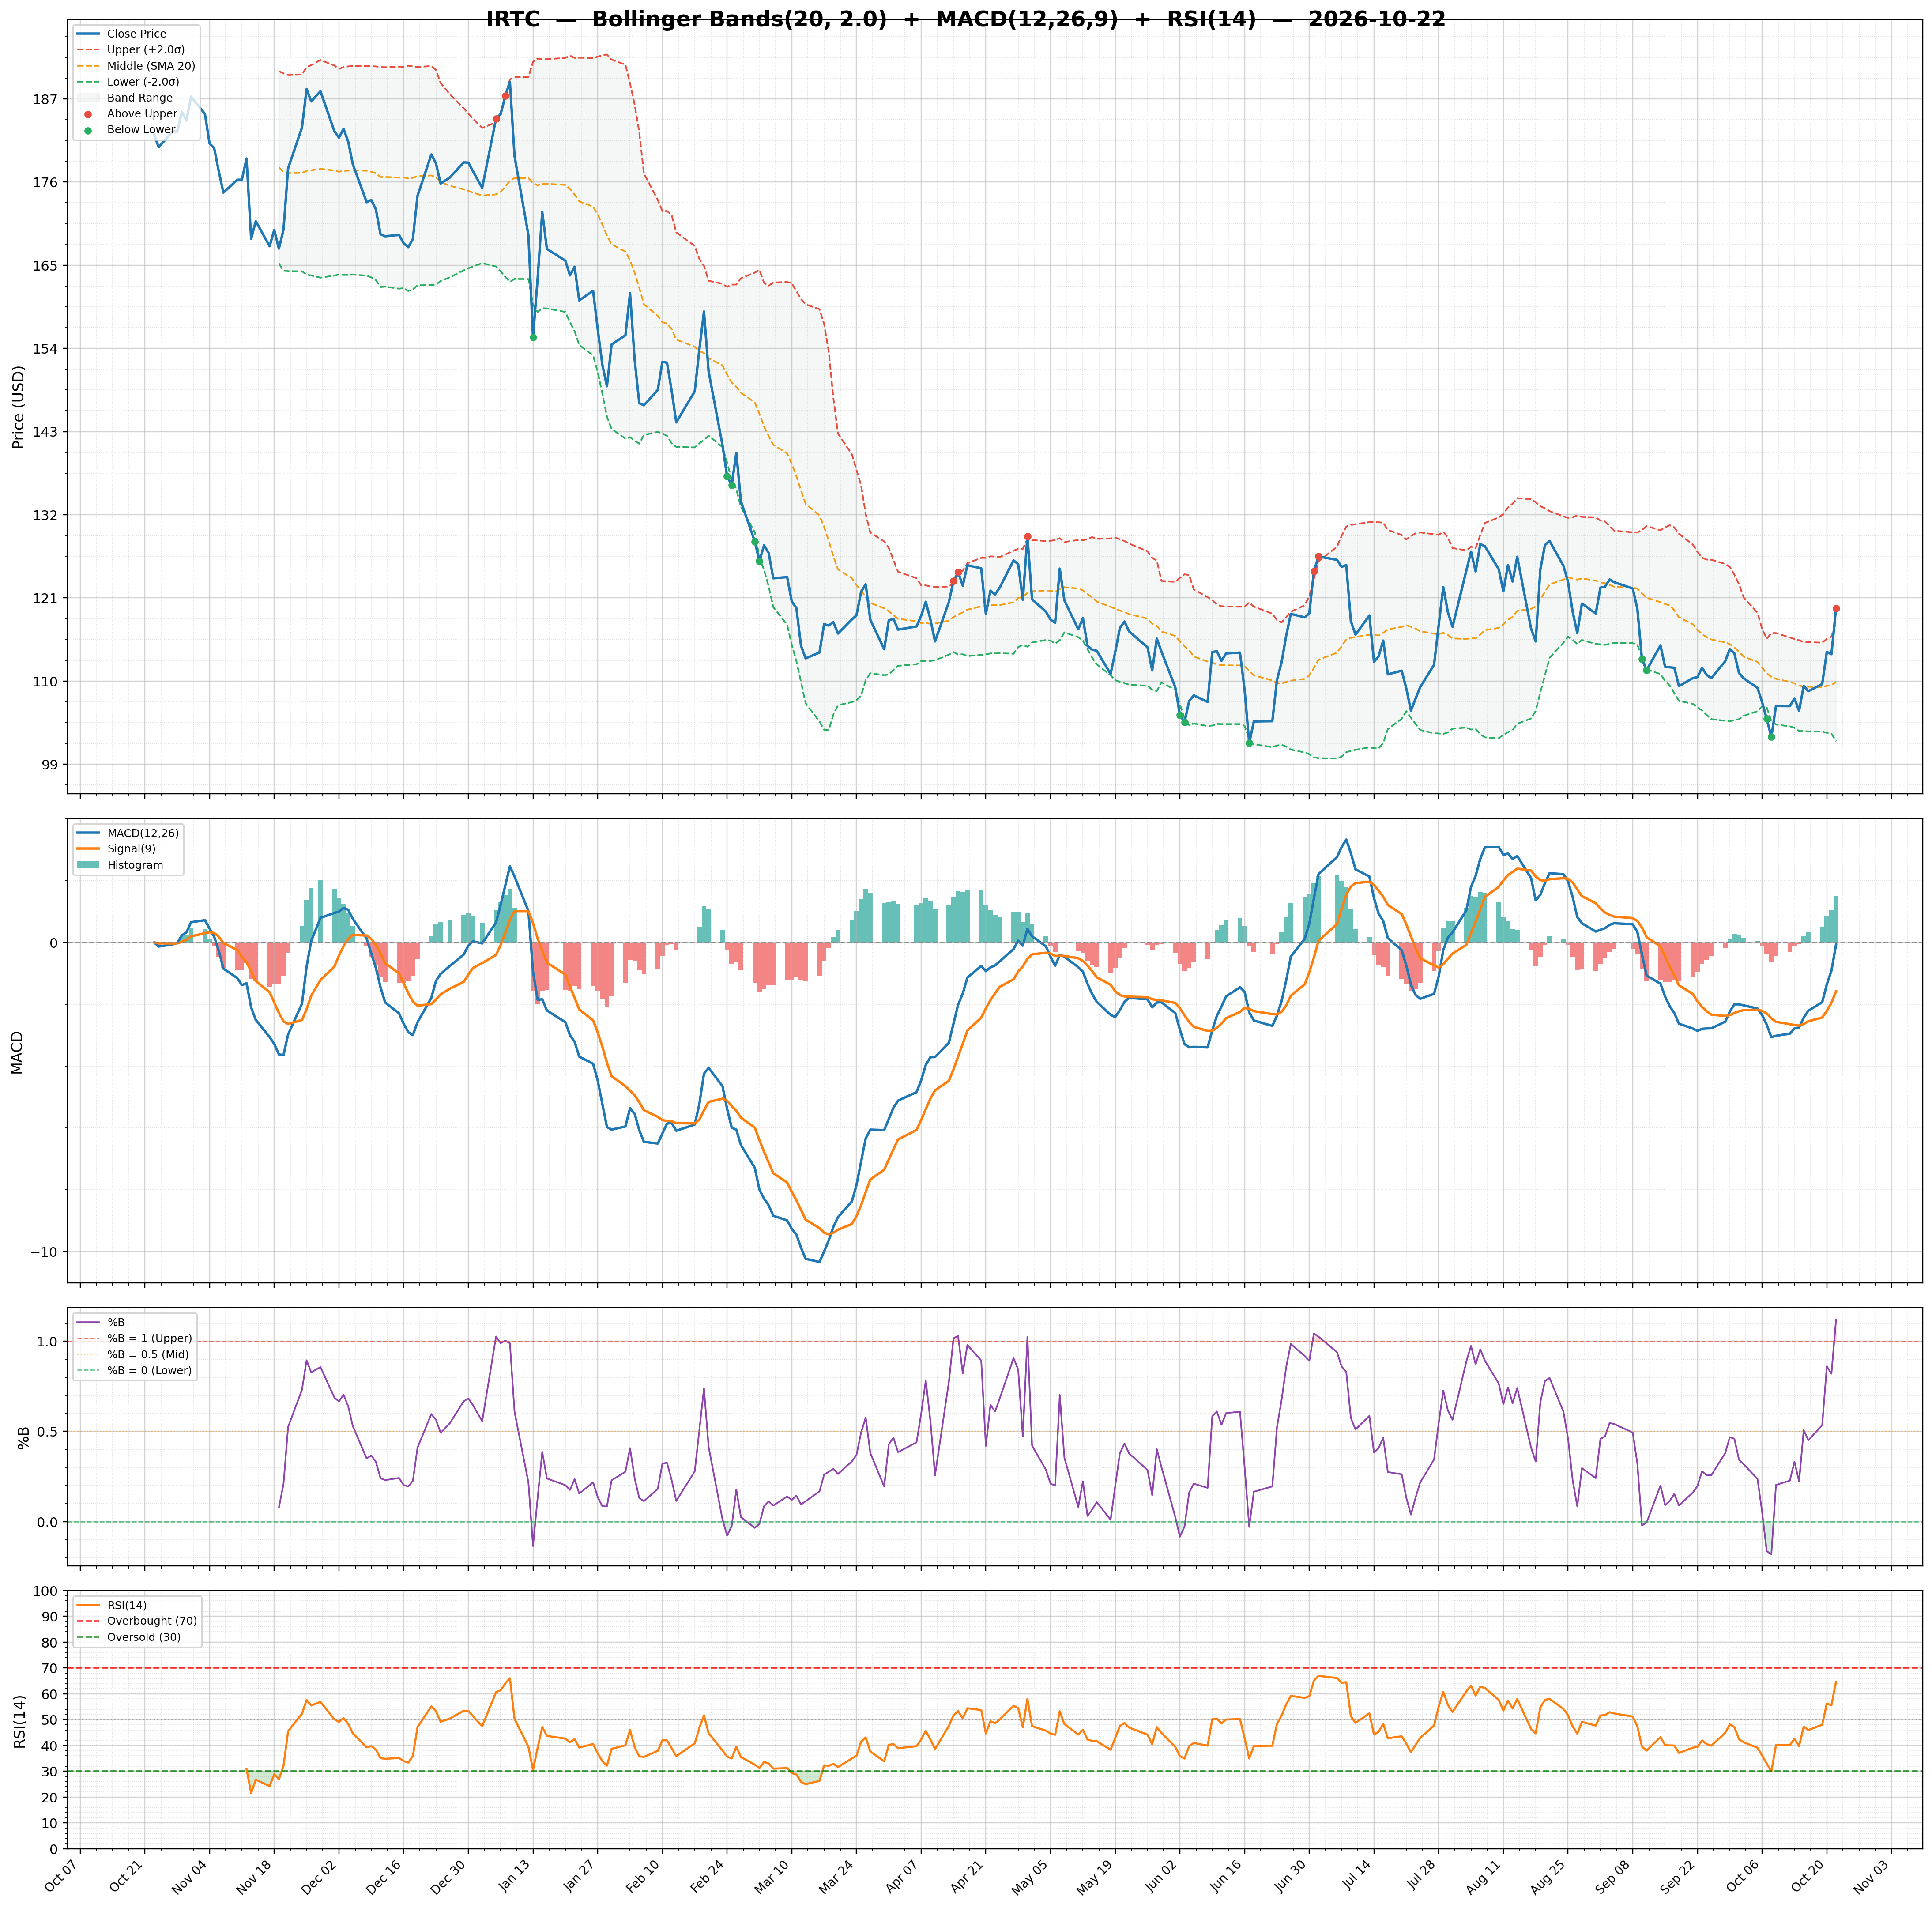
| RSI | 64.70 | Volume | 0.4M | Rating | strong_buy |
| Previous RSI | 55.56 | Avg Volume 20D | 0.47M | Target Mean | $171.33 |
| RSI Trend | Up | Relative Volume | 1.00 | Target High | $196.00 |
| MACD | -0.07 | Lower Band | 102.04 | Target Low | $140.00 |
| MACD Signal | -1.58 | Middle Band | 109.90 | Target Median | $175.00 |
| Histogram | 1.51 | Upper Band | 117.75 | Analysts | 15 |
| Previous Histogram | 1.04 | Bandwidth | 14.300 | Upside | 57.68% |
| Histogram Trend | Increasing | %B | 1.12 | ||