iShares U.S. Home Construction (ITB)
• • $91.24 • MCap:
• The index measures the performance of the home construction sector of the U.S. equity market, as defined by the index provider. The fund generally will invest at least 80% of its assets in the component securities of its underlying index and may invest up to 20% of its assets in certain futures, options and swap contracts, cash and cash equivalents. It is non-diversified.
Sector
Joie
| Score | Price | 52 Week & Averages | Relative Strength | Risk | |||||
|---|---|---|---|---|---|---|---|---|---|
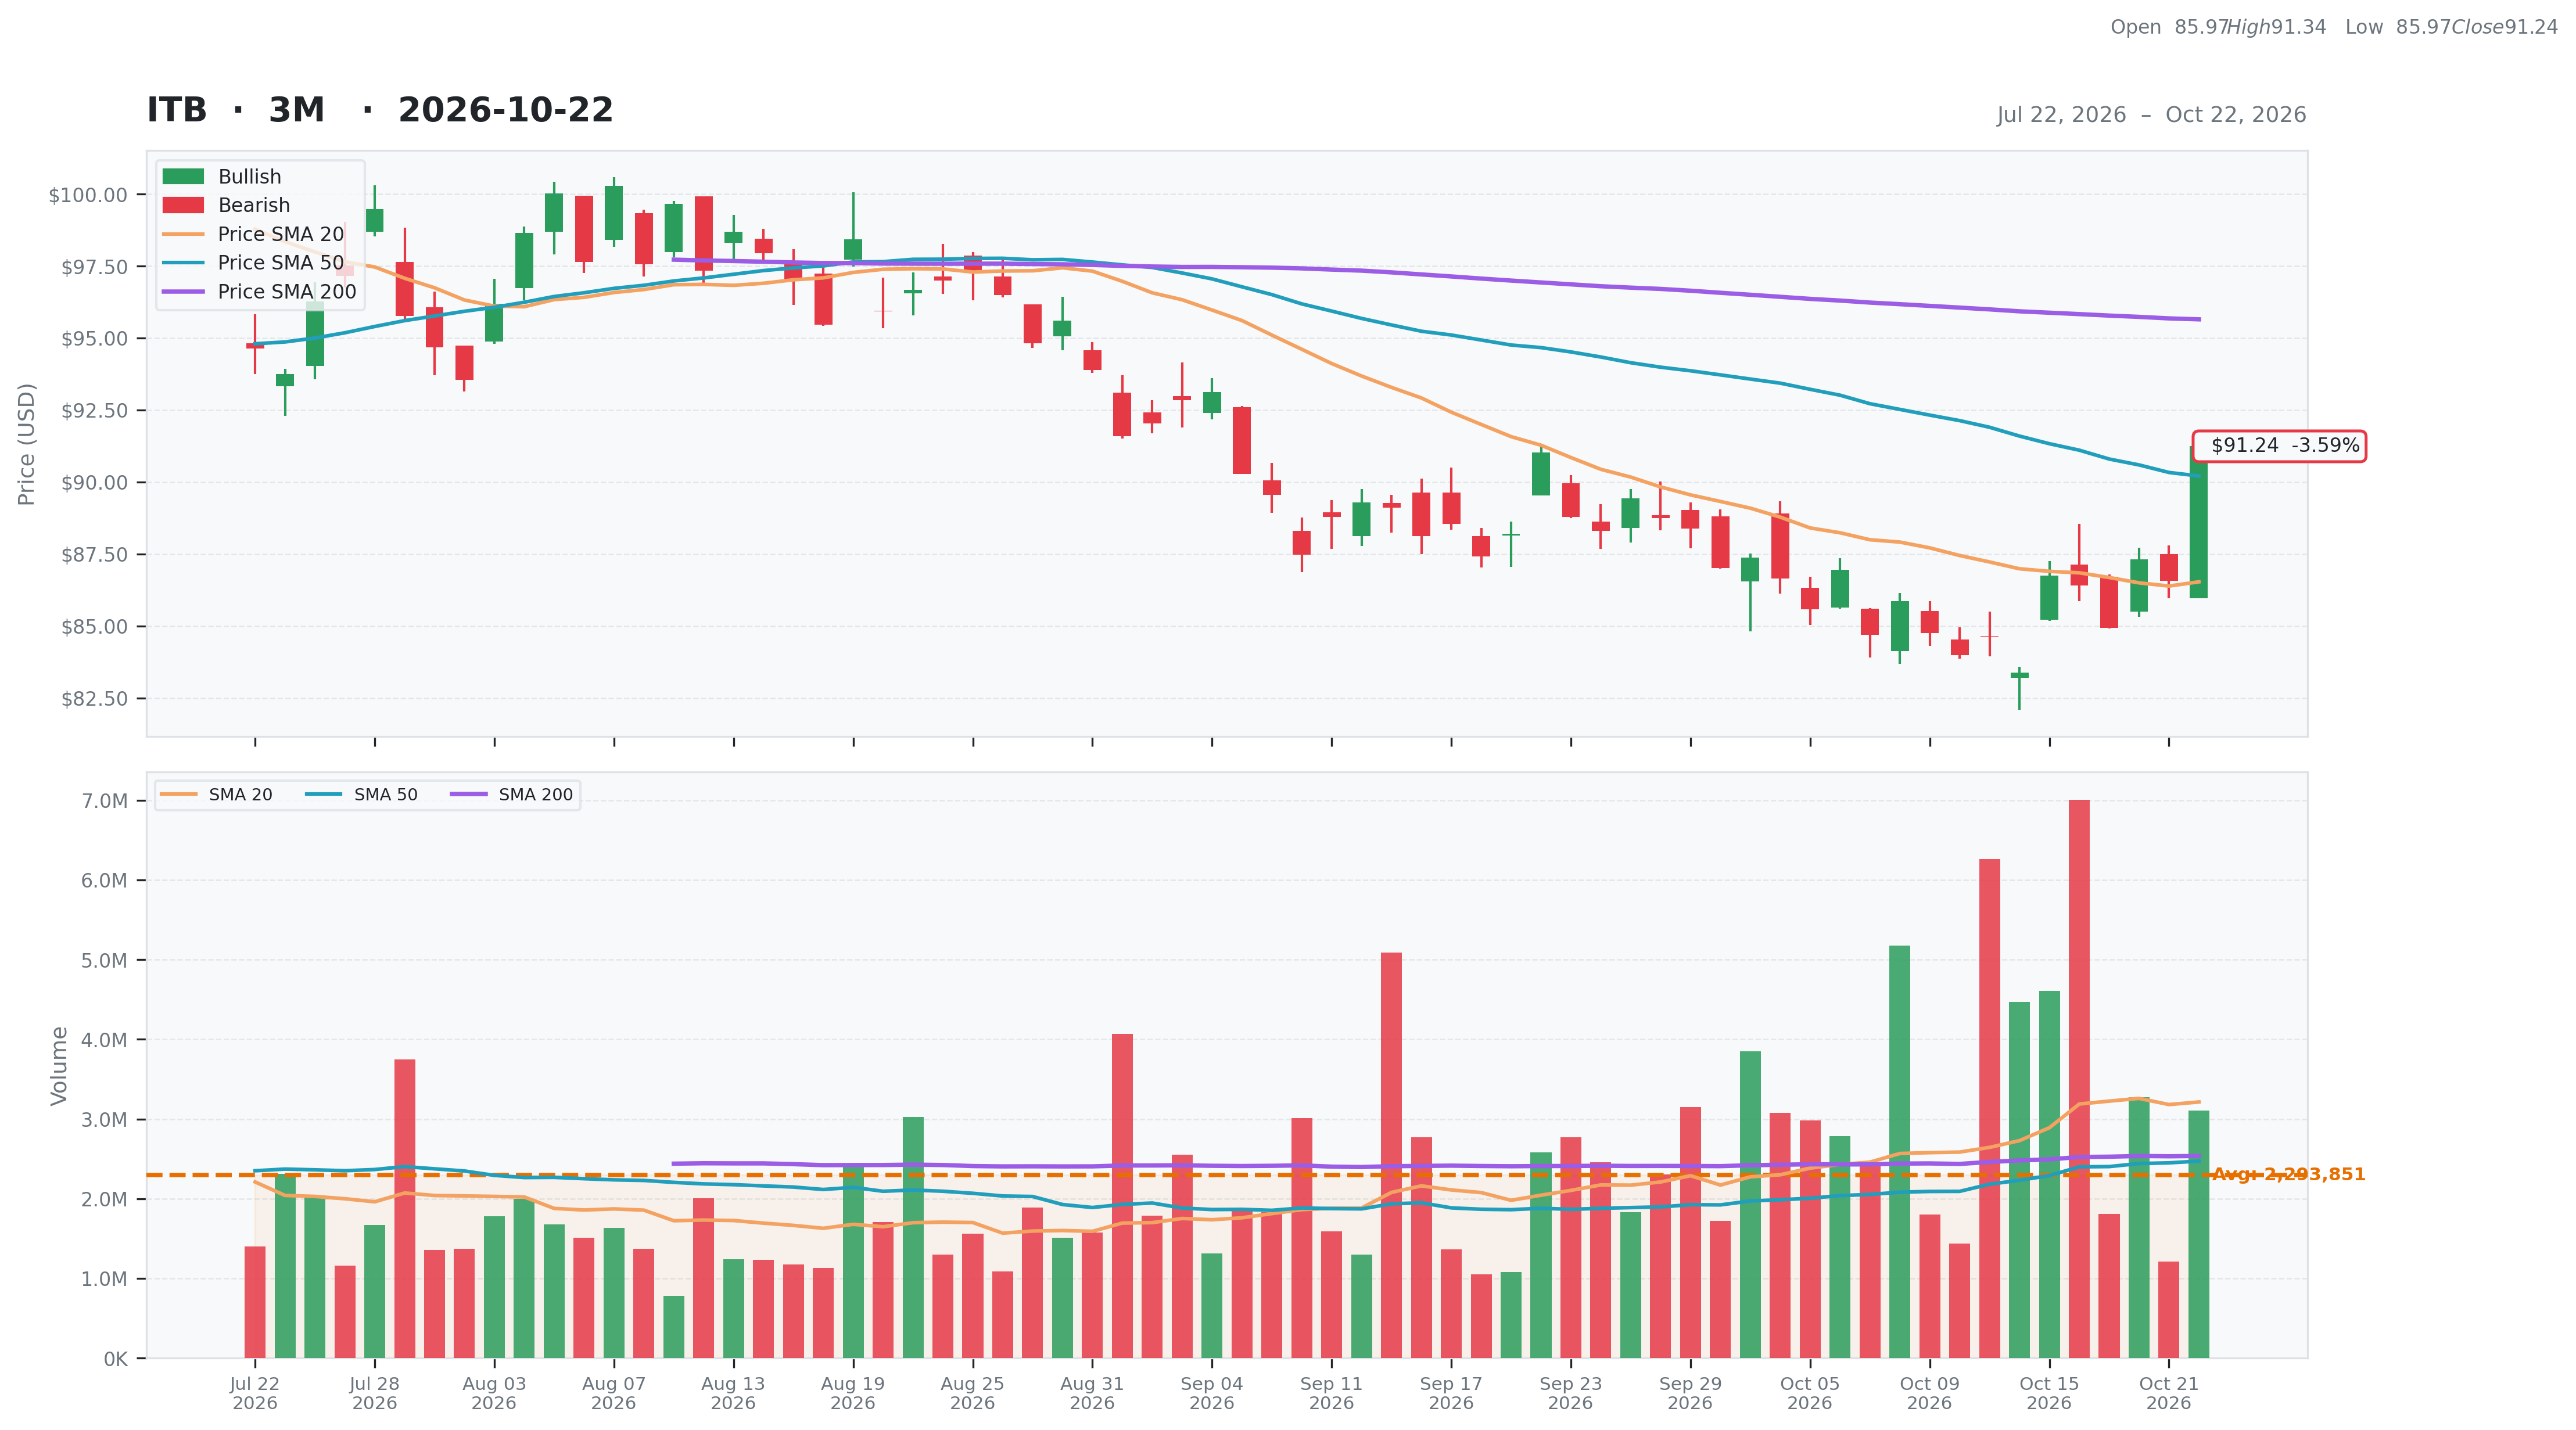
| Total | 26 | Current | $91.24 | 52W High | $112.22 -18.70% | Relative Strength | -0.09 | Beta | N/A |
| Business Quality | 1 | Weekly | $86.75 5.18% | 52W Low | $83.39 9.41% | 3M | -0.05 | Short % | |
| Financial Strength | 6 | Monthly | $91.03 0.23% | Above 50DMA | $90.21 1.14% | 6M | -0.09 | Risk Score | |
| Growth Outlook | 1 | Quarterly | $96.28 -5.23% | Above 200DMA | $95.65 -4.61% | 9M | -0.14 | ||
| Momentum | 0 | Yearly | $102.75 -11.20% | 12M | -0.11 | ||||
| Valuation | Financial Strength | Growth/Profitability | |||
|---|---|---|---|---|---|
| Trailing P/E | 15.16 | Cash | N/A | Revenue Growth | N/A |
| Forward P/E | N/A | Debt | N/A | Earnings Growth | N/A |
| PEG Ratio | N/A | Debt/Equity | N/A | Qtr Earnings Growth | N/A |
| Price/Sales | N/A | Current Ratio | N/A | Gross Margin | N/A |
| Price/Book | N/A | Quick Ratio | N/A | Operating Margin | N/A |
| EV/Revenue | N/A | Operating CF | N/A | Profit Margin | N/A |
| EV/EBITDA | N/A | Free CF | N/A | EBITDA Margin | N/A |
| Ent Value | N/A | Return on Assets | N/A | ||
| Return on Equity | N/A | ||||
| Technical | Volume & Bollinger Bands | Analyst | |||
|---|---|---|---|---|---|
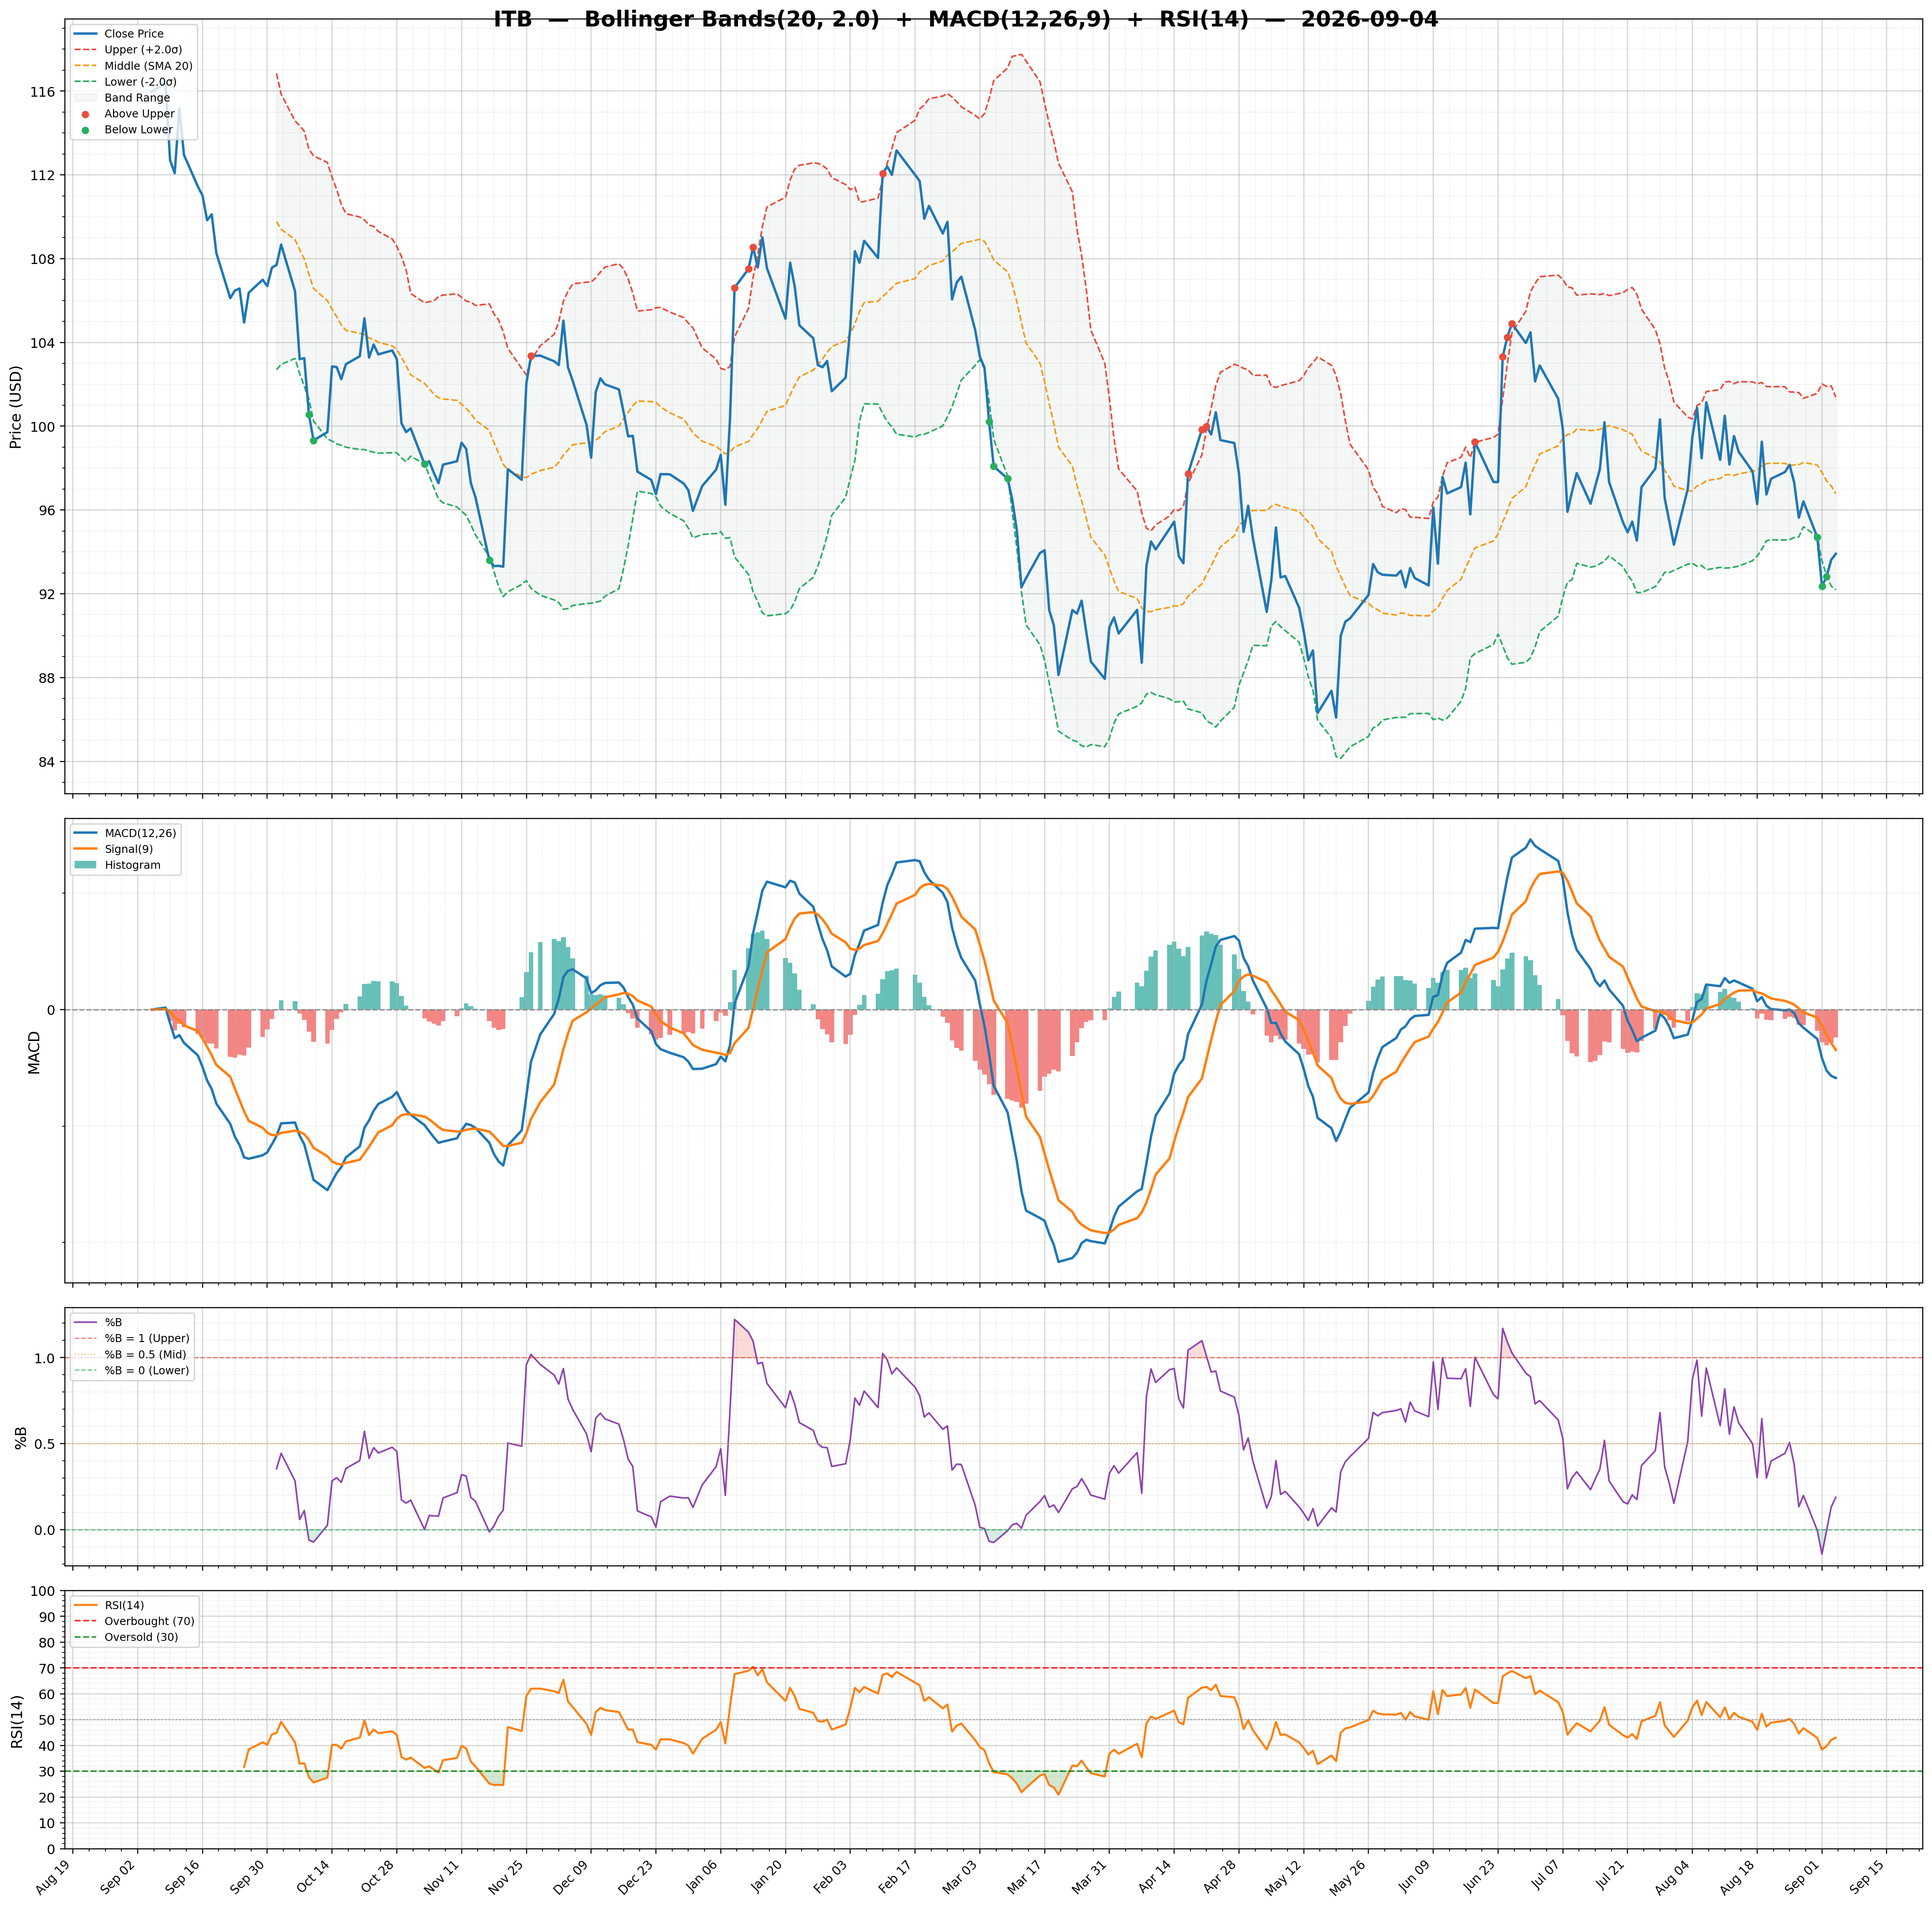
| RSI | 59.14 | Volume | 6.96M | Rating | |
| Previous RSI | 47.70 | Avg Volume 20D | 3.21M | Target Mean | N/A |
| RSI Trend | Up | Relative Volume | 1.08 | Target High | N/A |
| MACD | -0.66 | Lower Band | 82.67 | Target Low | N/A |
| MACD Signal | -1.38 | Middle Band | 86.53 | Target Median | N/A |
| Histogram | 0.72 | Upper Band | 90.40 | Analysts | N/A |
| Previous Histogram | 0.40 | Bandwidth | 8.940 | Upside | N/A |
| Histogram Trend | Increasing | %B | 1.11 | ||