Janus International Group, Inc. (JBI)
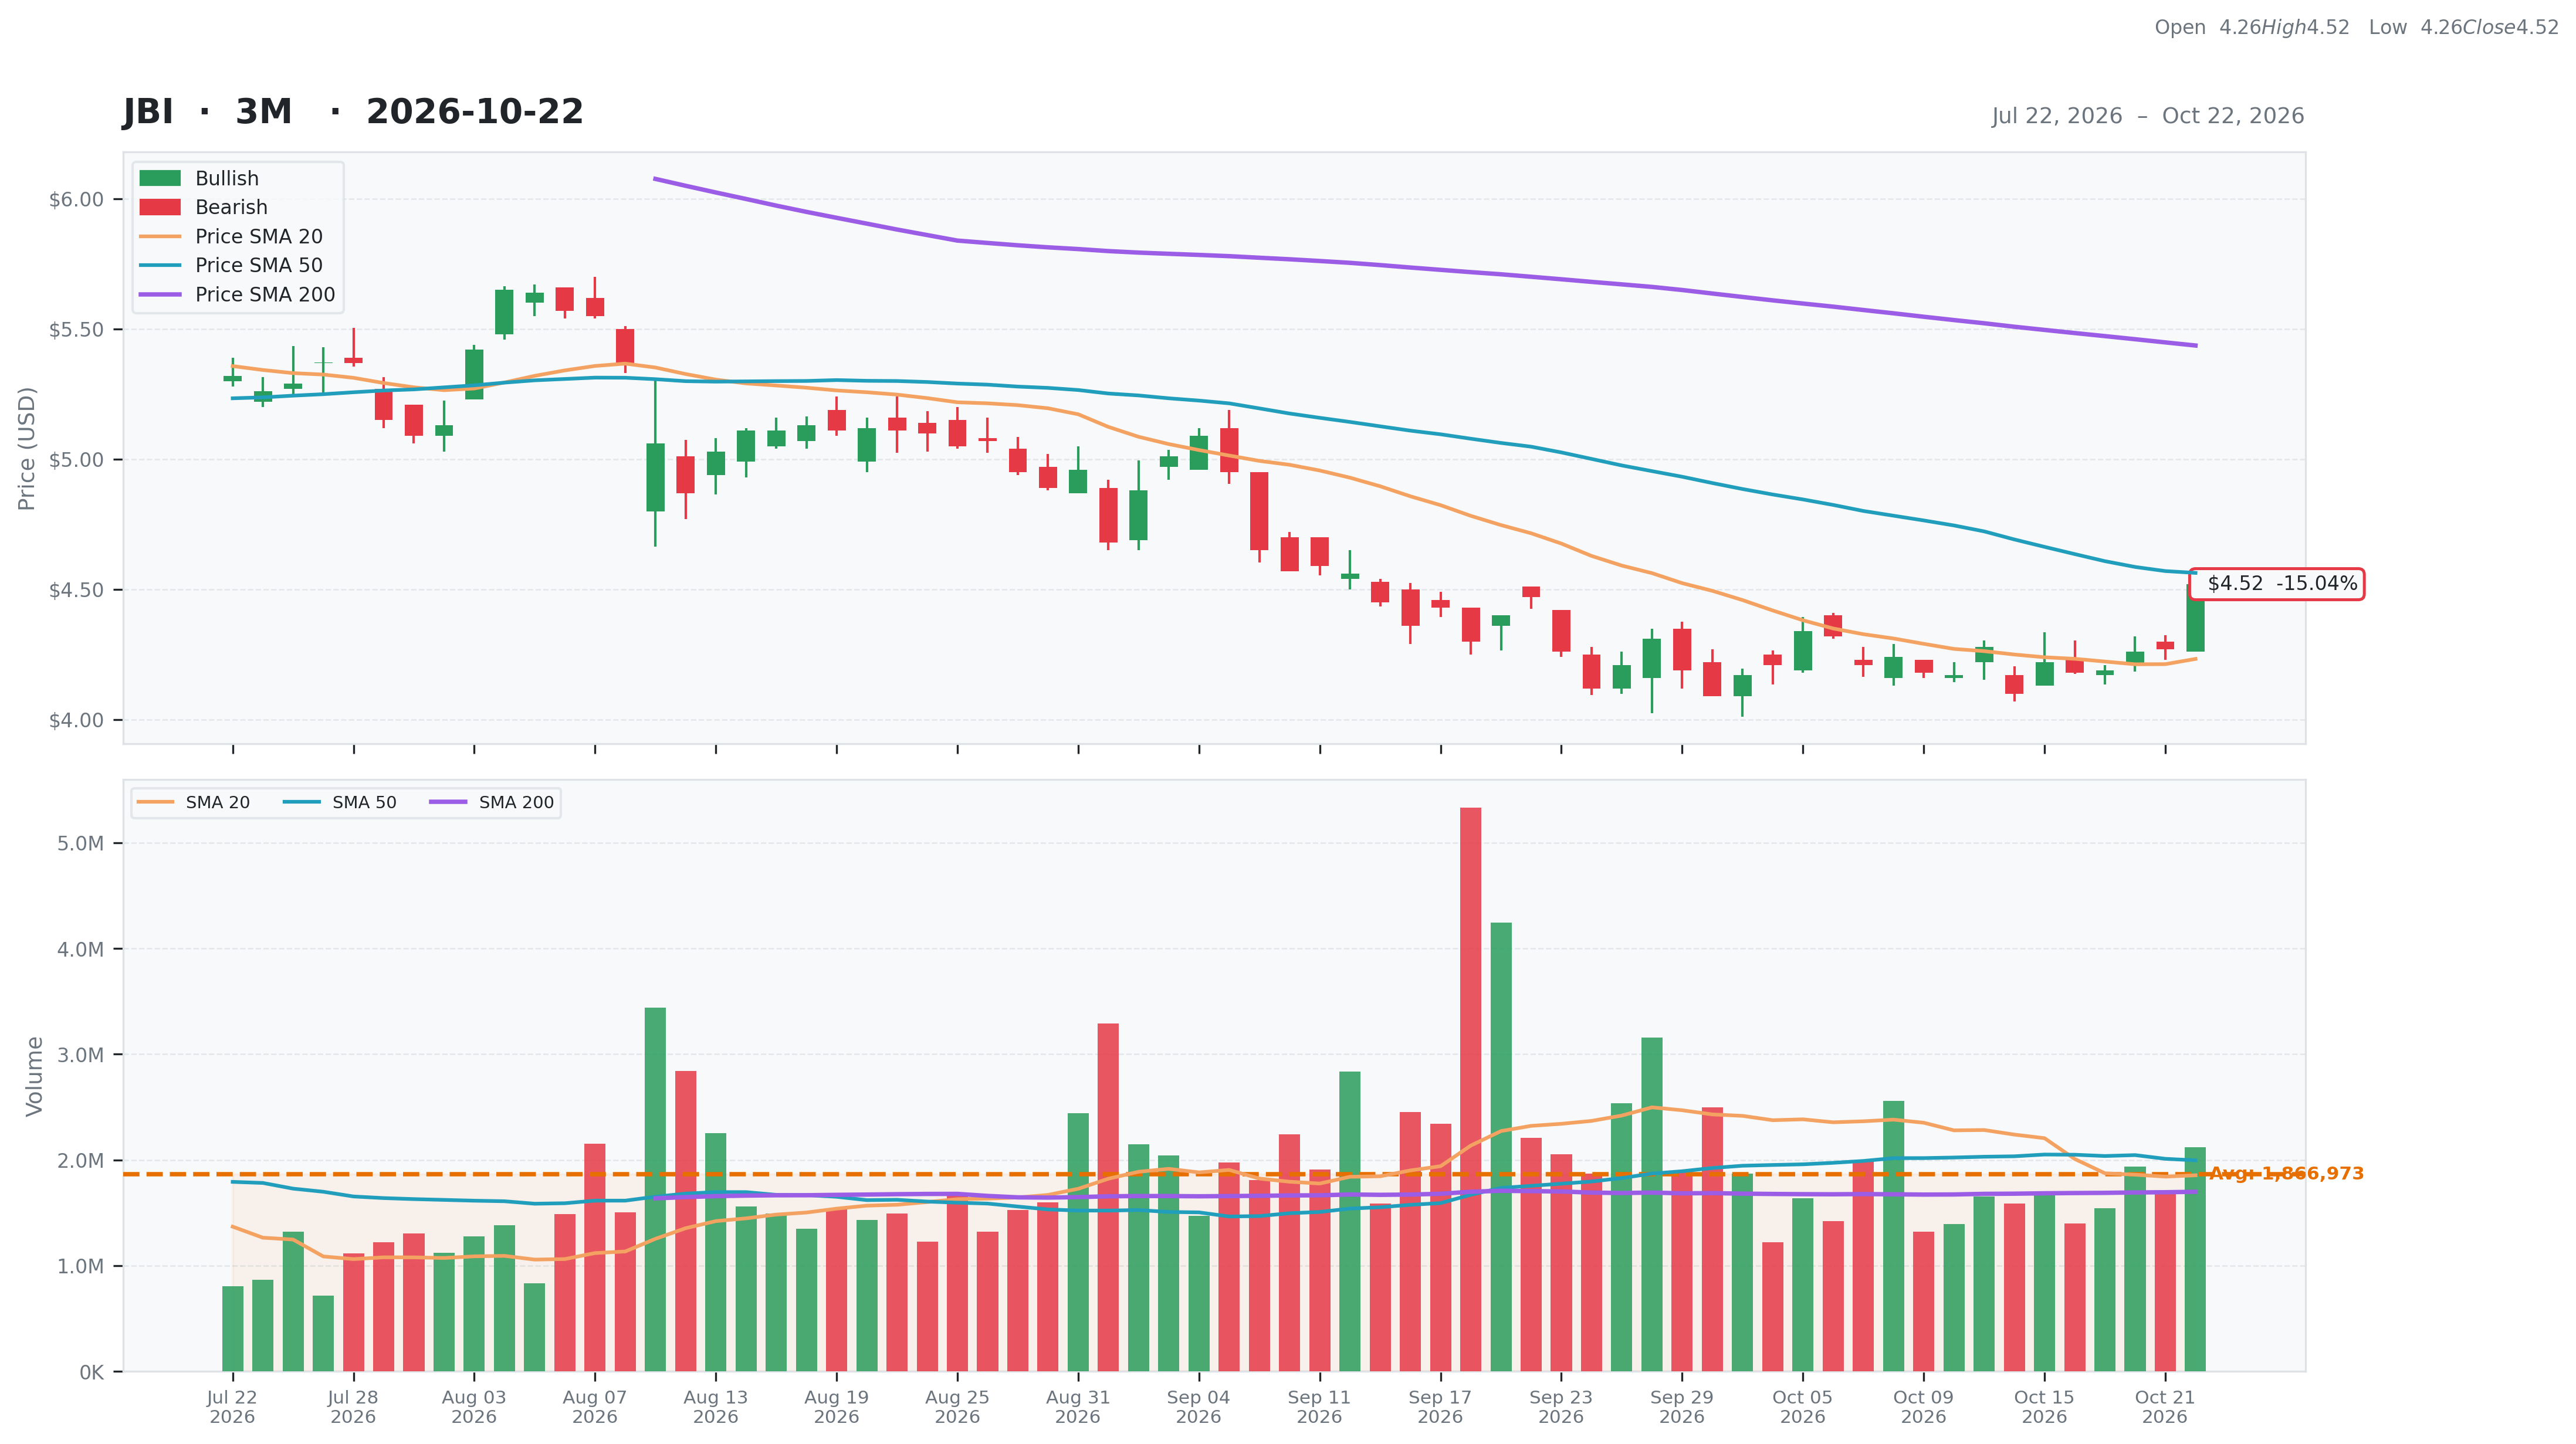
Industrials • Building Products & Equipment • $4.52 • MCap: 570,301,568
https://www.janusintl.com • Janus International Group, Inc. manufactures and supplies turn-key self-storage, commercial, and industrial building solutions in North America and internationally. The company provides roll up and swing doors, hallway systems, relocatable storage units, and facility and door automation technologies. It also offers access control technologies. Janus International Group, Inc. was founded in 2002 and is headquartered in Temple, Georgia.
ET
| Score | Price | 52 Week & Averages | Relative Strength | Risk | |||||
|---|---|---|---|---|---|---|---|---|---|
| Total | 49 | Current | $4.52 | 52W High | $10.20 -55.69% | Relative Strength | -0.27 | Beta | 1.43 |
| Business Quality | 9 | Weekly | $4.22 7.11% | 52W Low | $4.09 10.51% | 3M | -0.15 | Short % | 0.05 |
| Financial Strength | 10 | Monthly | $4.47 1.12% | Above 50DMA | $4.56 -0.95% | 6M | -0.16 | Risk Score | 4 |
| Growth Outlook | 4 | Quarterly | $5.29 -14.56% | Above 200DMA | $5.44 -16.86% | 9M | -0.37 | ||
| Momentum | 3 | Yearly | $10.10 -55.25% | 12M | -0.56 | ||||
| Valuation | Financial Strength | Growth/Profitability | |||
|---|---|---|---|---|---|
| Trailing P/E | 17.42 | Cash | 127M | Revenue Growth | 0.02% |
| Forward P/E | 6.43 | Debt | 622M | Earnings Growth | -0.47% |
| PEG Ratio | N/A | Debt/Equity | 108.81 | Qtr Earnings Growth | -0.48% |
| Price/Sales | 0.63 | Current Ratio | 2.94 | Gross Margin | 0.36% |
| Price/Book | 1.00 | Quick Ratio | 2.20 | Operating Margin | 0.10% |
| EV/Revenue | 1.18 | Operating CF | 100M | Profit Margin | 0.04% |
| EV/EBITDA | 7.30 | Free CF | 41M | EBITDA Margin | 0.16% |
| Ent Value | 1,066M | Return on Assets | 0.04% | ||
| Return on Equity | 0.06% | ||||
| Technical | Volume & Bollinger Bands | Analyst | |||
|---|---|---|---|---|---|
| RSI | 57.41 | Volume | 1.35M | Rating | buy |
| Previous RSI | 47.05 | Avg Volume 20D | 1.86M | Target Mean | $7.42 |
| RSI Trend | Up | Relative Volume | 1.00 | Target High | $9.00 |
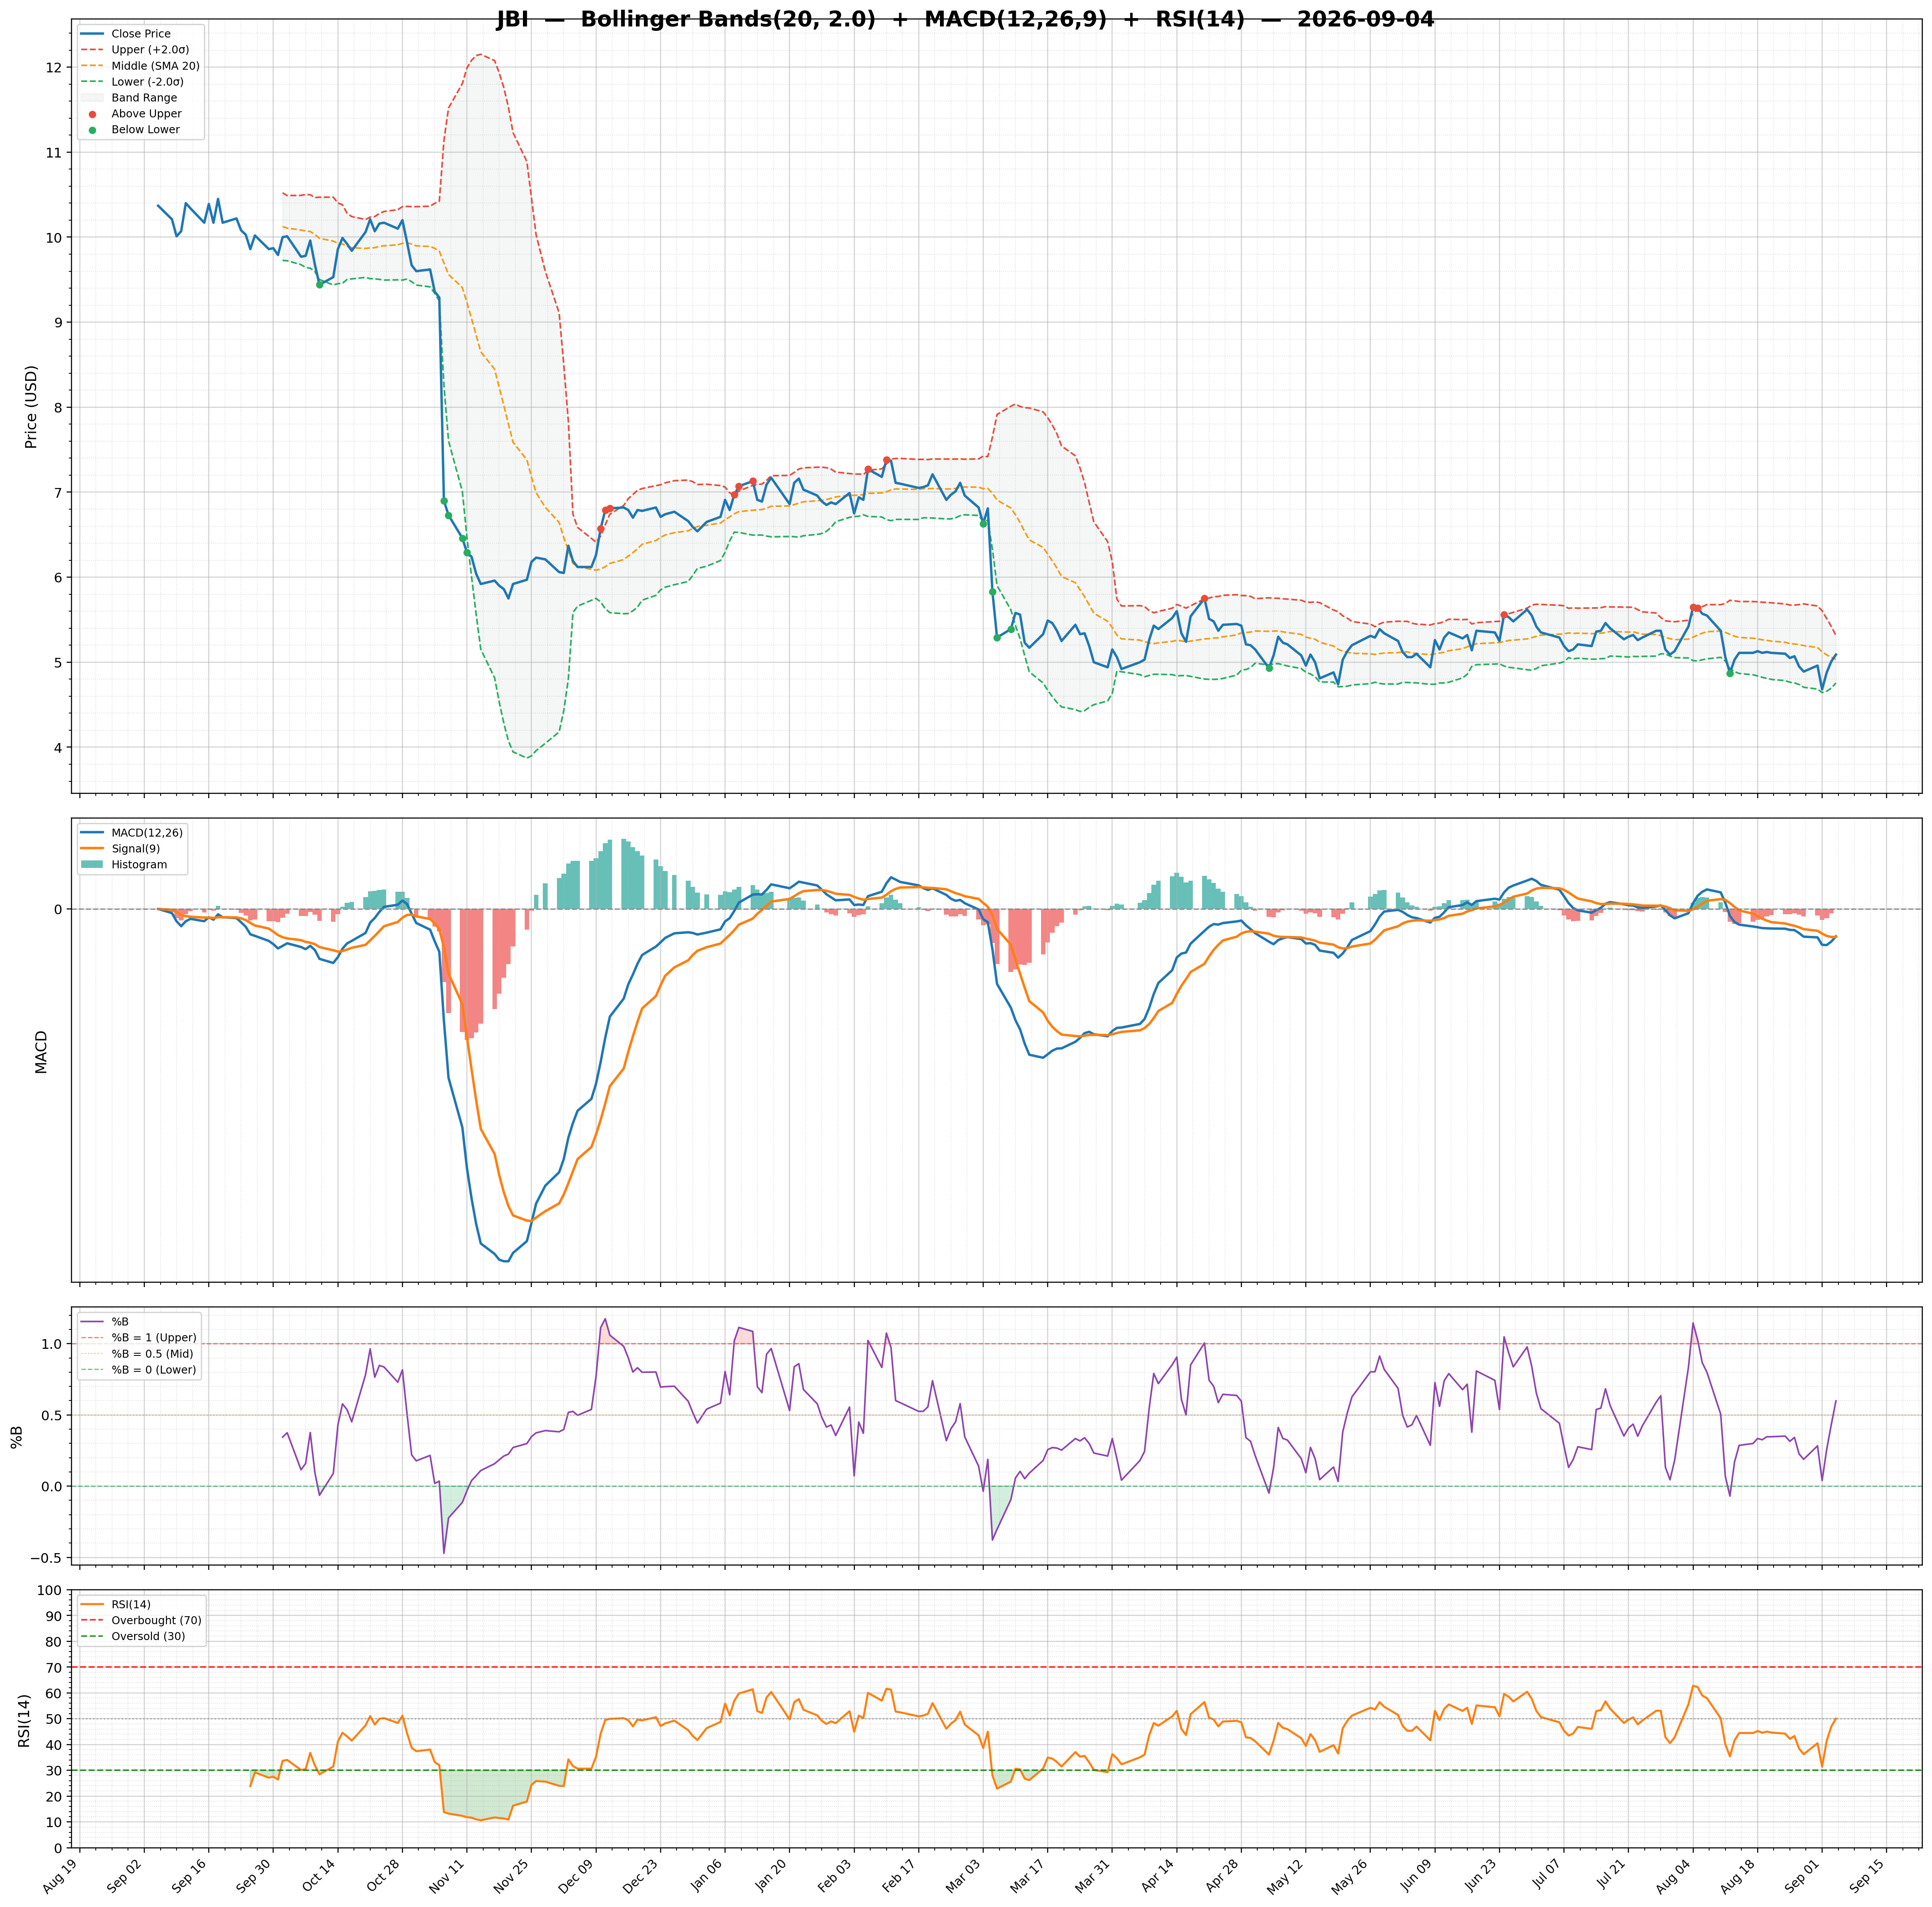
| MACD | -0.06 | Lower Band | 4.04 | Target Low | $4.50 |
| MACD Signal | -0.11 | Middle Band | 4.23 | Target Median | $9.00 |
| Histogram | 0.05 | Upper Band | 4.42 | Analysts | 5 |
| Previous Histogram | 0.03 | Bandwidth | 8.910 | Upside | 77.51% |
| Histogram Trend | Increasing | %B | 1.26 | ||