Kimco Realty Corporation (HC) (KIM)
Real Estate • REIT - Retail • $23.59 • MCap: 15,367,784,448
https://www.kimcorealty.com • Kimco Realty is a real estate investment trust (REIT) and leading owner and operator of high-quality, open-air, grocery-anchored shopping centers and mixed-use properties in the United States. The company's portfolio is strategically concentrated in the first-ring suburbs of the top major metropolitan markets, including high-barrier-to-entry coastal markets and Sun Belt cities. Its tenant mix is focused on essential, necessity-based goods and services that drive multiple shopping trips per week. Publicly traded on the NYSE since 1991 and included in the S&P 500 Index, the company has specialized in shopping center ownership, management, acquisitions, and value-enhancing redevelopment activities for more than 65 years. With a proven commitment to corporate responsibility, Kimco Realty is a recognized industry leader in this area. As of June 30, 2026, the company owned interests in 564 U.S. shopping centers and mixed-use assets comprising 100 million square feet of gross leasable space. Kimco Realty Corporation was incorporated in 1958 in Maryland and is based in Jericho, New York.
RND_10_7_2026
Notes
10/07/2026
Google says HOLD
10/07/2026
look for Vol
| Score | Price | 52 Week & Averages | Relative Strength | Risk | |||||
|---|---|---|---|---|---|---|---|---|---|
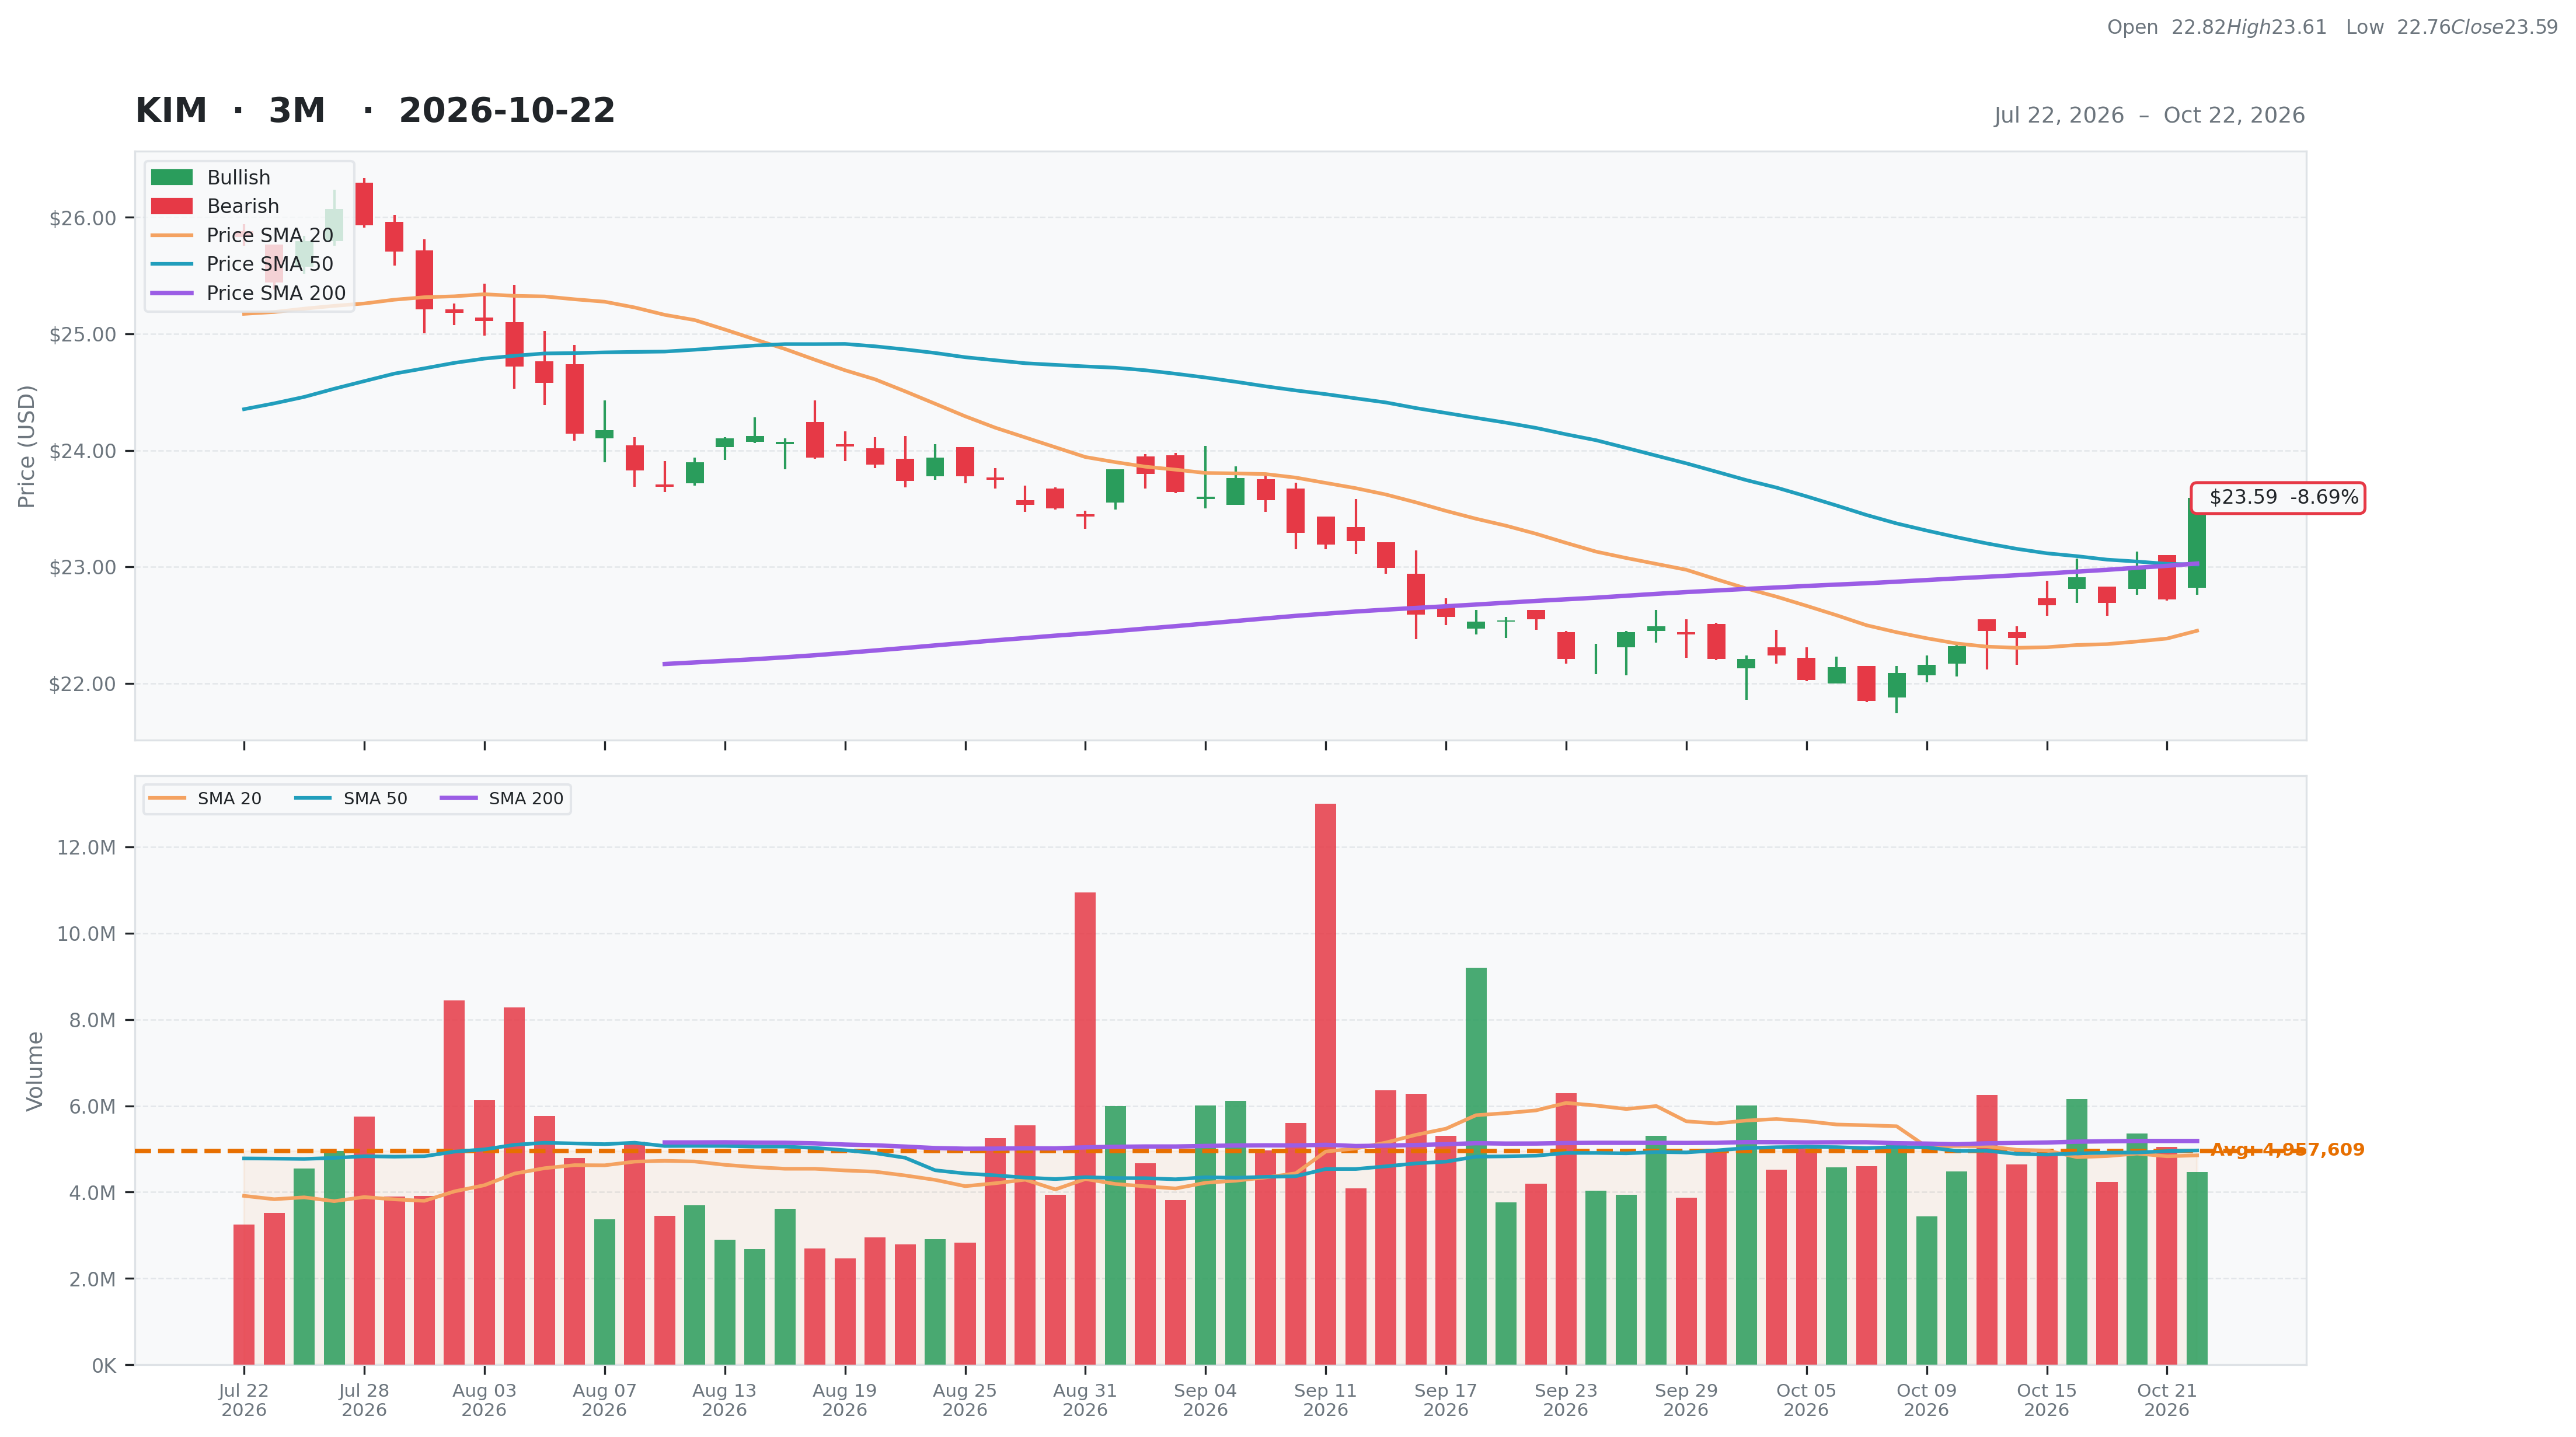
| Total | 46 | Current | $23.59 | 52W High | $26.07 -9.52% | Relative Strength | 0.02 | Beta | 0.96 |
| Business Quality | 25 | Weekly | $22.67 4.06% | 52W Low | $18.96 24.39% | 3M | -0.09 | Short % | 0.06 |
| Financial Strength | 6 | Monthly | $22.55 4.61% | Above 50DMA | $23.02 2.48% | 6M | 0.01 | Risk Score | 5 |
| Growth Outlook | 2 | Quarterly | $25.79 -8.55% | Above 200DMA | $23.03 2.44% | 9M | 0.18 | ||
| Momentum | 4 | Yearly | $21.35 10.49% | 12M | 0.11 | ||||
| Valuation | Financial Strength | Growth/Profitability | |||
|---|---|---|---|---|---|
| Trailing P/E | 26.95 | Cash | 702M | Revenue Growth | 0.05% |
| Forward P/E | 25.46 | Debt | 8,859M | Earnings Growth | -0.06% |
| PEG Ratio | 3.37 | Debt/Equity | 84.99 | Qtr Earnings Growth | -0.06% |
| Price/Sales | 7.03 | Current Ratio | 0.97 | Gross Margin | 0.69% |
| Price/Book | 1.50 | Quick Ratio | 0.97 | Operating Margin | 0.37% |
| EV/Revenue | 10.83 | Operating CF | 1,179M | Profit Margin | 0.28% |
| EV/EBITDA | 17.78 | Free CF | 871M | EBITDA Margin | 0.61% |
| Ent Value | 23,682M | Return on Assets | 0.02% | ||
| Return on Equity | 0.06% | ||||
| Technical | Volume & Bollinger Bands | Analyst | |||
|---|---|---|---|---|---|
| RSI | 64.74 | Volume | 6.16M | Rating | buy |
| Previous RSI | 51.35 | Avg Volume 20D | 4.85M | Target Mean | $26.06 |
| RSI Trend | Up | Relative Volume | 0.84 | Target High | $30.00 |
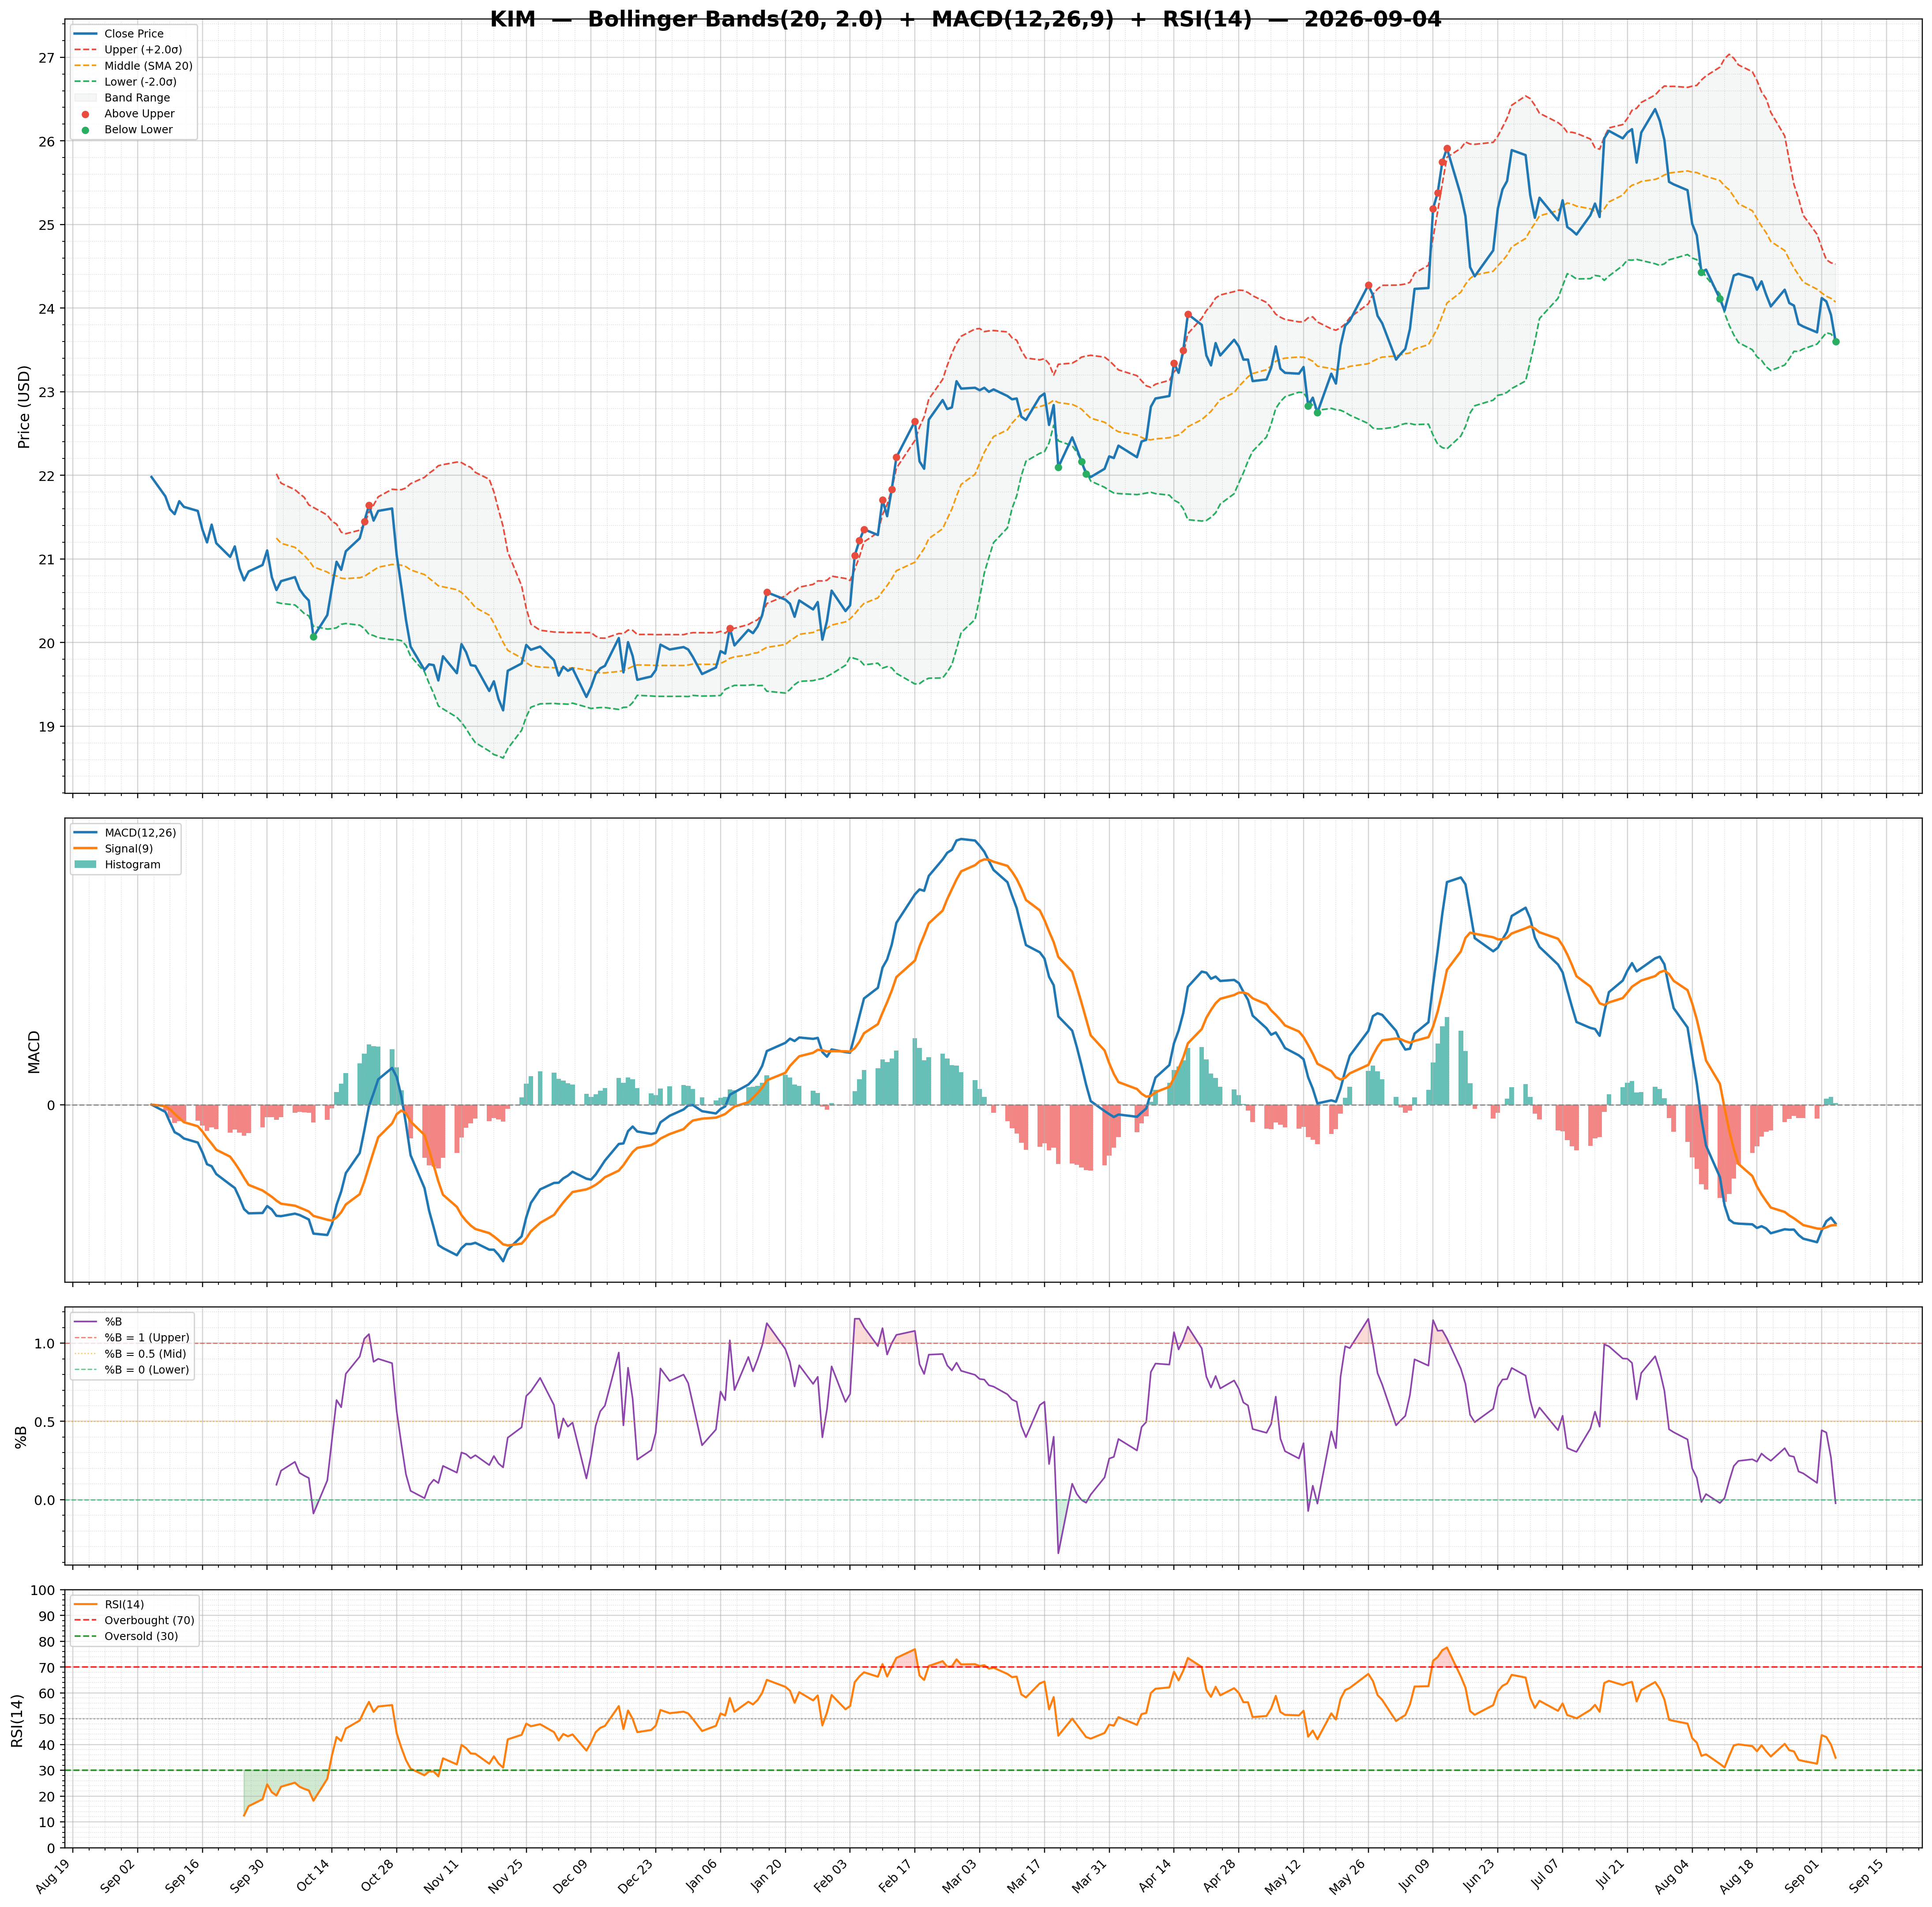
| MACD | 0.02 | Lower Band | 21.65 | Target Low | $23.00 |
| MACD Signal | -0.15 | Middle Band | 22.45 | Target Median | $26.00 |
| Histogram | 0.17 | Upper Band | 23.25 | Analysts | 21 |
| Previous Histogram | 0.13 | Bandwidth | 7.100 | Upside | 13.75% |
| Histogram Trend | Increasing | %B | 1.21 | ||