Key Tronic Corporation (KTCC)
Technology • Computer Hardware • $2.14 • MCap: 23,459,680
https://www.keytronic.com • Key Tronic Corporation, together with its subsidiaries, provides contract manufacturing services for original equipment manufacturers in the United States and internationally. The company offers integrated electronic and mechanical engineering, assemblies, component selection, sourcing and procurement, logistics, and new product testing and production services. It also provides product and prototype design, surface mount technologies and pin through hole capability for printed circuit board assembly, tool making, sheet metal fabrication and painting, liquid injection molding, and complex and full product assembly. In addition, the company offers precision metal stamping, fabricating, and finishing; automated processes, including component insertion, selective soldering, flexible robotic assembly, computerized vision system quality inspection, laser turrets, automated switch and key top installation, robotic welding, automated powder coat application, and automated functional testing; and research, development, and engineering services. It markets its products and services through field sales people and distributors. The company exports its products. Key Tronic Corporation was incorporated in 1969 and is headquartered in Spokane Valley, Washington.
Ex-AAII
Ani
| Score | Price | 52 Week & Averages | Relative Strength | Risk | |||||
|---|---|---|---|---|---|---|---|---|---|
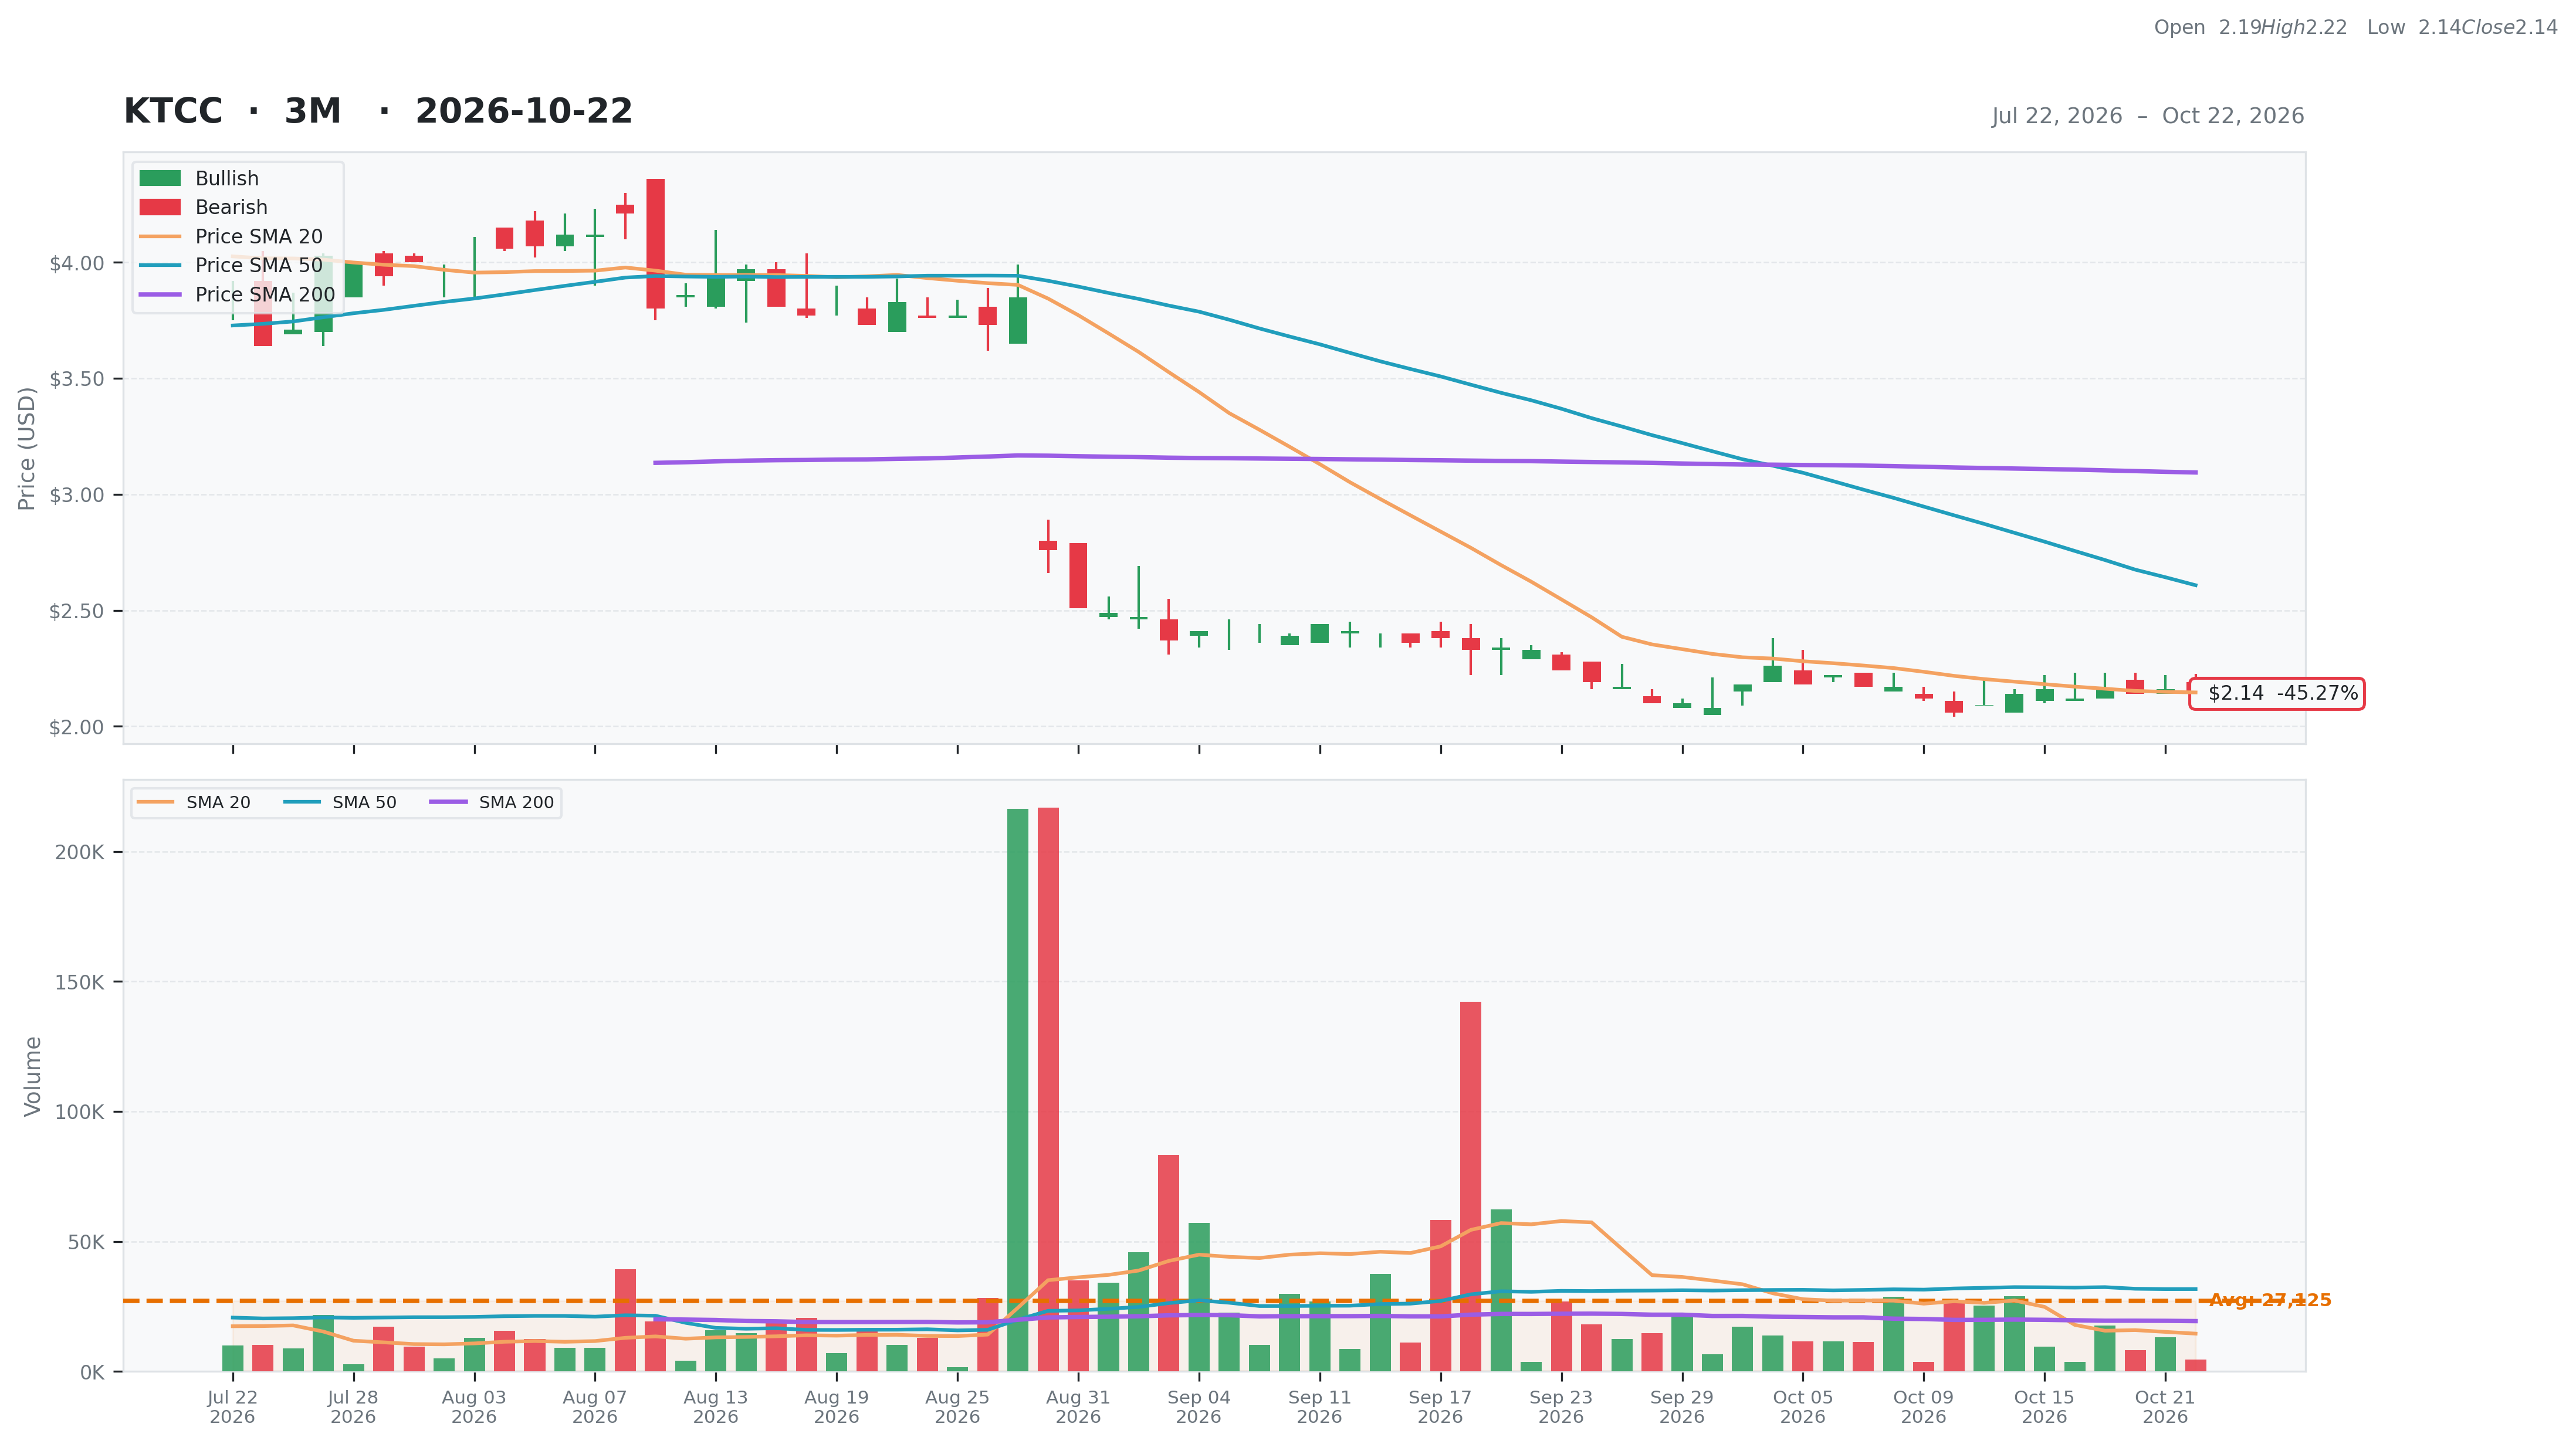
| Total | 33 | Current | $2.14 | 52W High | $4.26 -49.77% | Relative Strength | -0.33 | Beta | 1.16 |
| Business Quality | 1 | Weekly | $2.16 -0.93% | 52W Low | $2.06 3.88% | 3M | -0.42 | Short % | 0.01 |
| Financial Strength | 7 | Monthly | $2.33 -8.15% | Above 50DMA | $2.61 -17.95% | 6M | -0.26 | Risk Score | |
| Growth Outlook | 1 | Quarterly | $3.71 -42.32% | Above 200DMA | $3.09 -30.84% | 9M | -0.22 | ||
| Momentum | 0 | Yearly | $3.28 -34.76% | 12M | -0.34 | ||||
| Valuation | Financial Strength | Growth/Profitability | |||
|---|---|---|---|---|---|
| Trailing P/E | N/A | Cash | 1M | Revenue Growth | -0.08% |
| Forward P/E | N/A | Debt | 140M | Earnings Growth | N/A |
| PEG Ratio | 0.82 | Debt/Equity | 202.92 | Qtr Earnings Growth | N/A |
| Price/Sales | 0.06 | Current Ratio | 2.10 | Gross Margin | 0.06% |
| Price/Book | 0.33 | Quick Ratio | 1.02 | Operating Margin | -0.17% |
| EV/Revenue | 0.42 | Operating CF | 4M | Profit Margin | -0.12% |
| EV/EBITDA | -15.71 | Free CF | 4M | EBITDA Margin | -0.03% |
| Ent Value | 163M | Return on Assets | -0.04% | ||
| Return on Equity | -0.51% | ||||
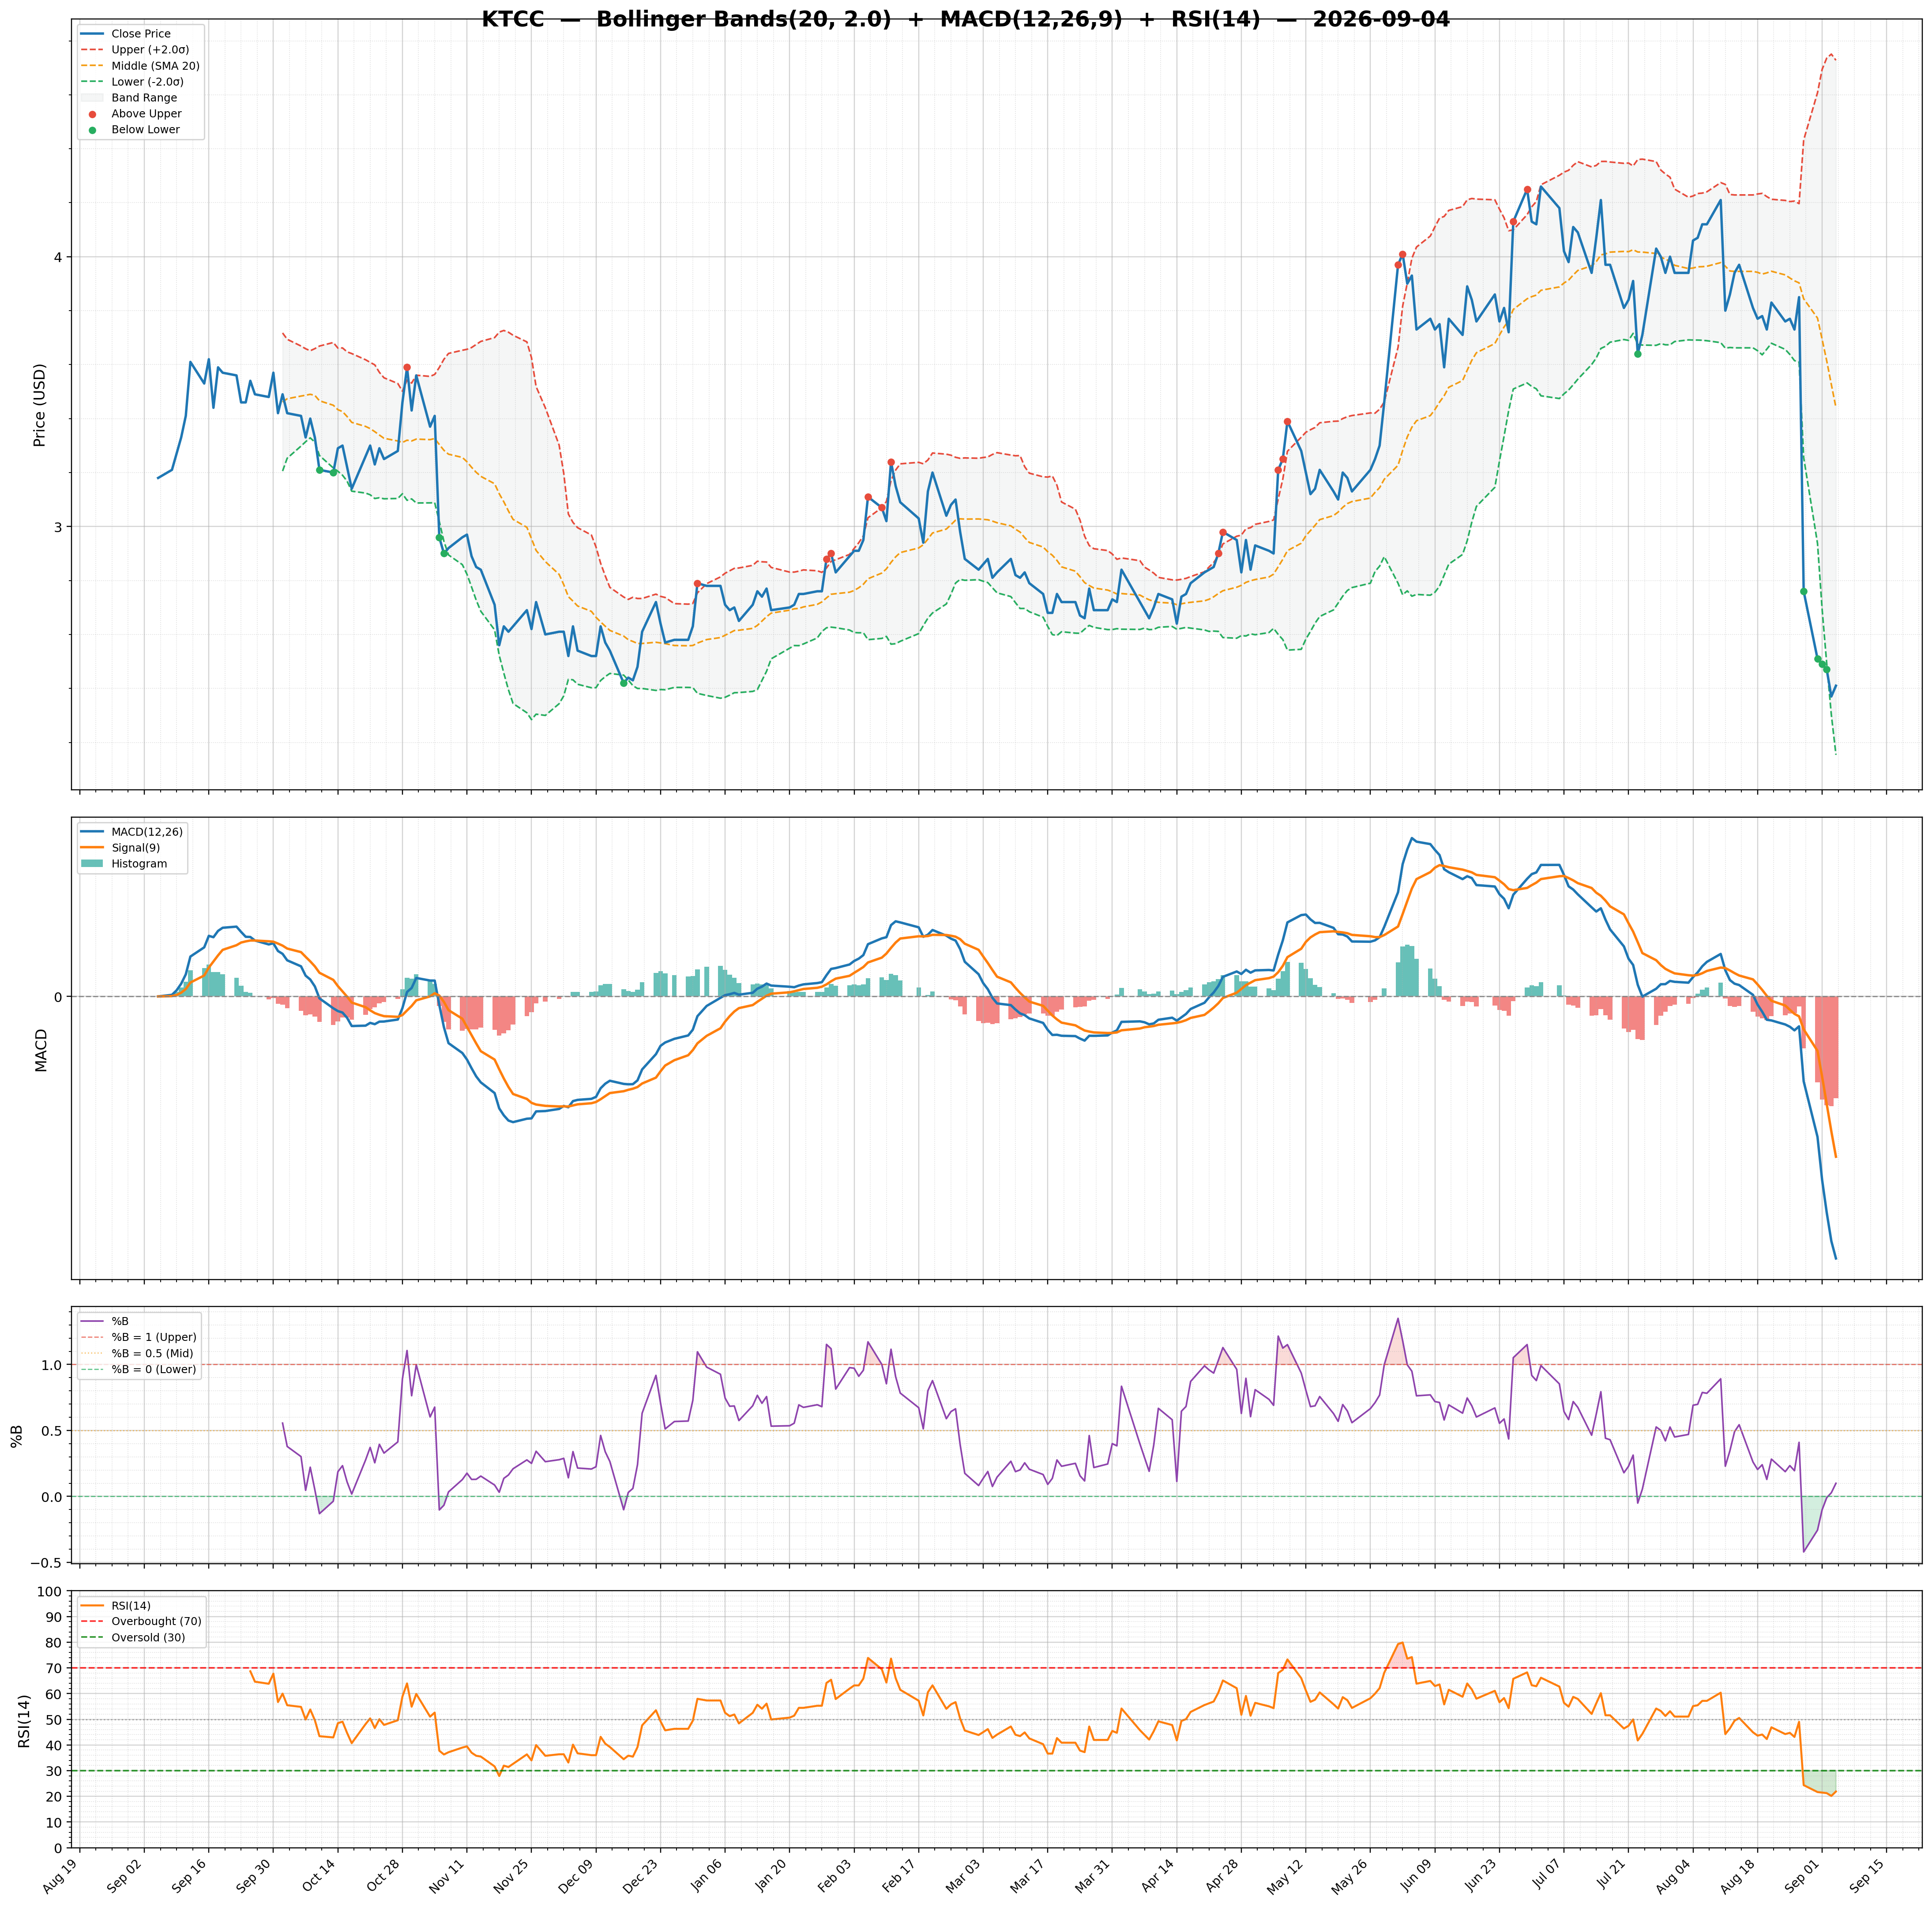
| Technical | Volume & Bollinger Bands | Analyst | |||
|---|---|---|---|---|---|
| RSI | 38.20 | Volume | 0M | Rating | none |
| Previous RSI | 39.46 | Avg Volume 20D | 0.01M | Target Mean | N/A |
| RSI Trend | Down | Relative Volume | 0.20 | Target High | N/A |
| MACD | -0.11 | Lower Band | 2.05 | Target Low | N/A |
| MACD Signal | -0.15 | Middle Band | 2.15 | Target Median | N/A |
| Histogram | 0.04 | Upper Band | 2.24 | Analysts | N/A |
| Previous Histogram | 0.04 | Bandwidth | 8.940 | Upside | N/A |
| Histogram Trend | Decreasing | %B | 0.47 | ||