Kratos Defense & Security Solut (KTOS)
Industrials • Aerospace & Defense • $38.27 • MCap: 7,587,695,616
https://www.kratosdefense.com • Kratos Defense & Security Solutions, Inc., a technology company, provides technology, hardware, products, system, and software for the defense, national security, and commercial markets in the United States, other North America, the Asia Pacific, the Middle East, Europe, and Internationally. The company operates through Kratos Government Solutions and Unmanned Systems segments. It offers virtualized ground systems for satellites and space vehicles, including software for command and control, telemetry, and tracking and control; jet powered unmanned aerial drone systems and hypersonic vehicles and rocket systems; propulsion systems for drones, missiles, loitering munitions, supersonic systems, spacecraft and launch systems, command, control, communication, computing, combat, and intelligence surveillance and reconnaissance; and microwave electronic products for missile, radar, missile defense, space, and satellite; and counter unmanned aircraft systems, directed energy, communication and other systems, and virtual and augmented reality training systems for the warfighter. The company primarily serves national security-related agencies, the U.S. Department of Defense, intelligence and classified agencies, international government agencies, and domestic and international commercial customers. Kratos Defense & Security Solutions, Inc. was formerly known as Wireless Facilities, Inc. and changed its name to Kratos Defense & Security Solutions, Inc. in August 1999. Kratos Defense & Security Solutions, Inc. was incorporated in 1994 and is headquartered in San Diego, California.
Notes
10/05/2026
May be a good buy if you can hold for a yr
| Score | Price | 52 Week & Averages | Relative Strength | Risk | |||||
|---|---|---|---|---|---|---|---|---|---|
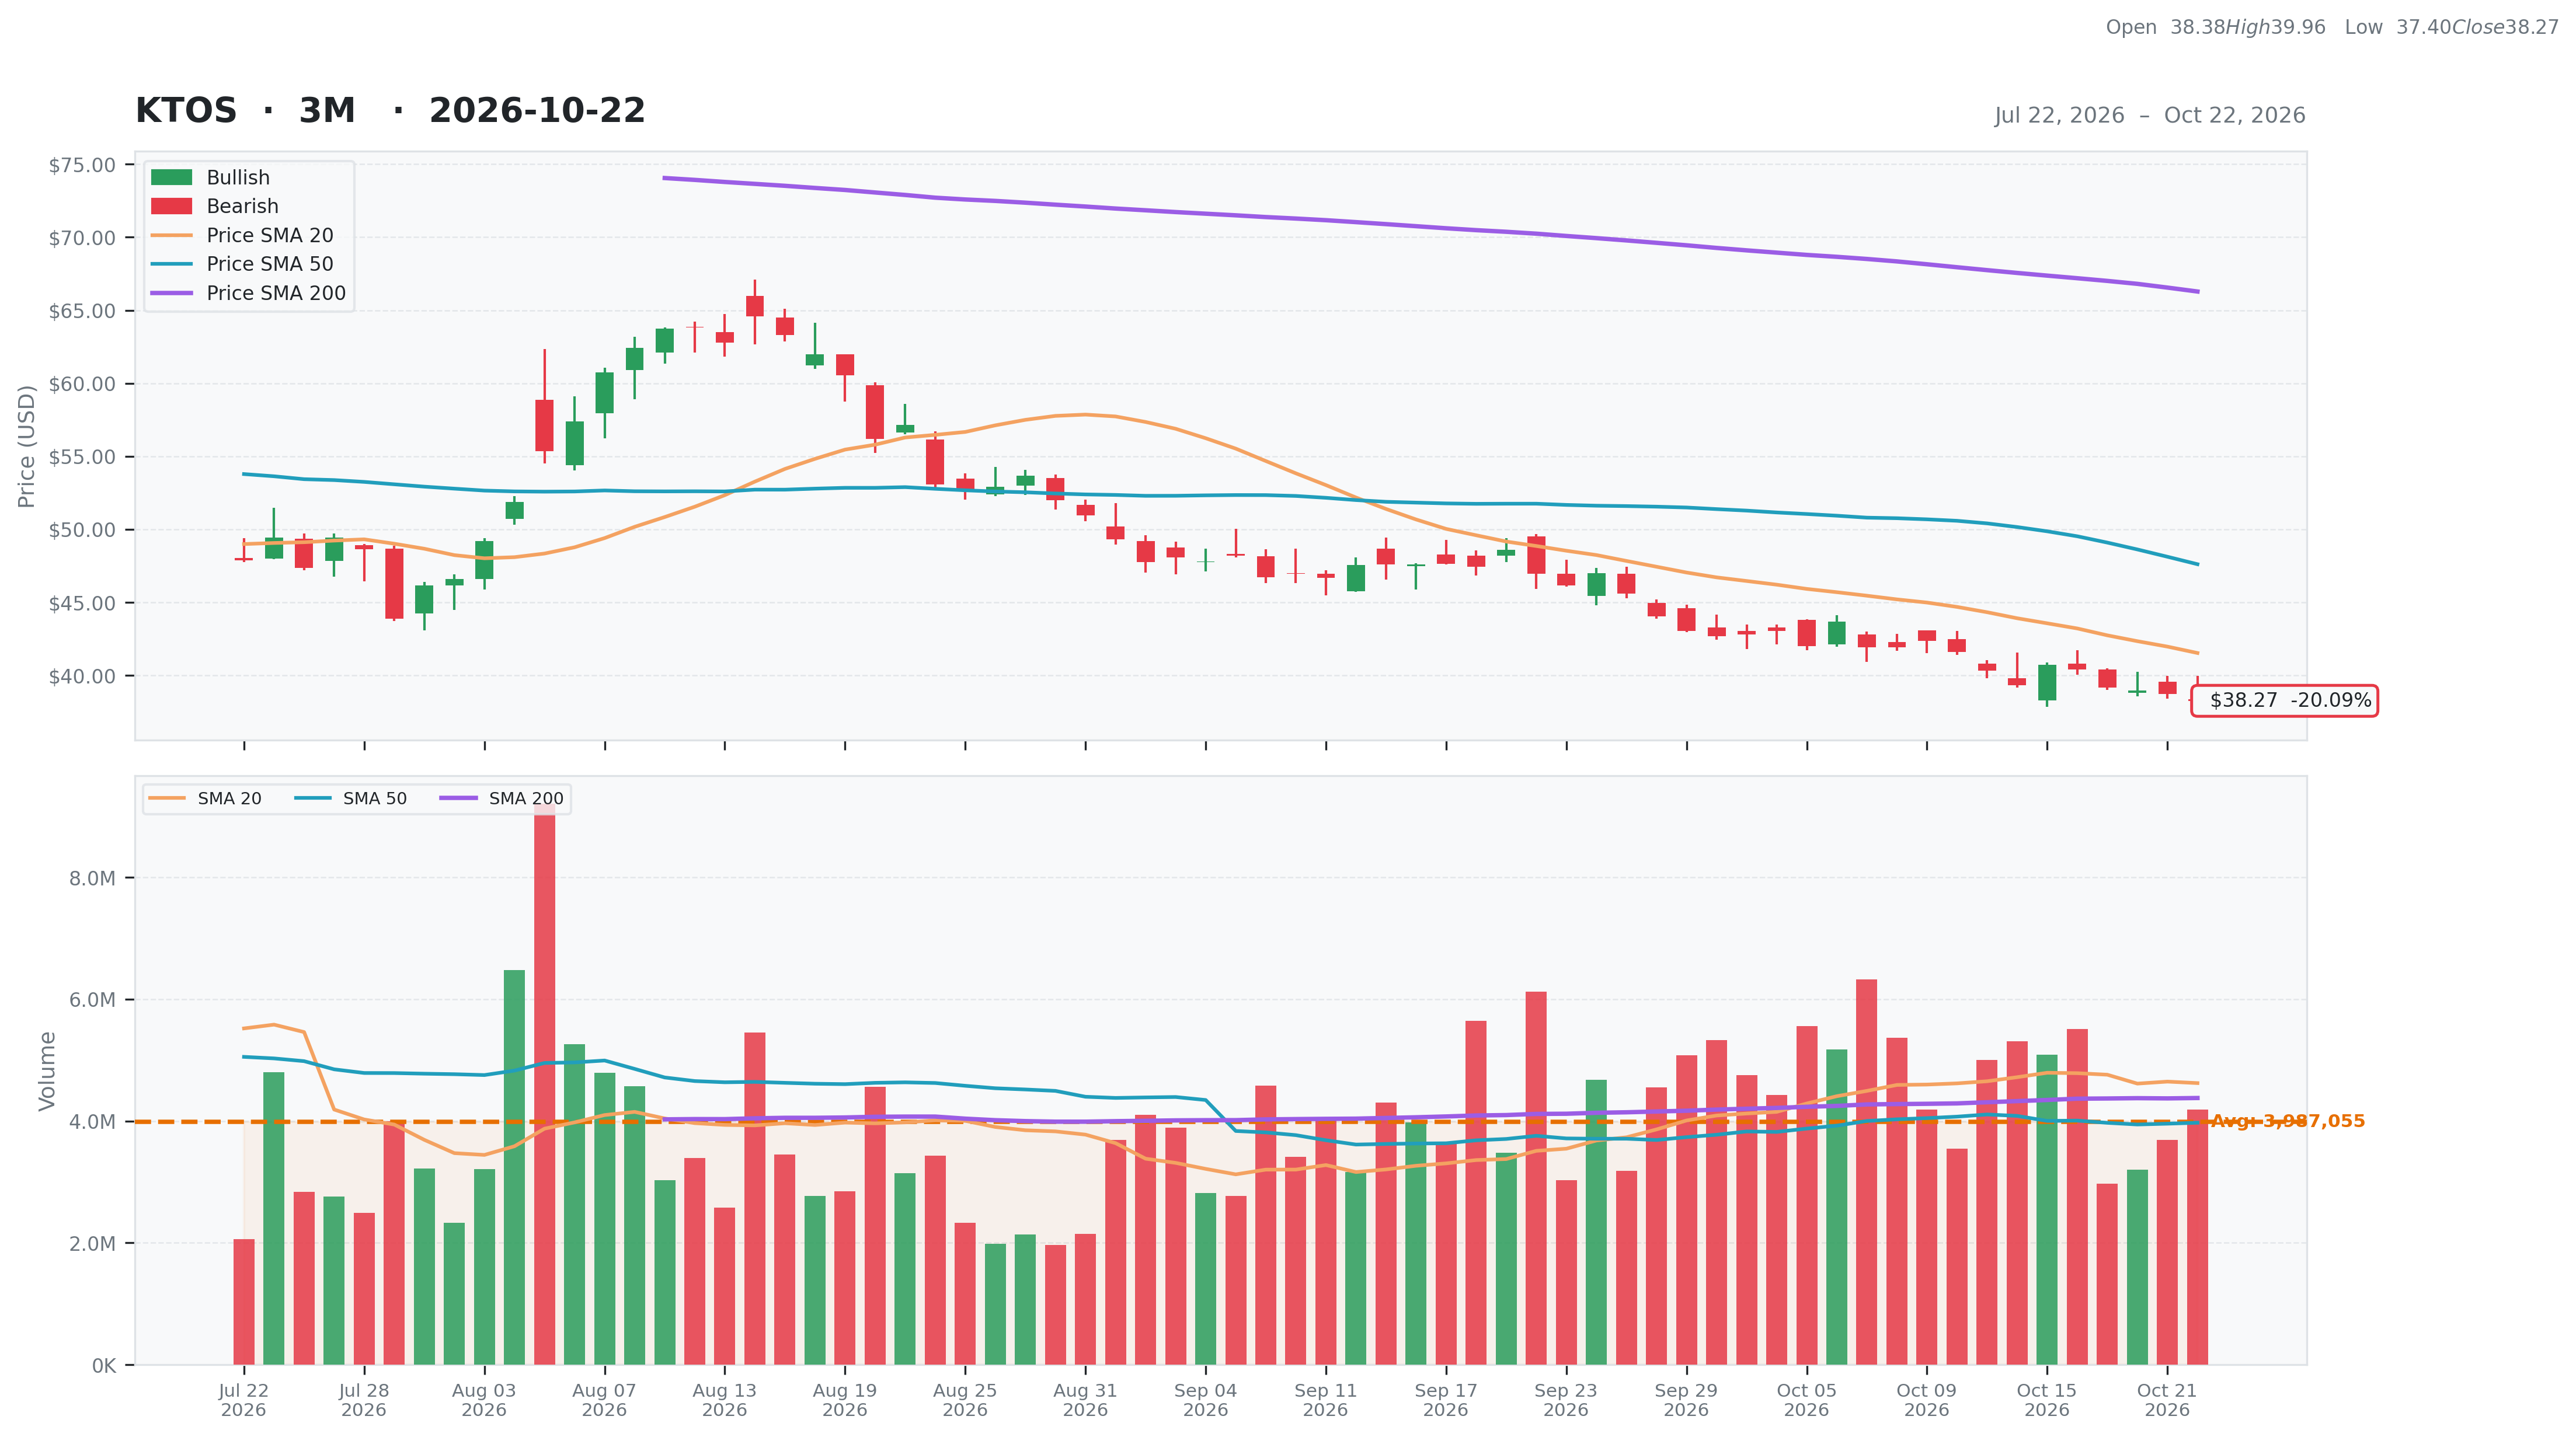
| Total | 42 | Current | $38.27 | 52W High | $130.72 -70.72% | Relative Strength | -0.41 | Beta | 1.11 |
| Business Quality | 4 | Weekly | $40.74 -6.06% | 52W Low | $38.27 0.00% | 3M | -0.19 | Short % | 0.06 |
| Financial Strength | 15 | Monthly | $46.97 -18.52% | Above 50DMA | $47.62 -19.64% | 6M | -0.42 | Risk Score | 4 |
| Growth Outlook | 11 | Quarterly | $47.35 -19.18% | Above 200DMA | $66.29 -42.27% | 9M | -0.66 | ||
| Momentum | 3 | Yearly | $90.68 -57.80% | 12M | -0.58 | ||||
| Valuation | Financial Strength | Growth/Profitability | |||
|---|---|---|---|---|---|
| Trailing P/E | 237.76 | Cash | 1,438M | Revenue Growth | 0.30% |
| Forward P/E | 36.30 | Debt | 194M | Earnings Growth | 0.07% |
| PEG Ratio | 36.41 | Debt/Equity | 5.65 | Qtr Earnings Growth | 0.52% |
| Price/Sales | 4.98 | Current Ratio | 5.54 | Gross Margin | 0.23% |
| Price/Book | 2.21 | Quick Ratio | 4.74 | Operating Margin | 0.00% |
| EV/Revenue | 4.17 | Operating CF | -40M | Profit Margin | 0.02% |
| EV/EBITDA | 72.92 | Free CF | -118M | EBITDA Margin | 0.06% |
| Ent Value | 6,344M | Return on Assets | 0.00% | ||
| Return on Equity | 0.01% | ||||
| Technical | Volume & Bollinger Bands | Analyst | |||
|---|---|---|---|---|---|
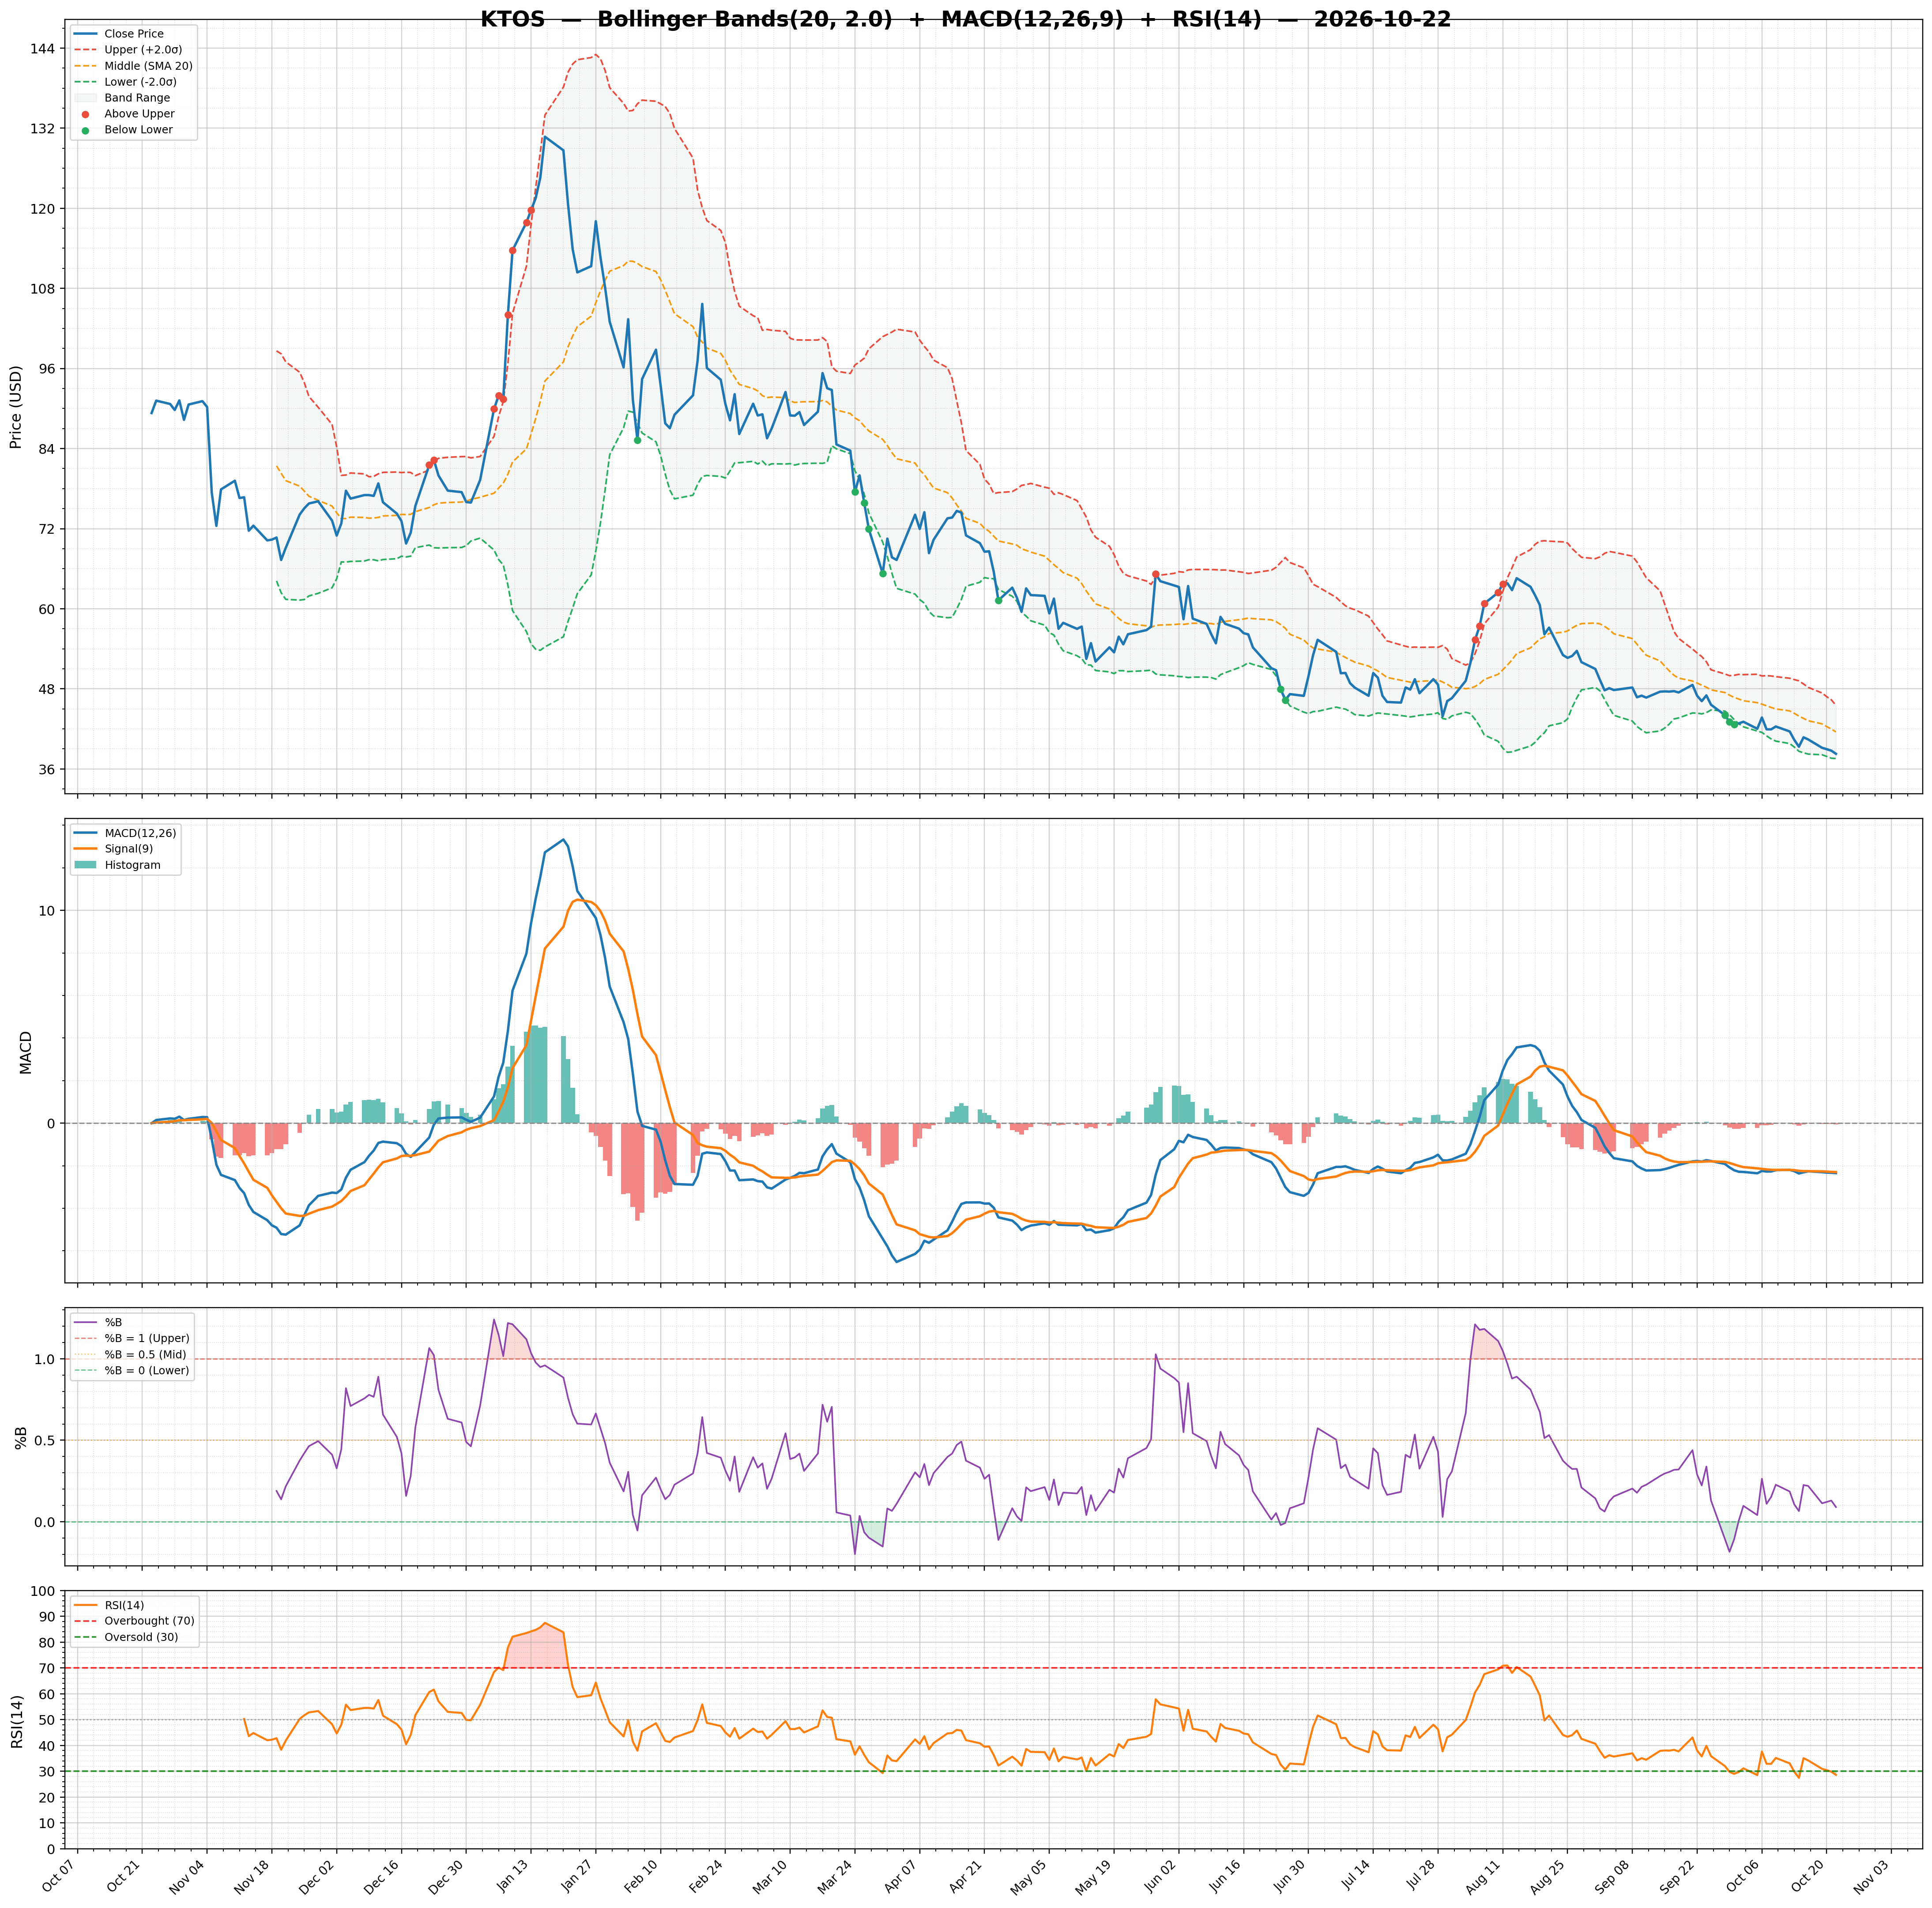
| RSI | 28.60 | Volume | 5.51M | Rating | strong_buy |
| Previous RSI | 29.83 | Avg Volume 20D | 4.62M | Target Mean | $98.33 |
| RSI Trend | Down | Relative Volume | 0.93 | Target High | $150.00 |
| MACD | -2.35 | Lower Band | 37.56 | Target Low | $55.00 |
| MACD Signal | -2.30 | Middle Band | 41.54 | Target Median | $95.00 |
| Histogram | -0.05 | Upper Band | 45.53 | Analysts | 24 |
| Previous Histogram | -0.04 | Bandwidth | 19.200 | Upside | 143.28% |
| Histogram Trend | Decreasing | %B | 0.09 | ||