Lakeland Industries, Inc. (LAKE)
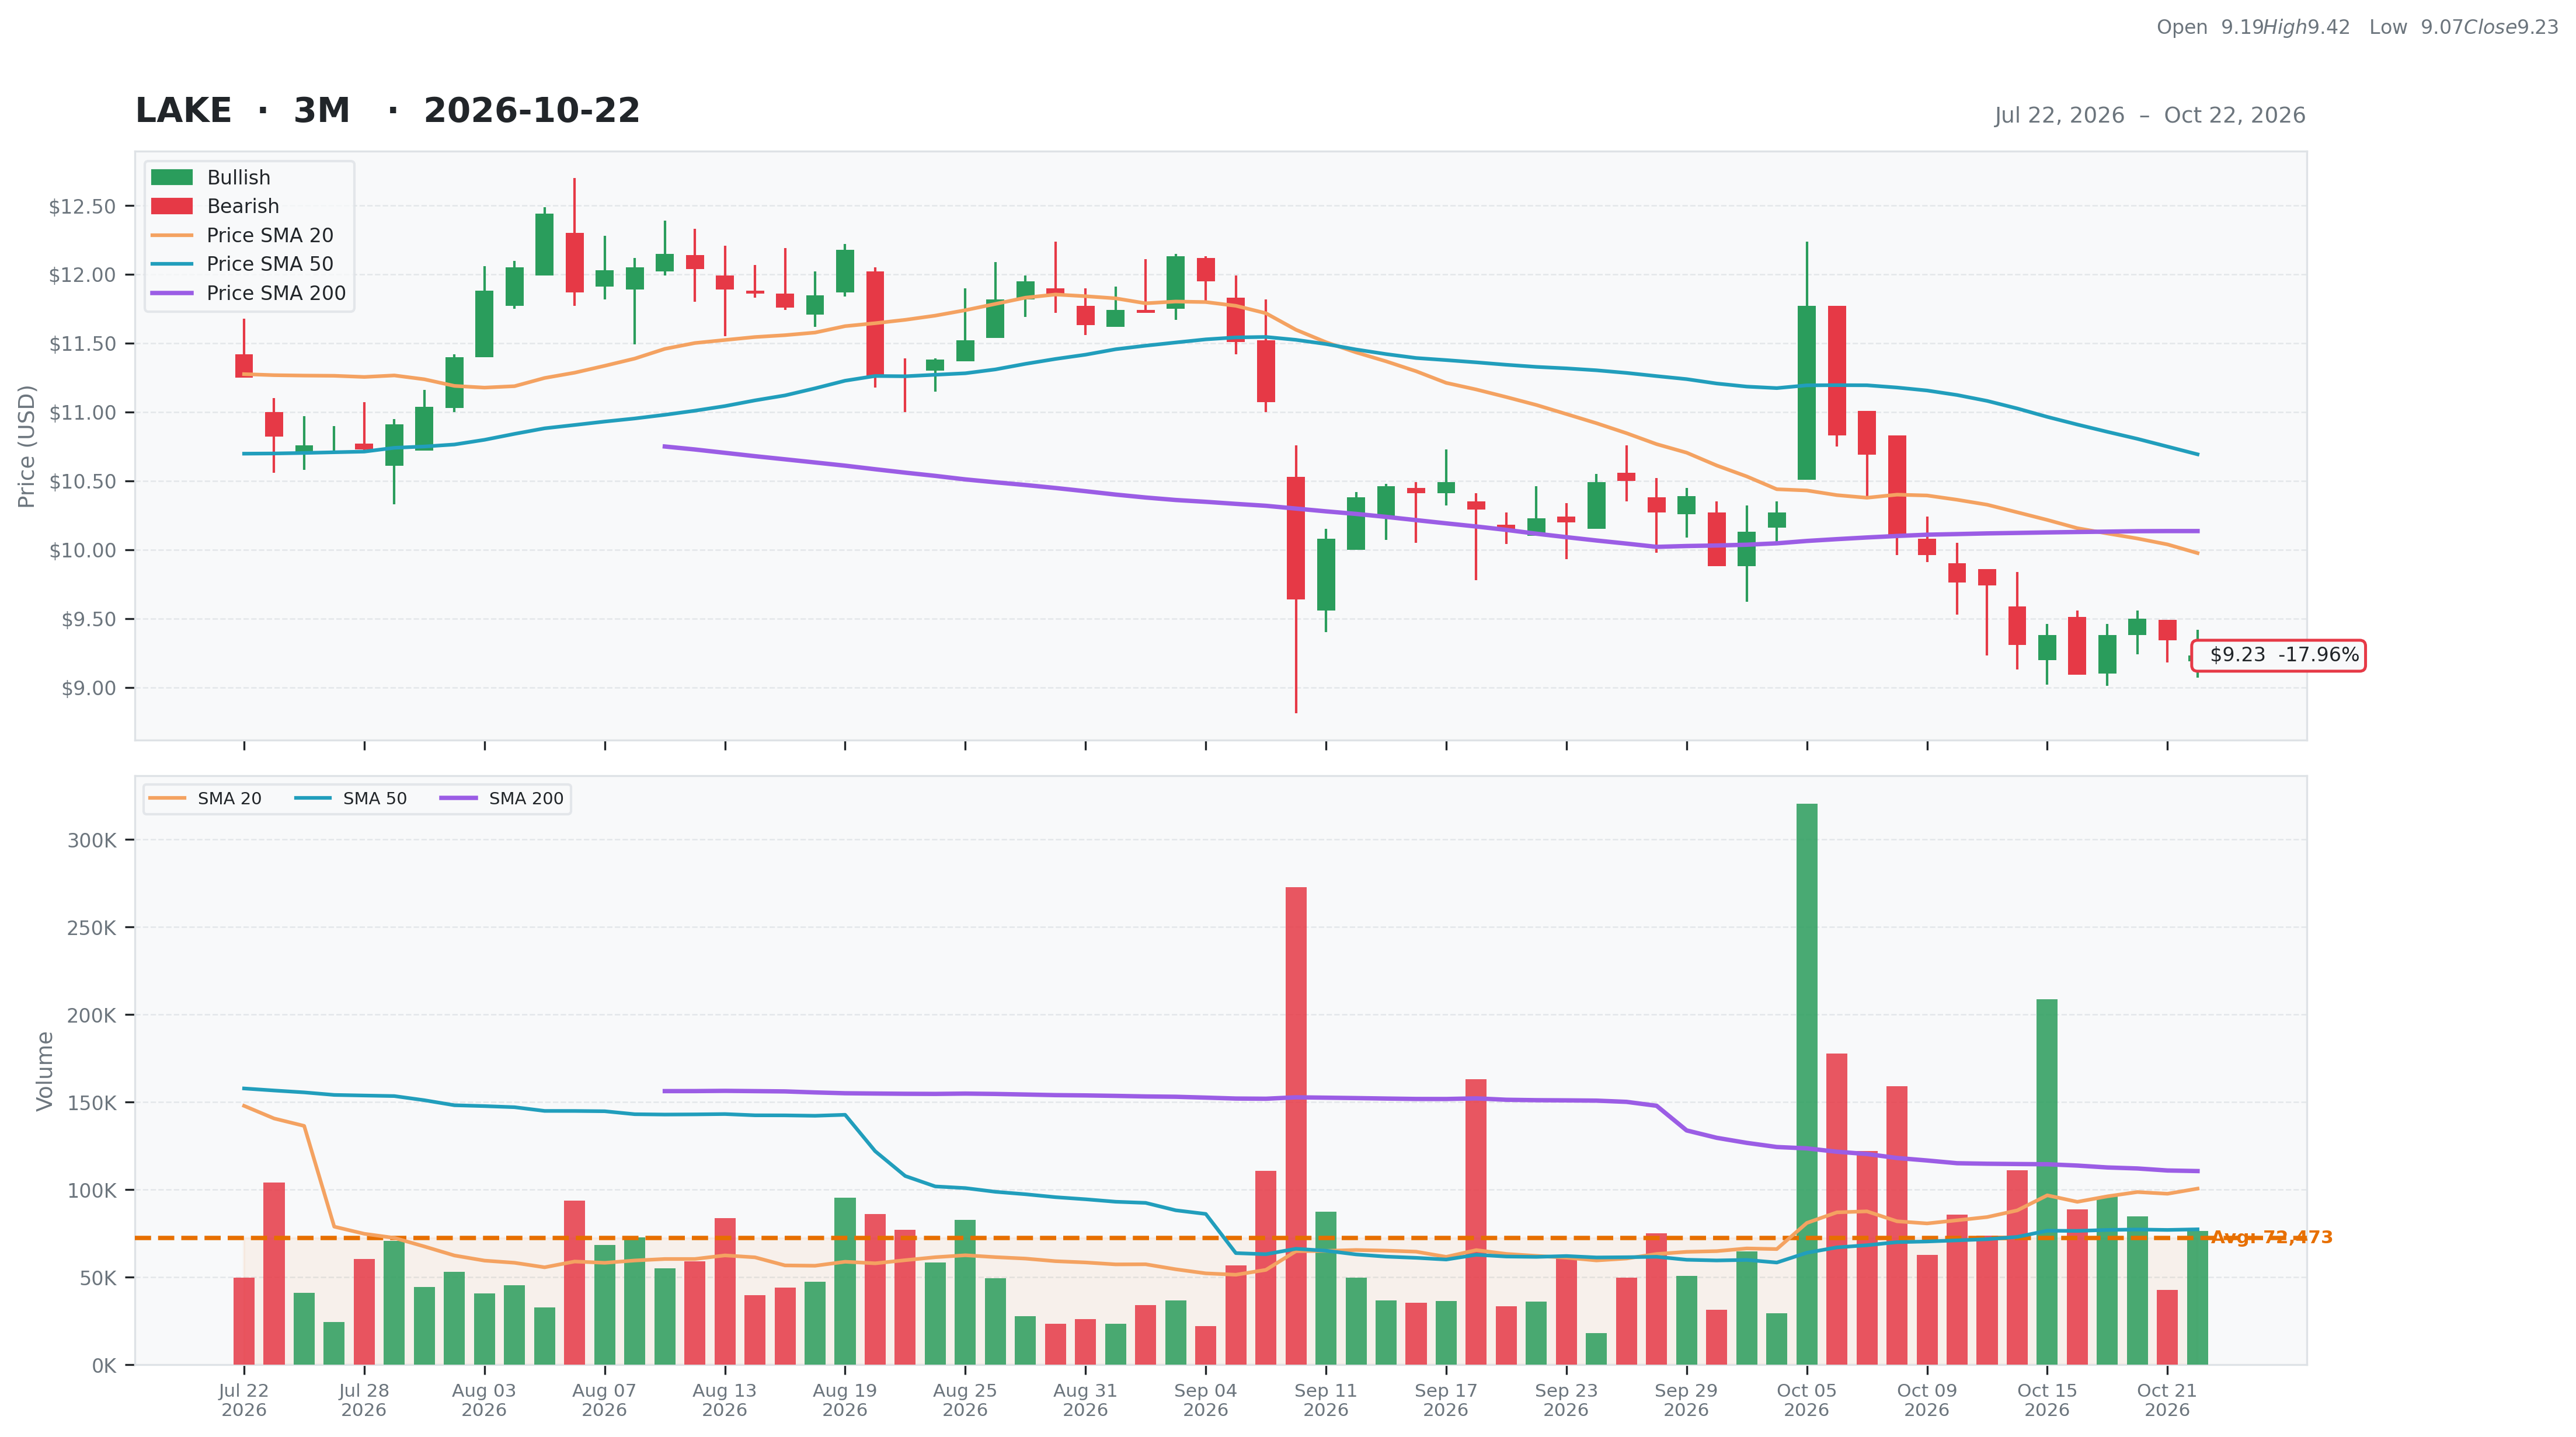
Consumer Cyclical • Apparel Manufacturing • $9.23 • MCap: 90,275,936
https://www.lakeland.com • Lakeland Industries, Inc., together with its subsidiaries, manufactures and sells industrial protective clothing and accessories for the industrial and first responder markets. It offers firefighter protective apparel and accessories; high-end chemical protective suits to provide protection from highly concentrated, toxic and/or lethal chemicals, and biological toxins; and limited use/disposable protective clothing, such as coveralls, laboratory coats, shirts, pants, hoods, aprons, sleeves, arm guards, caps, and smocks. The company provides durable woven garments; high performance FR/AR apparel; and services for the inspection, cleaning, decontamination, maintenance, and repair of firefighting protective apparel. The company sells its products to a network of safety and industrial supply distributors through in-house sales teams, customer service group, and independent sales representatives. It serves end users, such as integrated oil, chemical/petrochemical, automobile, steel, glass, construction, smelting, cleanroom, janitorial, pharmaceutical, and high technology electronics manufacturers, as well as scientific, medical laboratories, and the utilities industry; and federal, state, and local governmental agencies and departments. The company has operations in the United States, Europe, Mexico, Asia, Canada, Latin America, and internationally. Lakeland Industries, Inc. was incorporated in 1982 and is headquartered in Huntsville, Alabama.
AAII
ET
| Score | Price | 52 Week & Averages | Relative Strength | Risk | |||||
|---|---|---|---|---|---|---|---|---|---|
| Total | 38 | Current | $9.23 | 52W High | $16.84 -45.18% | Relative Strength | -0.17 | Beta | 1.45 |
| Business Quality | 4 | Weekly | $9.38 -1.60% | 52W Low | $7.58 21.77% | 3M | -0.14 | Short % | 0.17 |
| Financial Strength | 10 | Monthly | $10.23 -9.78% | Above 50DMA | $10.69 -13.68% | 6M | -0.09 | Risk Score | 8 |
| Growth Outlook | 1 | Quarterly | $10.76 -14.22% | Above 200DMA | $10.14 -8.93% | 9M | -0.01 | ||
| Momentum | 2 | Yearly | $16.73 -44.82% | 12M | -0.45 | ||||
| Valuation | Financial Strength | Growth/Profitability | |||
|---|---|---|---|---|---|
| Trailing P/E | N/A | Cash | 18M | Revenue Growth | -0.04% |
| Forward P/E | 16.99 | Debt | 39M | Earnings Growth | N/A |
| PEG Ratio | 1.14 | Debt/Equity | 31.12 | Qtr Earnings Growth | N/A |
| Price/Sales | 0.47 | Current Ratio | 2.98 | Gross Margin | 0.33% |
| Price/Book | 0.72 | Quick Ratio | 1.28 | Operating Margin | -0.04% |
| EV/Revenue | 0.58 | Operating CF | -1M | Profit Margin | -0.14% |
| EV/EBITDA | -33.83 | Free CF | 18M | EBITDA Margin | -0.02% |
| Ent Value | 111M | Return on Assets | -0.02% | ||
| Return on Equity | -0.20% | ||||
| Technical | Volume & Bollinger Bands | Analyst | |||
|---|---|---|---|---|---|
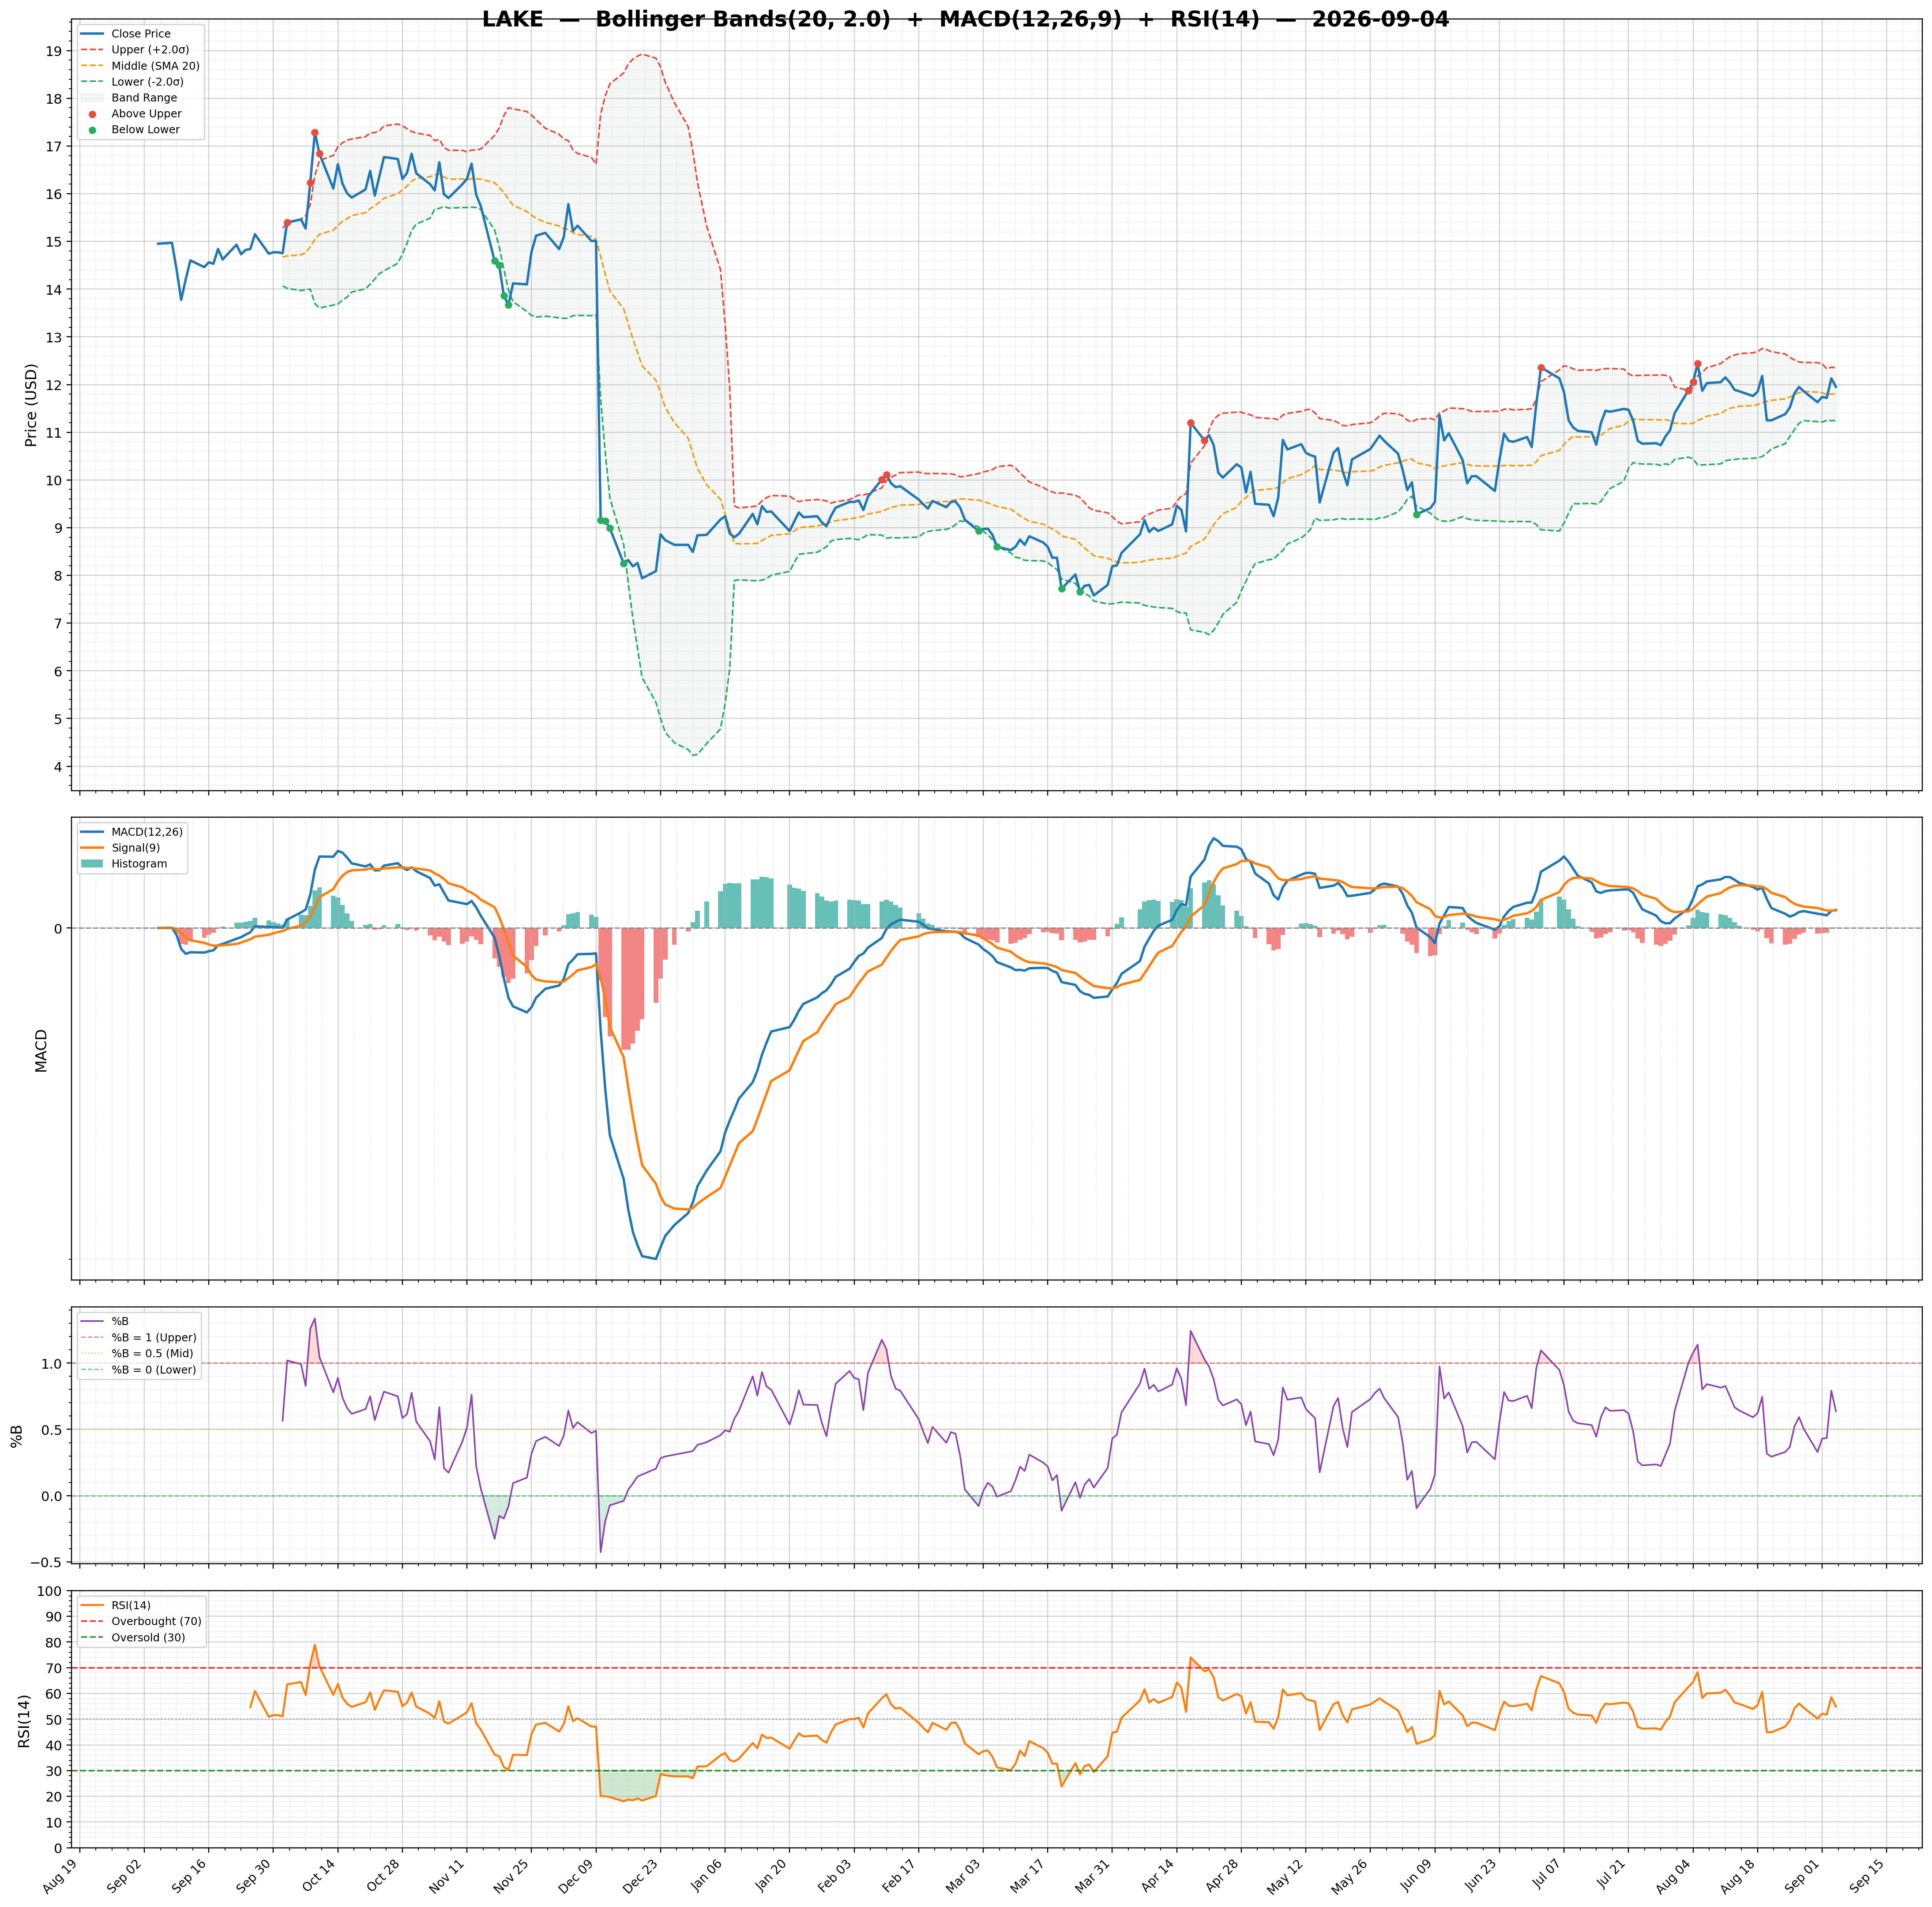
| RSI | 38.61 | Volume | 0.09M | Rating | none |
| Previous RSI | 39.77 | Avg Volume 20D | 0.1M | Target Mean | $15.25 |
| RSI Trend | Down | Relative Volume | 0.89 | Target High | $17.00 |
| MACD | -0.40 | Lower Band | 8.65 | Target Low | $13.00 |
| MACD Signal | -0.35 | Middle Band | 9.98 | Target Median | $15.50 |
| Histogram | -0.05 | Upper Band | 11.30 | Analysts | 4 |
| Previous Histogram | -0.06 | Bandwidth | 26.580 | Upside | 67.77% |
| Histogram Trend | Increasing | %B | 0.22 | ||