nLIGHT, Inc. (LASR)
Technology • Semiconductors • $36.1 • MCap: 1,942,428,800
https://www.nlight.net • nLIGHT, Inc. engages in the design, development, manufacture, and sale of semiconductor and fiber lasers for aerospace and defense, industrial, and microfabrication applications. It operates through two segments, Laser Products and Advanced Development. The company offers semiconductor lasers with various ranges of power levels, wavelengths, and output fiber sizes; and programmable and serviceable fiber lasers for use in aerospace and defense and industrial applications. It also provides fiber amplifiers, beam combination, and control systems for use in high-energy laser systems in directed energy applications. The company sells its products through direct sales force in the United States, China, South Korea, and European countries, as well as through independent sales representatives and distributors in Asia, Australia, Europe, the Middle East, and South America. The company was formerly known as nLight Photonics Corporation and changed its name to nLIGHT, Inc. in January 2016. nLIGHT, Inc. was incorporated in 2000 and is headquartered in Camas, Washington.
Reversal Strategy
Notes
10/23/2026
Speculative BUY
| Score | Price | 52 Week & Averages | Relative Strength | Risk | |||||
|---|---|---|---|---|---|---|---|---|---|
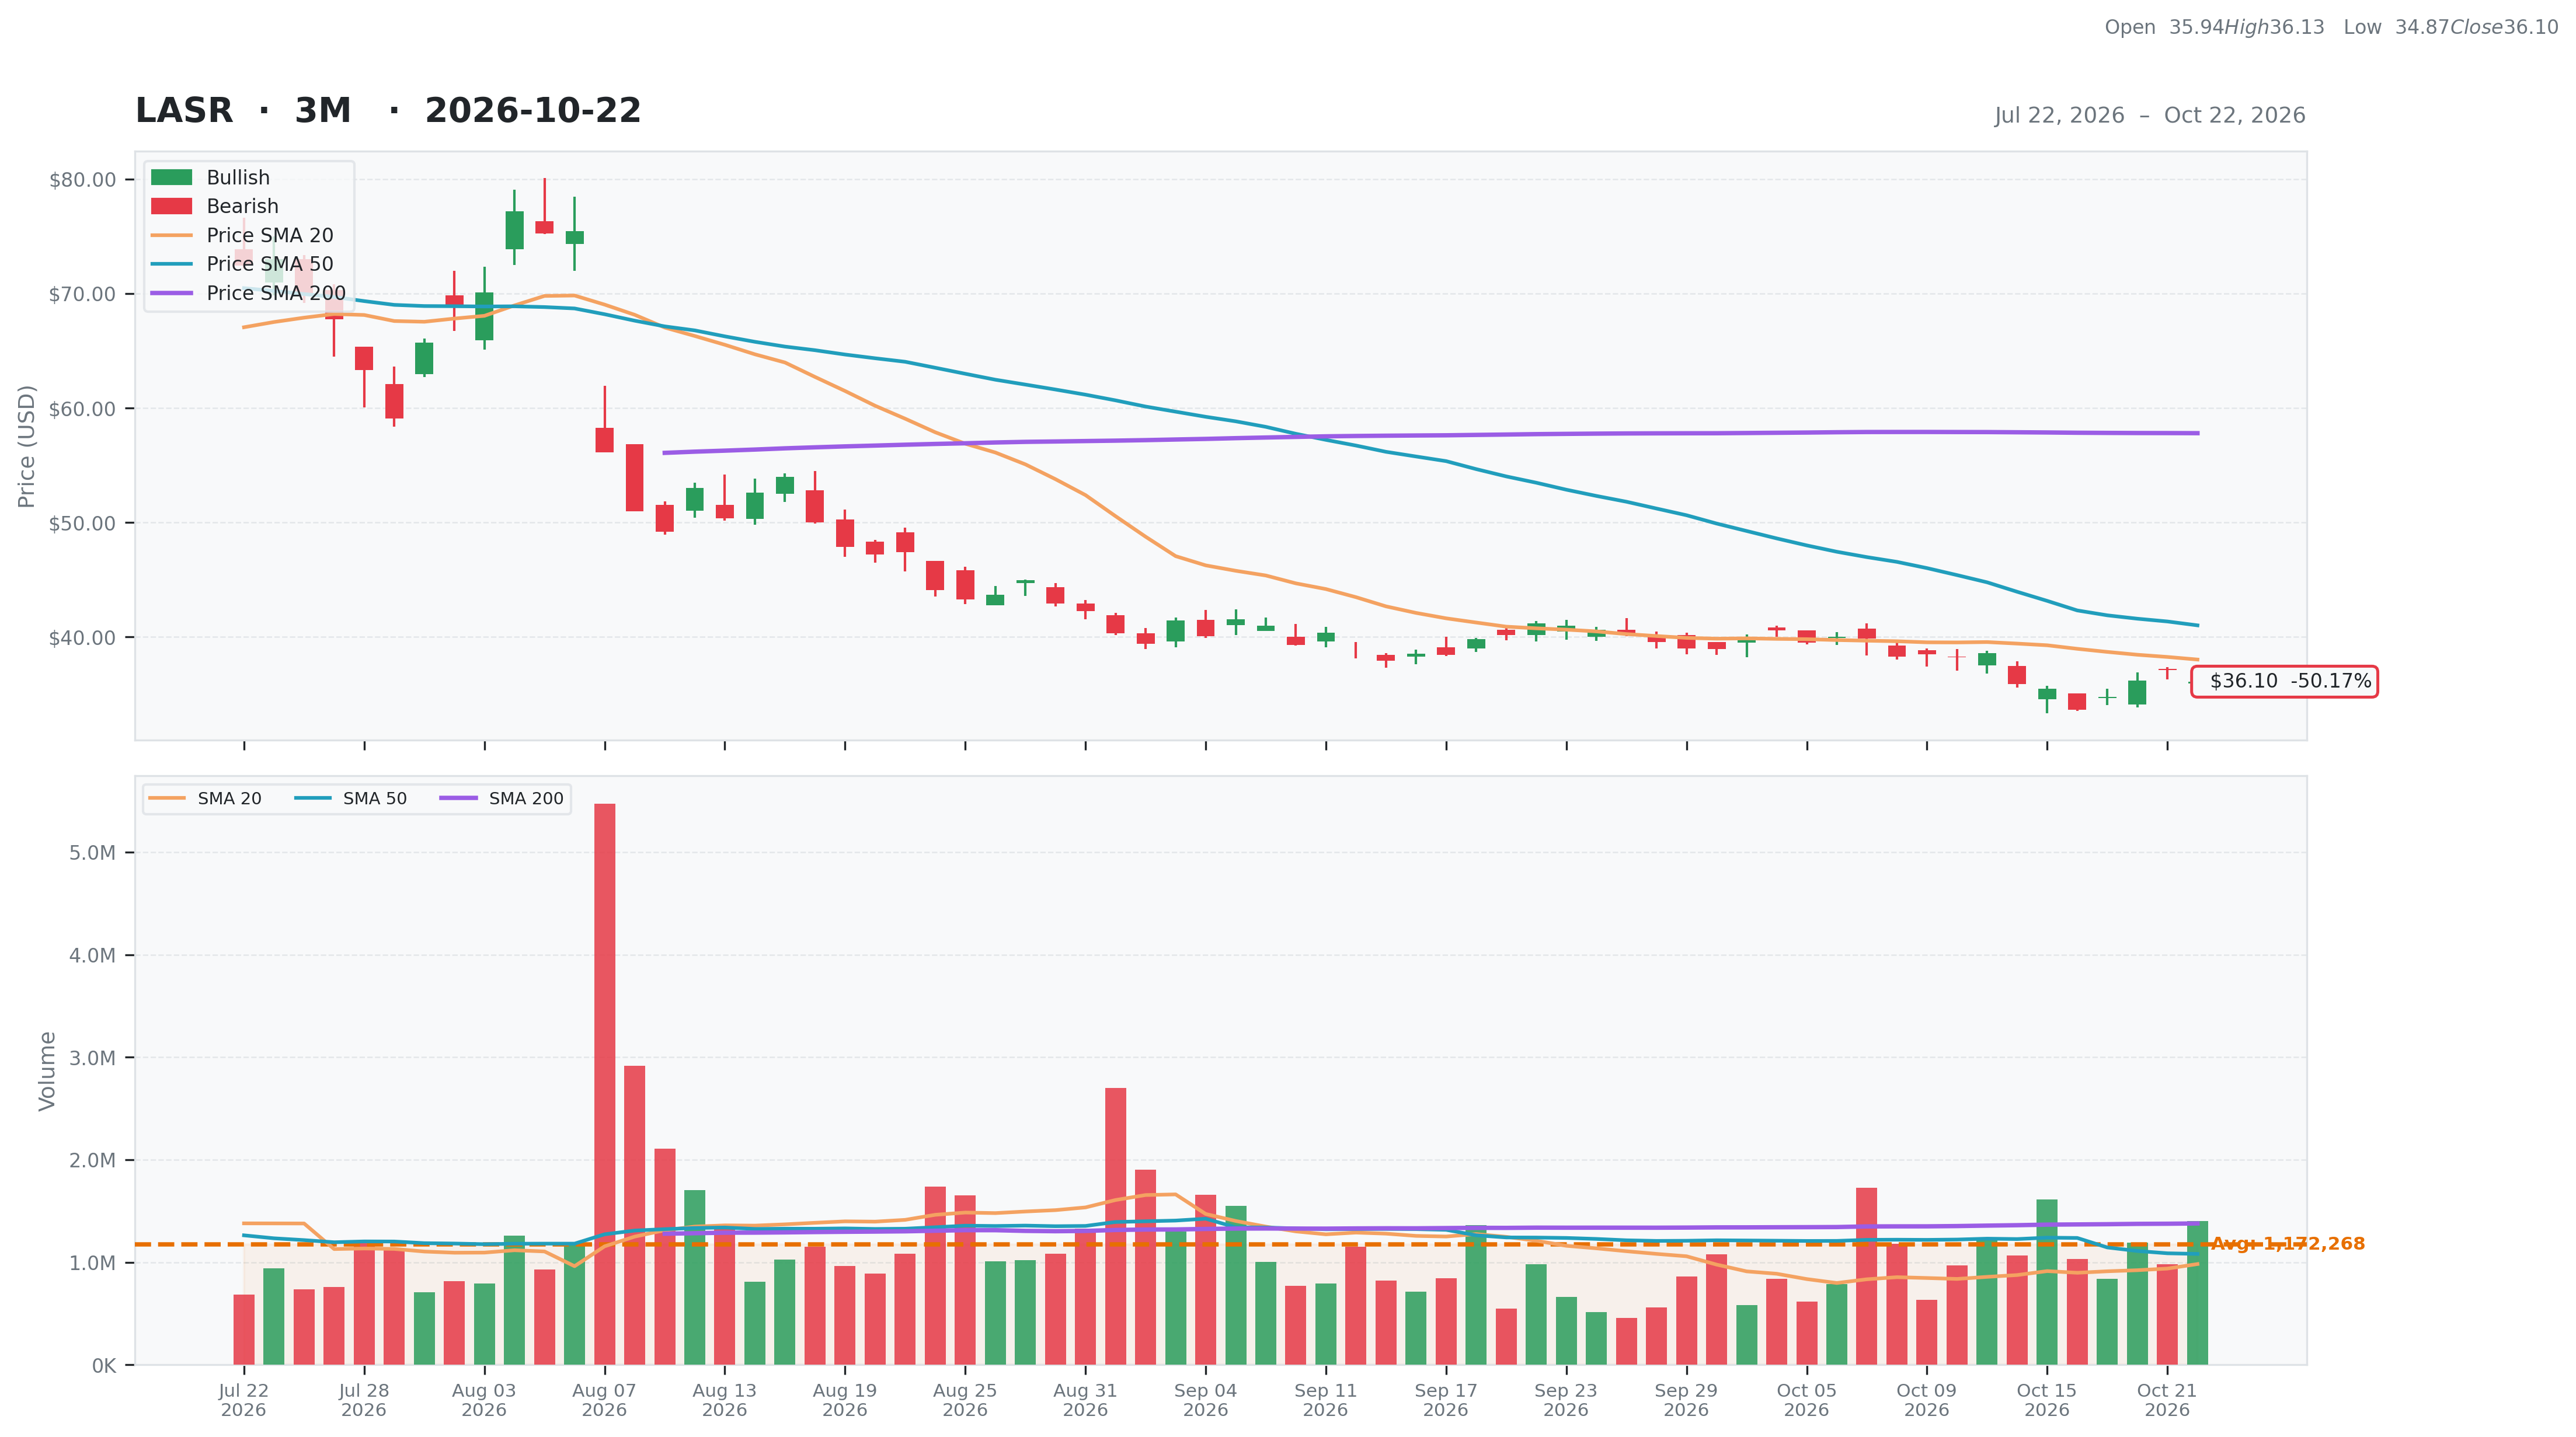
| Total | 34 | Current | $36.10 | 52W High | $84.95 -57.50% | Relative Strength | -0.32 | Beta | 2.37 |
| Business Quality | 4 | Weekly | $35.48 1.75% | 52W Low | $28.60 26.22% | 3M | -0.48 | Short % | 0.05 |
| Financial Strength | 18 | Monthly | $41.20 -12.38% | Above 50DMA | $41.02 -11.99% | 6M | -0.51 | Risk Score | 10 |
| Growth Outlook | 1 | Quarterly | $70.02 -48.44% | Above 200DMA | $57.81 -37.55% | 9M | -0.25 | ||
| Momentum | 3 | Yearly | $33.53 7.66% | 12M | 0.11 | ||||
| Valuation | Financial Strength | Growth/Profitability | |||
|---|---|---|---|---|---|
| Trailing P/E | N/A | Cash | 330M | Revenue Growth | 0.34% |
| Forward P/E | 53.02 | Debt | 15M | Earnings Growth | N/A |
| PEG Ratio | 1.78 | Debt/Equity | 3.37 | Qtr Earnings Growth | N/A |
| Price/Sales | 6.25 | Current Ratio | 8.17 | Gross Margin | 0.32% |
| Price/Book | 4.41 | Quick Ratio | 7.18 | Operating Margin | -0.04% |
| EV/Revenue | 5.24 | Operating CF | 53M | Profit Margin | -0.04% |
| EV/EBITDA | -3,453.98 | Free CF | 43M | EBITDA Margin | 0.00% |
| Ent Value | 1,627M | Return on Assets | -0.02% | ||
| Return on Equity | -0.04% | ||||
| Technical | Volume & Bollinger Bands | Analyst | |||
|---|---|---|---|---|---|
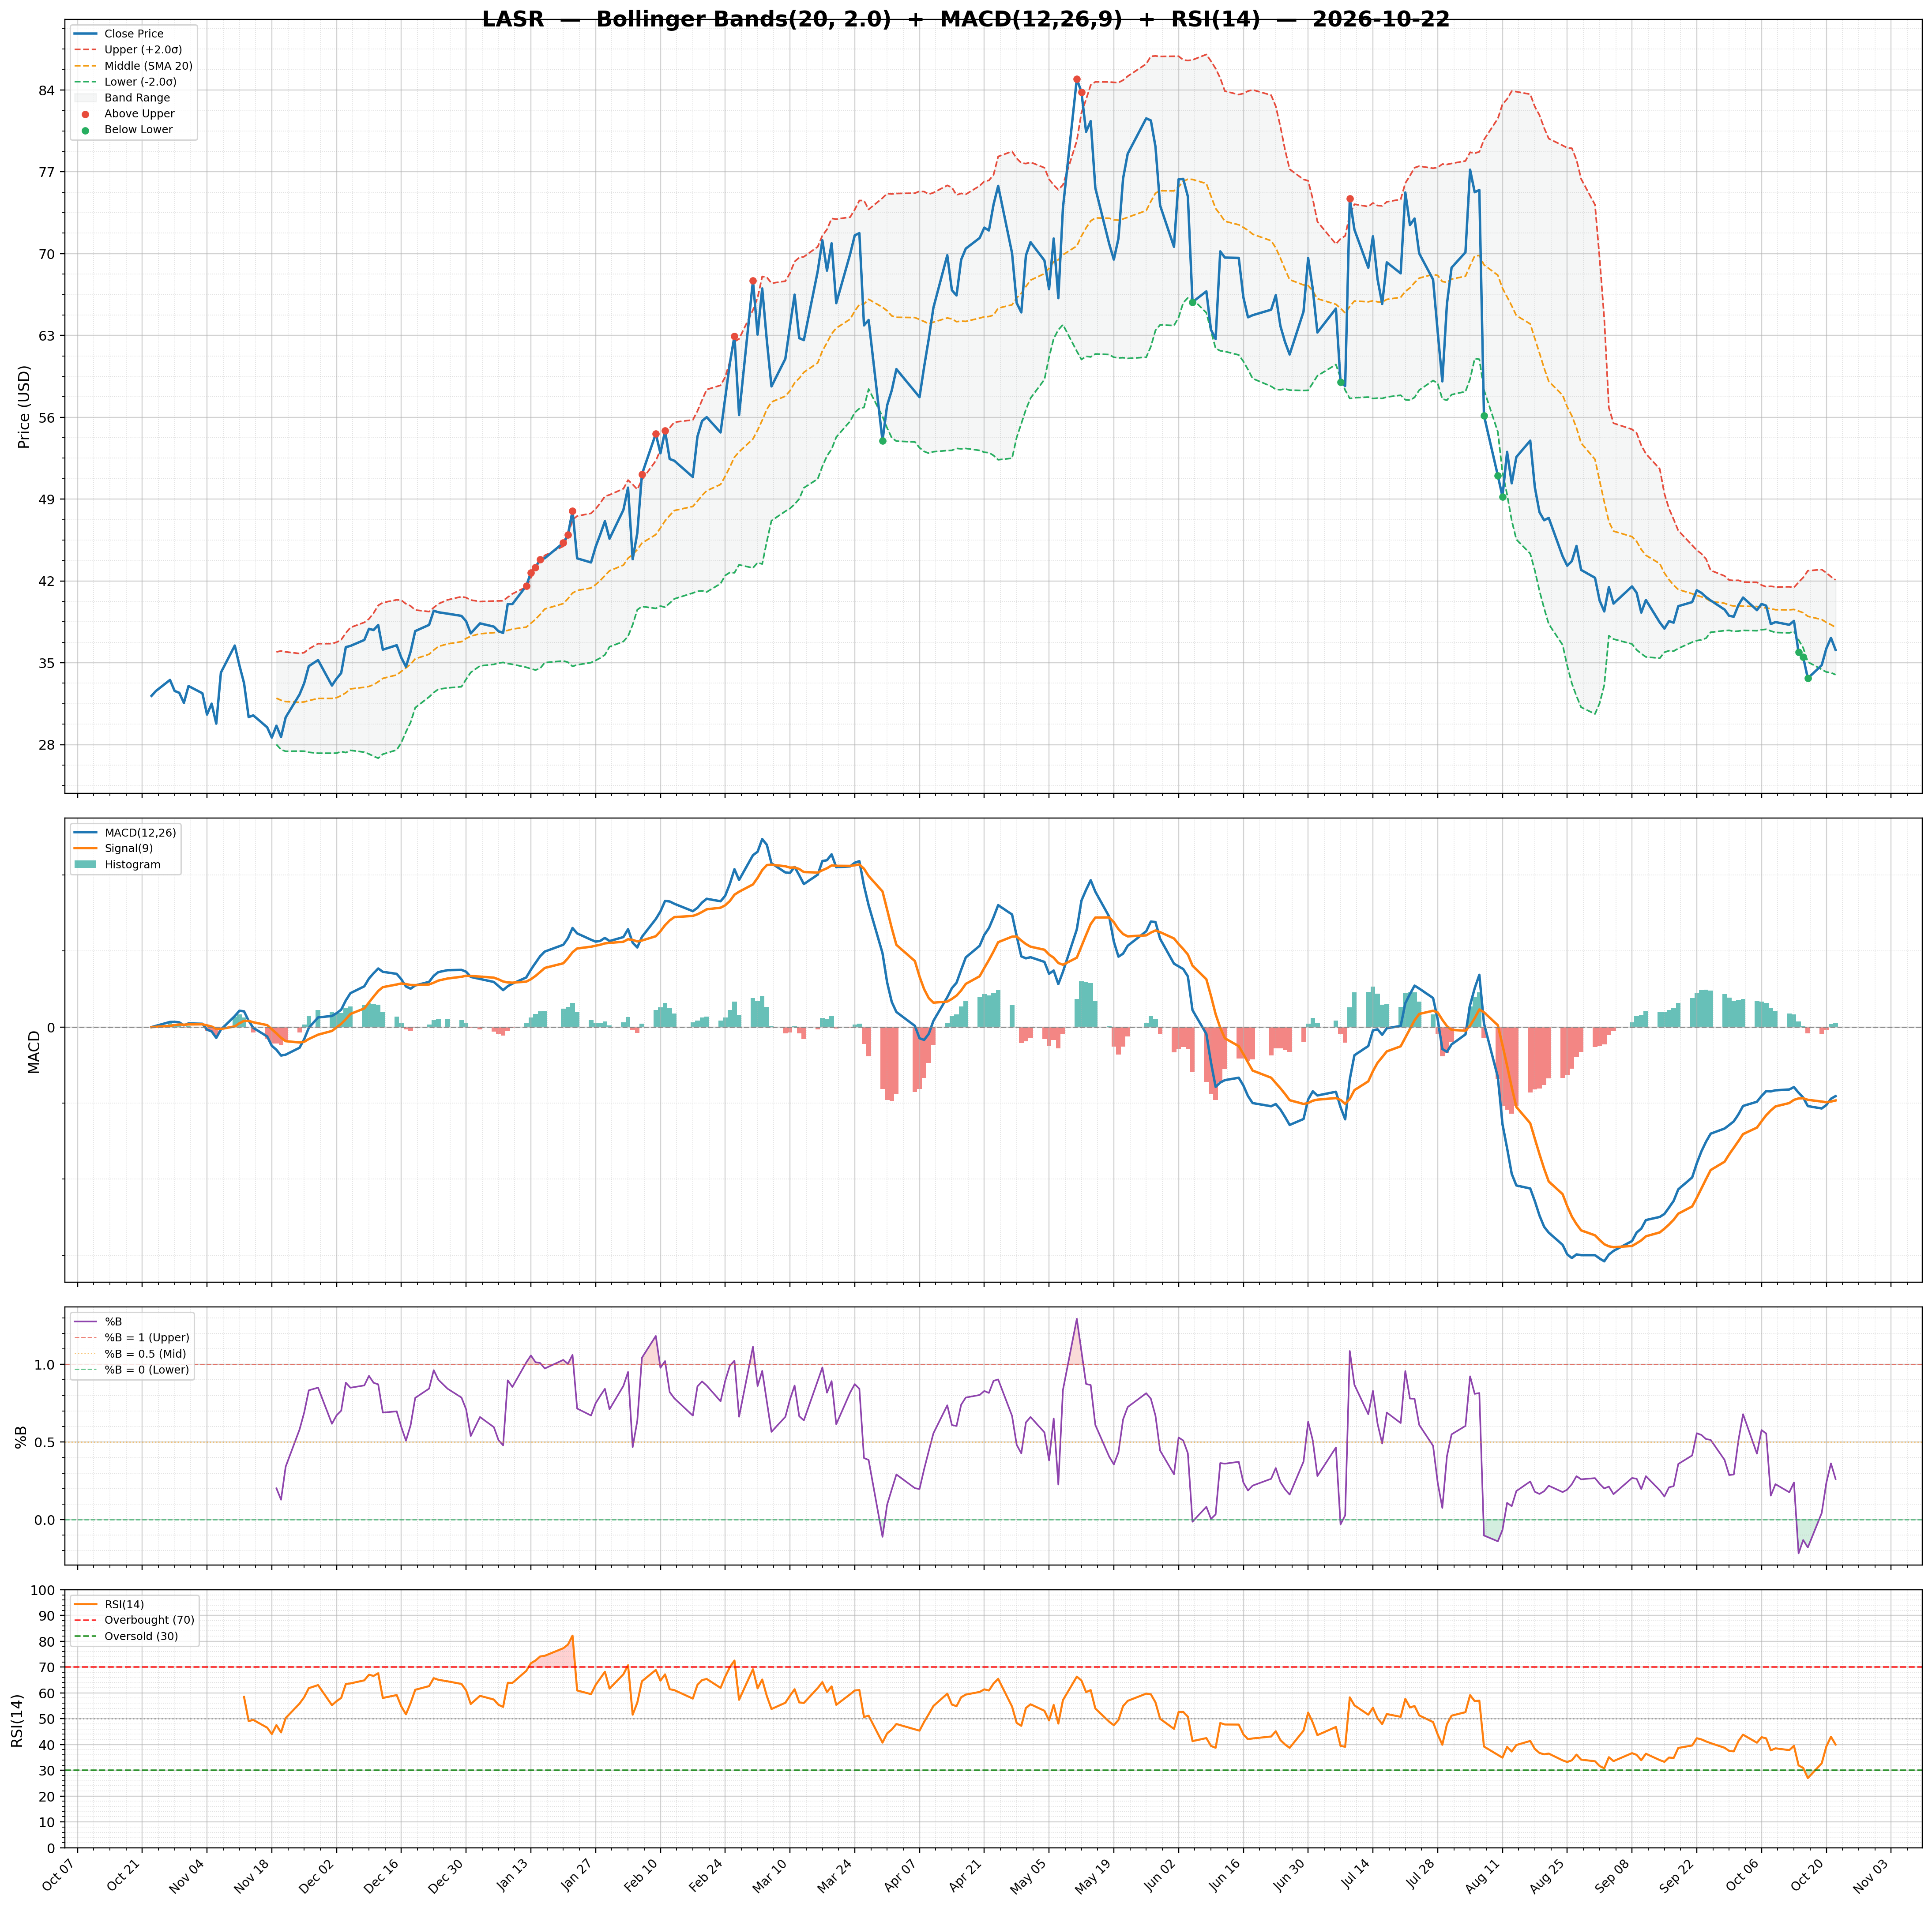
| RSI | 39.97 | Volume | 1.03M | Rating | strong_buy |
| Previous RSI | 43.01 | Avg Volume 20D | 0.98M | Target Mean | $82.12 |
| RSI Trend | Down | Relative Volume | 1.50 | Target High | $100.00 |
| MACD | -1.82 | Lower Band | 33.98 | Target Low | $55.00 |
| MACD Signal | -1.93 | Middle Band | 38.03 | Target Median | $83.00 |
| Histogram | 0.12 | Upper Band | 42.09 | Analysts | 8 |
| Previous Histogram | 0.07 | Bandwidth | 21.330 | Upside | 143.91% |
| Histogram Trend | Increasing | %B | 0.26 | ||