L3Harris Technologies, Inc. (LHX)
Industrials • Aerospace & Defense • $254.23 • MCap: 46,276,194,304
https://www.l3harris.com • L3Harris Technologies, Inc. provides mission-critical solutions for government and commercial customers worldwide. It operates through three segments: Space & Mission Systems (SMS), Communications & Spectrum Dominance (CSD), and Missile Solutions (MSL). The SMS segment integrates satellite and payload capabilities, including missile warning and defense, with maritime, air special missions, and other global defense and civil government programs. Its MSL segment unites propulsion, hypersonic, and other advanced missile technologies. The CSD segment provides tactical radios, software, waveforms, satellite terminals, and end-to-end battlefield systems for the U.S. Department of Defense, international, federal, and state agency customers; broadband communications; integrated vision solutions, such as helmet-mounted integrated night vision goggles with image intensifier tubes and weapon-mounted sights, aiming lasers, and range finders; and public safety radios and system applications and equipment. The company was formerly known as Harris Corporation and changed its name to L3Harris Technologies, Inc. in June 2019. L3Harris Technologies, Inc. was founded in 1895 and is headquartered in Melbourne, Florida.
RND_10_7_2026
Notes
10/07/2026
Discounted Cash Flow (DCF) models place LHX’s fair value between $311 and $343, indicating the stock is 20% to 45% undervalued at current levels.
10/07/2026
Google recomendation is BUY
10/07/2026
It is -36.64% below its 52w h of $373.85
10/07/2026
Vol is not talking
| Score | Price | 52 Week & Averages | Relative Strength | Risk | |||||
|---|---|---|---|---|---|---|---|---|---|
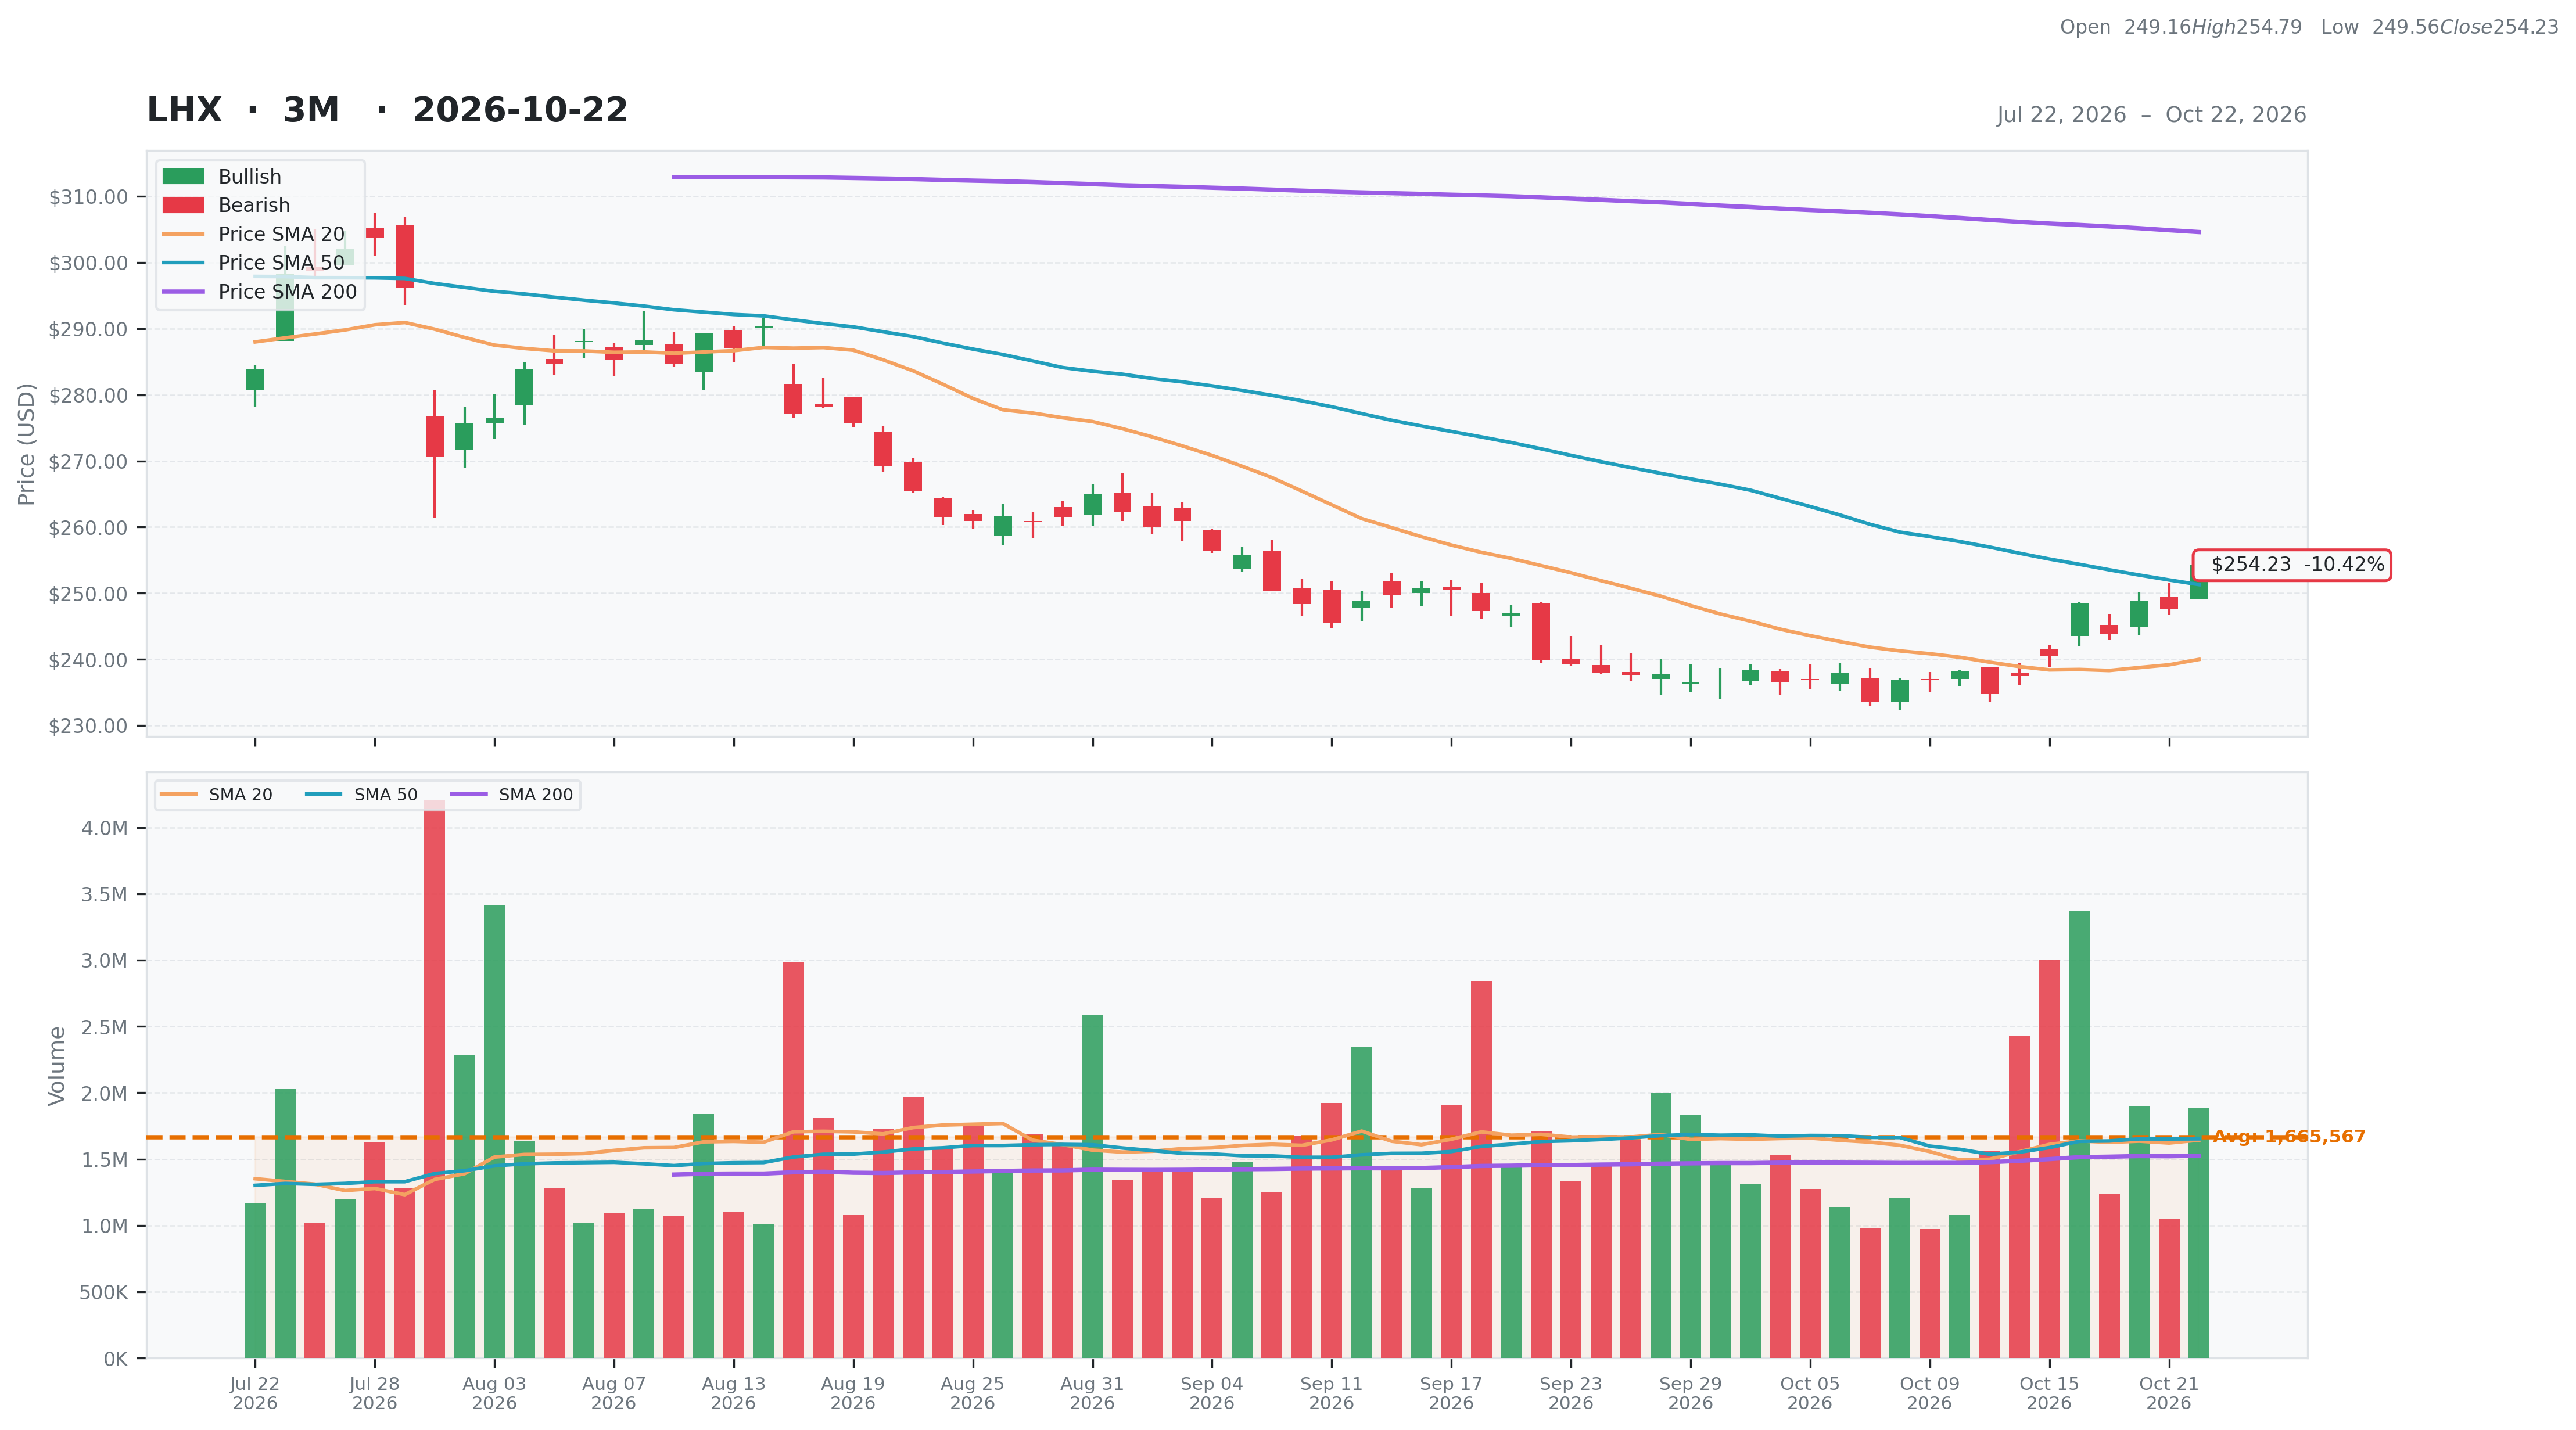
| Total | 58 | Current | $254.23 | 52W High | $373.85 -32.00% | Relative Strength | -0.18 | Beta | 0.50 |
| Business Quality | 11 | Weekly | $240.50 5.71% | 52W Low | $233.63 8.82% | 3M | -0.15 | Short % | 0.03 |
| Financial Strength | 10 | Monthly | $239.89 5.98% | Above 50DMA | $251.31 1.16% | 6M | -0.22 | Risk Score | 6 |
| Growth Outlook | 15 | Quarterly | $298.78 -14.91% | Above 200DMA | $304.60 -16.54% | 9M | -0.28 | ||
| Momentum | 3 | Yearly | $286.39 -11.23% | 12M | -0.12 | ||||
| Valuation | Financial Strength | Growth/Profitability | |||
|---|---|---|---|---|---|
| Trailing P/E | 25.05 | Cash | 1,521M | Revenue Growth | 0.08% |
| Forward P/E | 18.38 | Debt | 10,999M | Earnings Growth | 0.28% |
| PEG Ratio | 1.20 | Debt/Equity | 52.75 | Qtr Earnings Growth | 0.31% |
| Price/Sales | 2.02 | Current Ratio | 1.18 | Gross Margin | 0.25% |
| Price/Book | 2.33 | Quick Ratio | 0.84 | Operating Margin | 0.13% |
| EV/Revenue | 2.52 | Operating CF | 3,292M | Profit Margin | 0.08% |
| EV/EBITDA | 13.93 | Free CF | 1,609M | EBITDA Margin | 0.18% |
| Ent Value | 57,690M | Return on Assets | 0.04% | ||
| Return on Equity | 0.09% | ||||
| Technical | Volume & Bollinger Bands | Analyst | |||
|---|---|---|---|---|---|
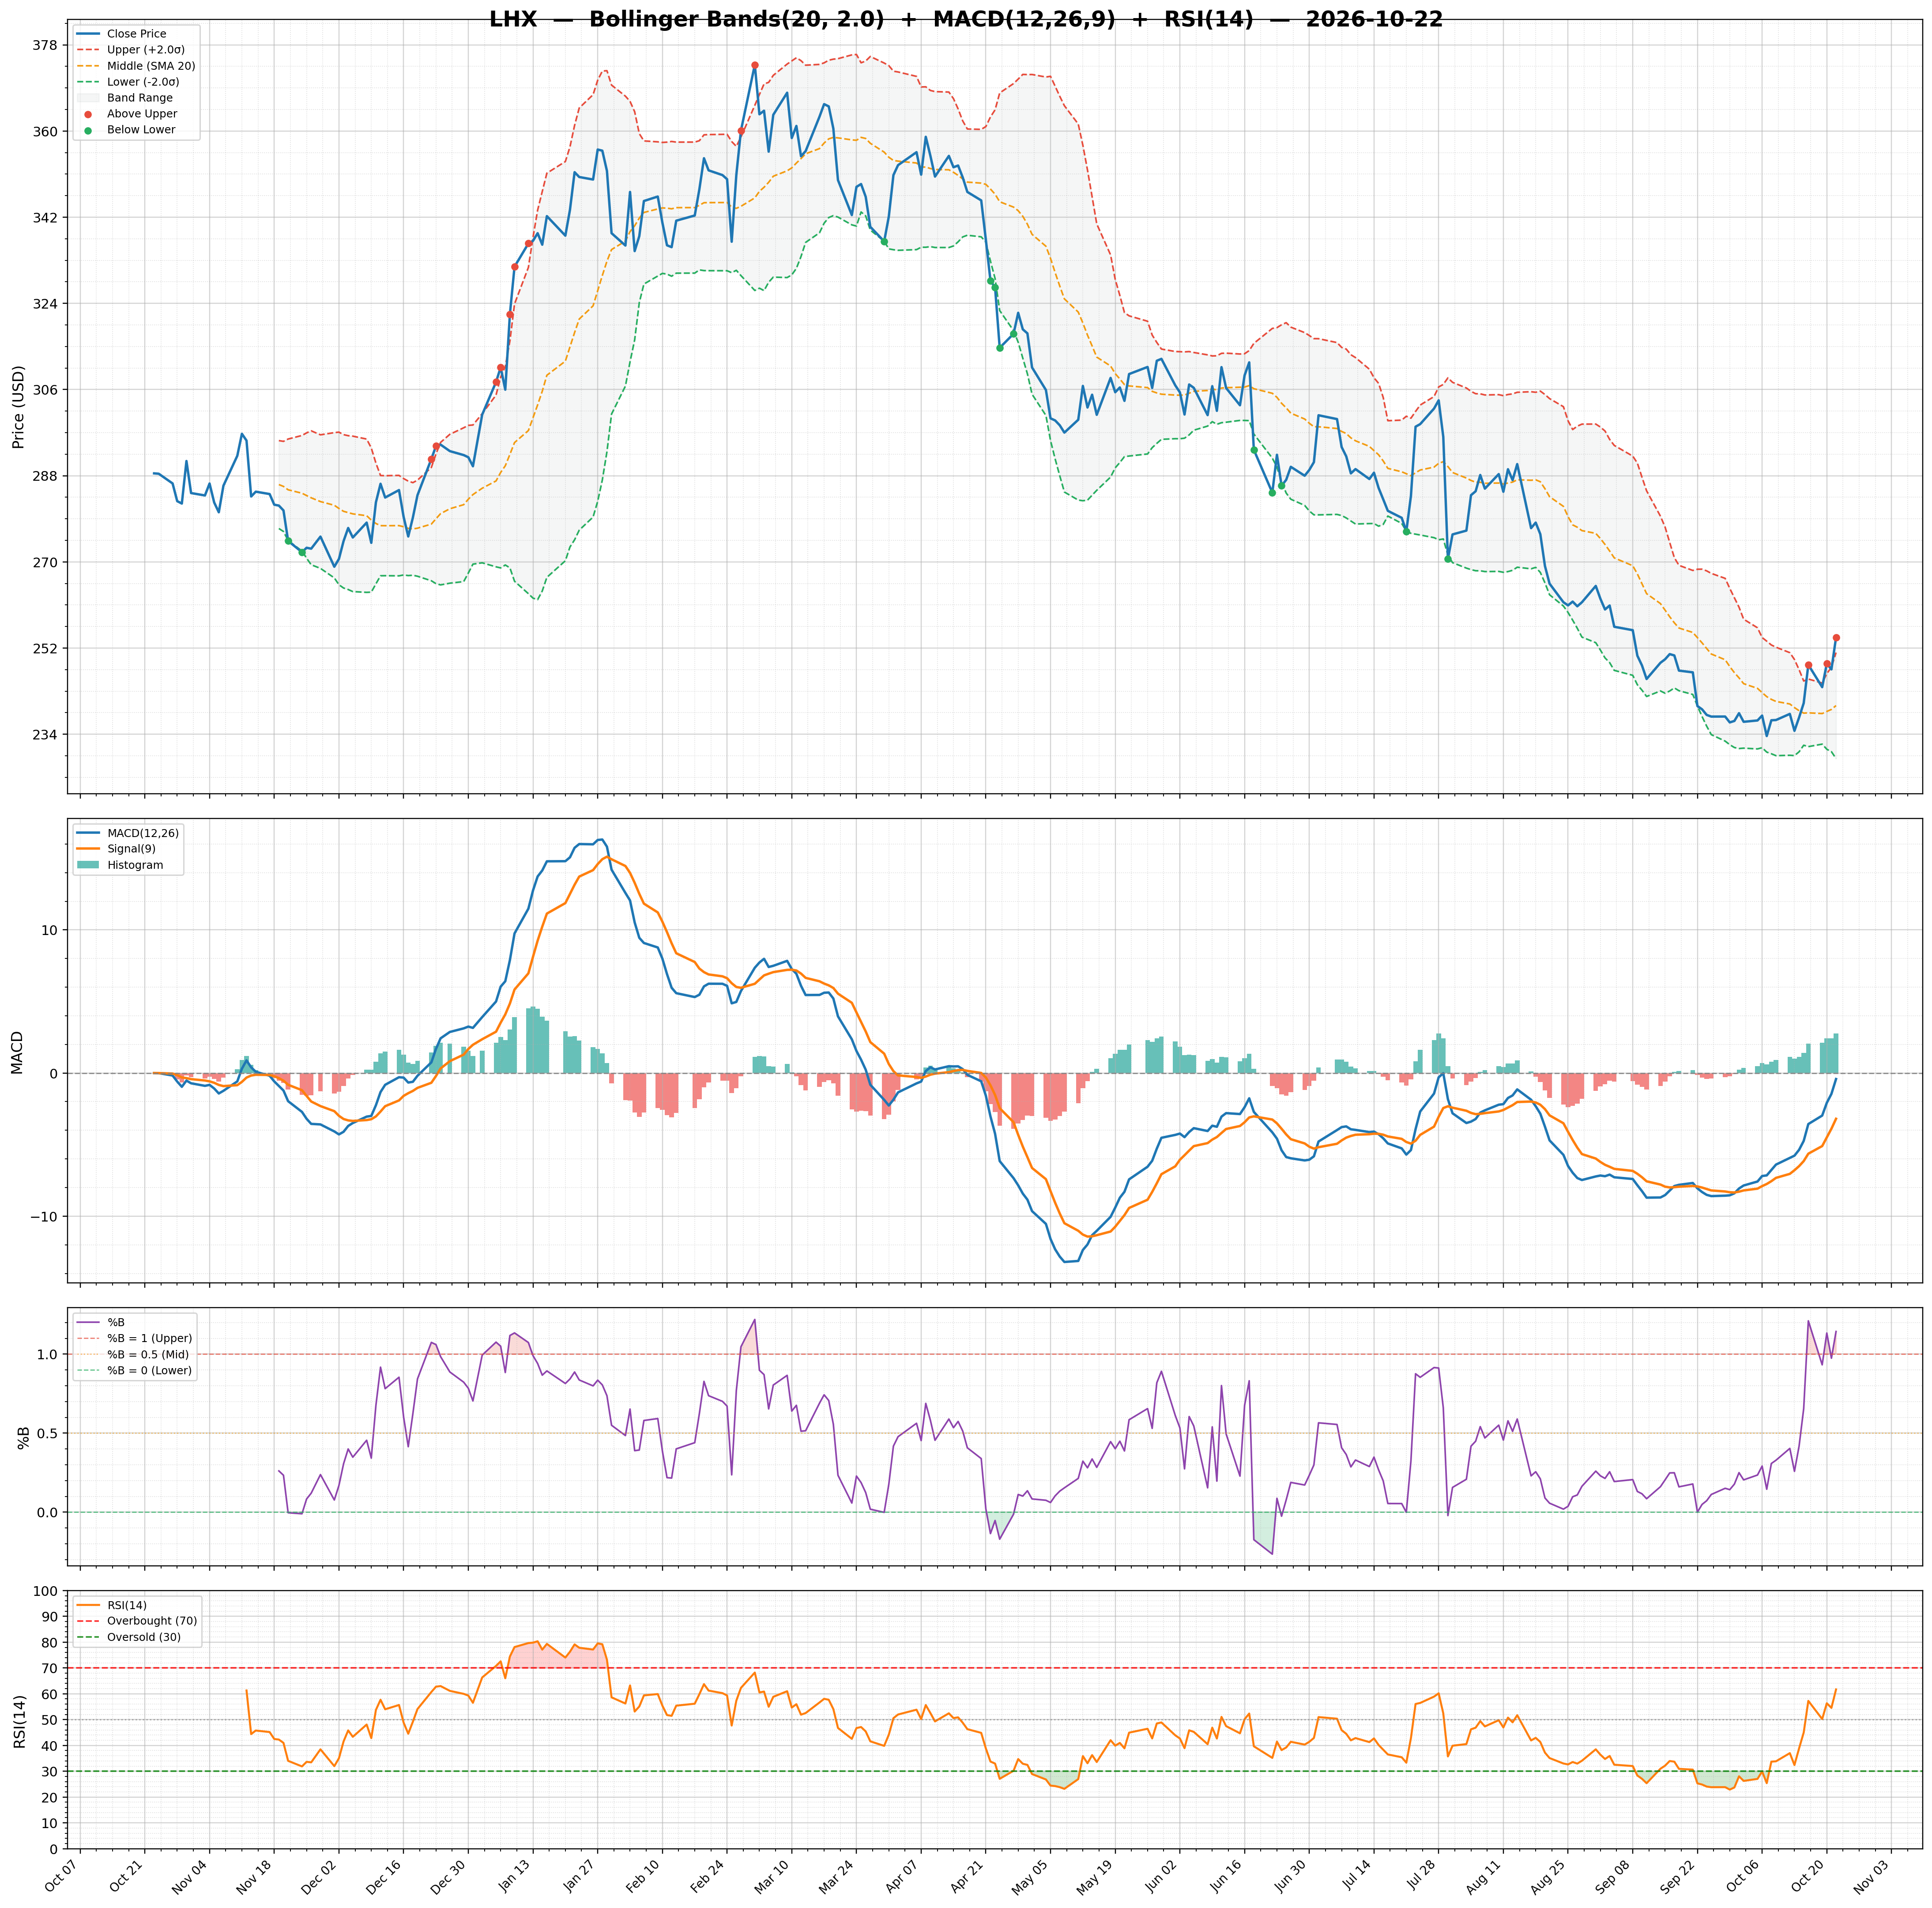
| RSI | 61.69 | Volume | 3.37M | Rating | buy |
| Previous RSI | 54.54 | Avg Volume 20D | 1.64M | Target Mean | $316.65 |
| RSI Trend | Up | Relative Volume | 1.12 | Target High | $393.00 |
| MACD | -0.42 | Lower Band | 228.92 | Target Low | $241.00 |
| MACD Signal | -3.20 | Middle Band | 239.99 | Target Median | $325.00 |
| Histogram | 2.78 | Upper Band | 251.06 | Analysts | 17 |
| Previous Histogram | 2.43 | Bandwidth | 9.220 | Upside | 27.42% |
| Histogram Trend | Increasing | %B | 1.14 | ||