Limbach Holdings, Inc. (LMB)
Industrials • Building Products & Equipment • $47.55 • MCap: 580,627,904
https://www.limbachinc.com • Limbach Holdings, Inc. operates as a building systems solution company in the United States. The company operates through two segments, Owner Direct Relationships and General Contractor Relationships. It designs, delivers, and maintains mechanical, electrical, plumbing, and controls (MEPC) systems. It also provides professional and consultative services; inspection, troubleshooting, repair, and services; system and/or facility assessments; turnkey rental equipment solutions; MEPC infrastructure solutions; and customized solutions. The company serves research, acute care, and inpatient hospitals; public and private colleges, universities, research centers; entertainment facilities, and amusement rides and parks; data centers; automotive, energy and general manufacturing plants; and life sciences, including organizations and companies, whose work is centered around research and development focused on living things. In addition, it also operates as a mission-critical program management and consulting firm, specializes in the planning, management, and delivery of complex data center infrastructure projects. Limbach Holdings, Inc. was founded in 1901 and is headquartered in Tampa, Florida.
Reversal Strategy
Notes
10/23/2026
Hold/Buy on Weakness
| Score | Price | 52 Week & Averages | Relative Strength | Risk | |||||
|---|---|---|---|---|---|---|---|---|---|
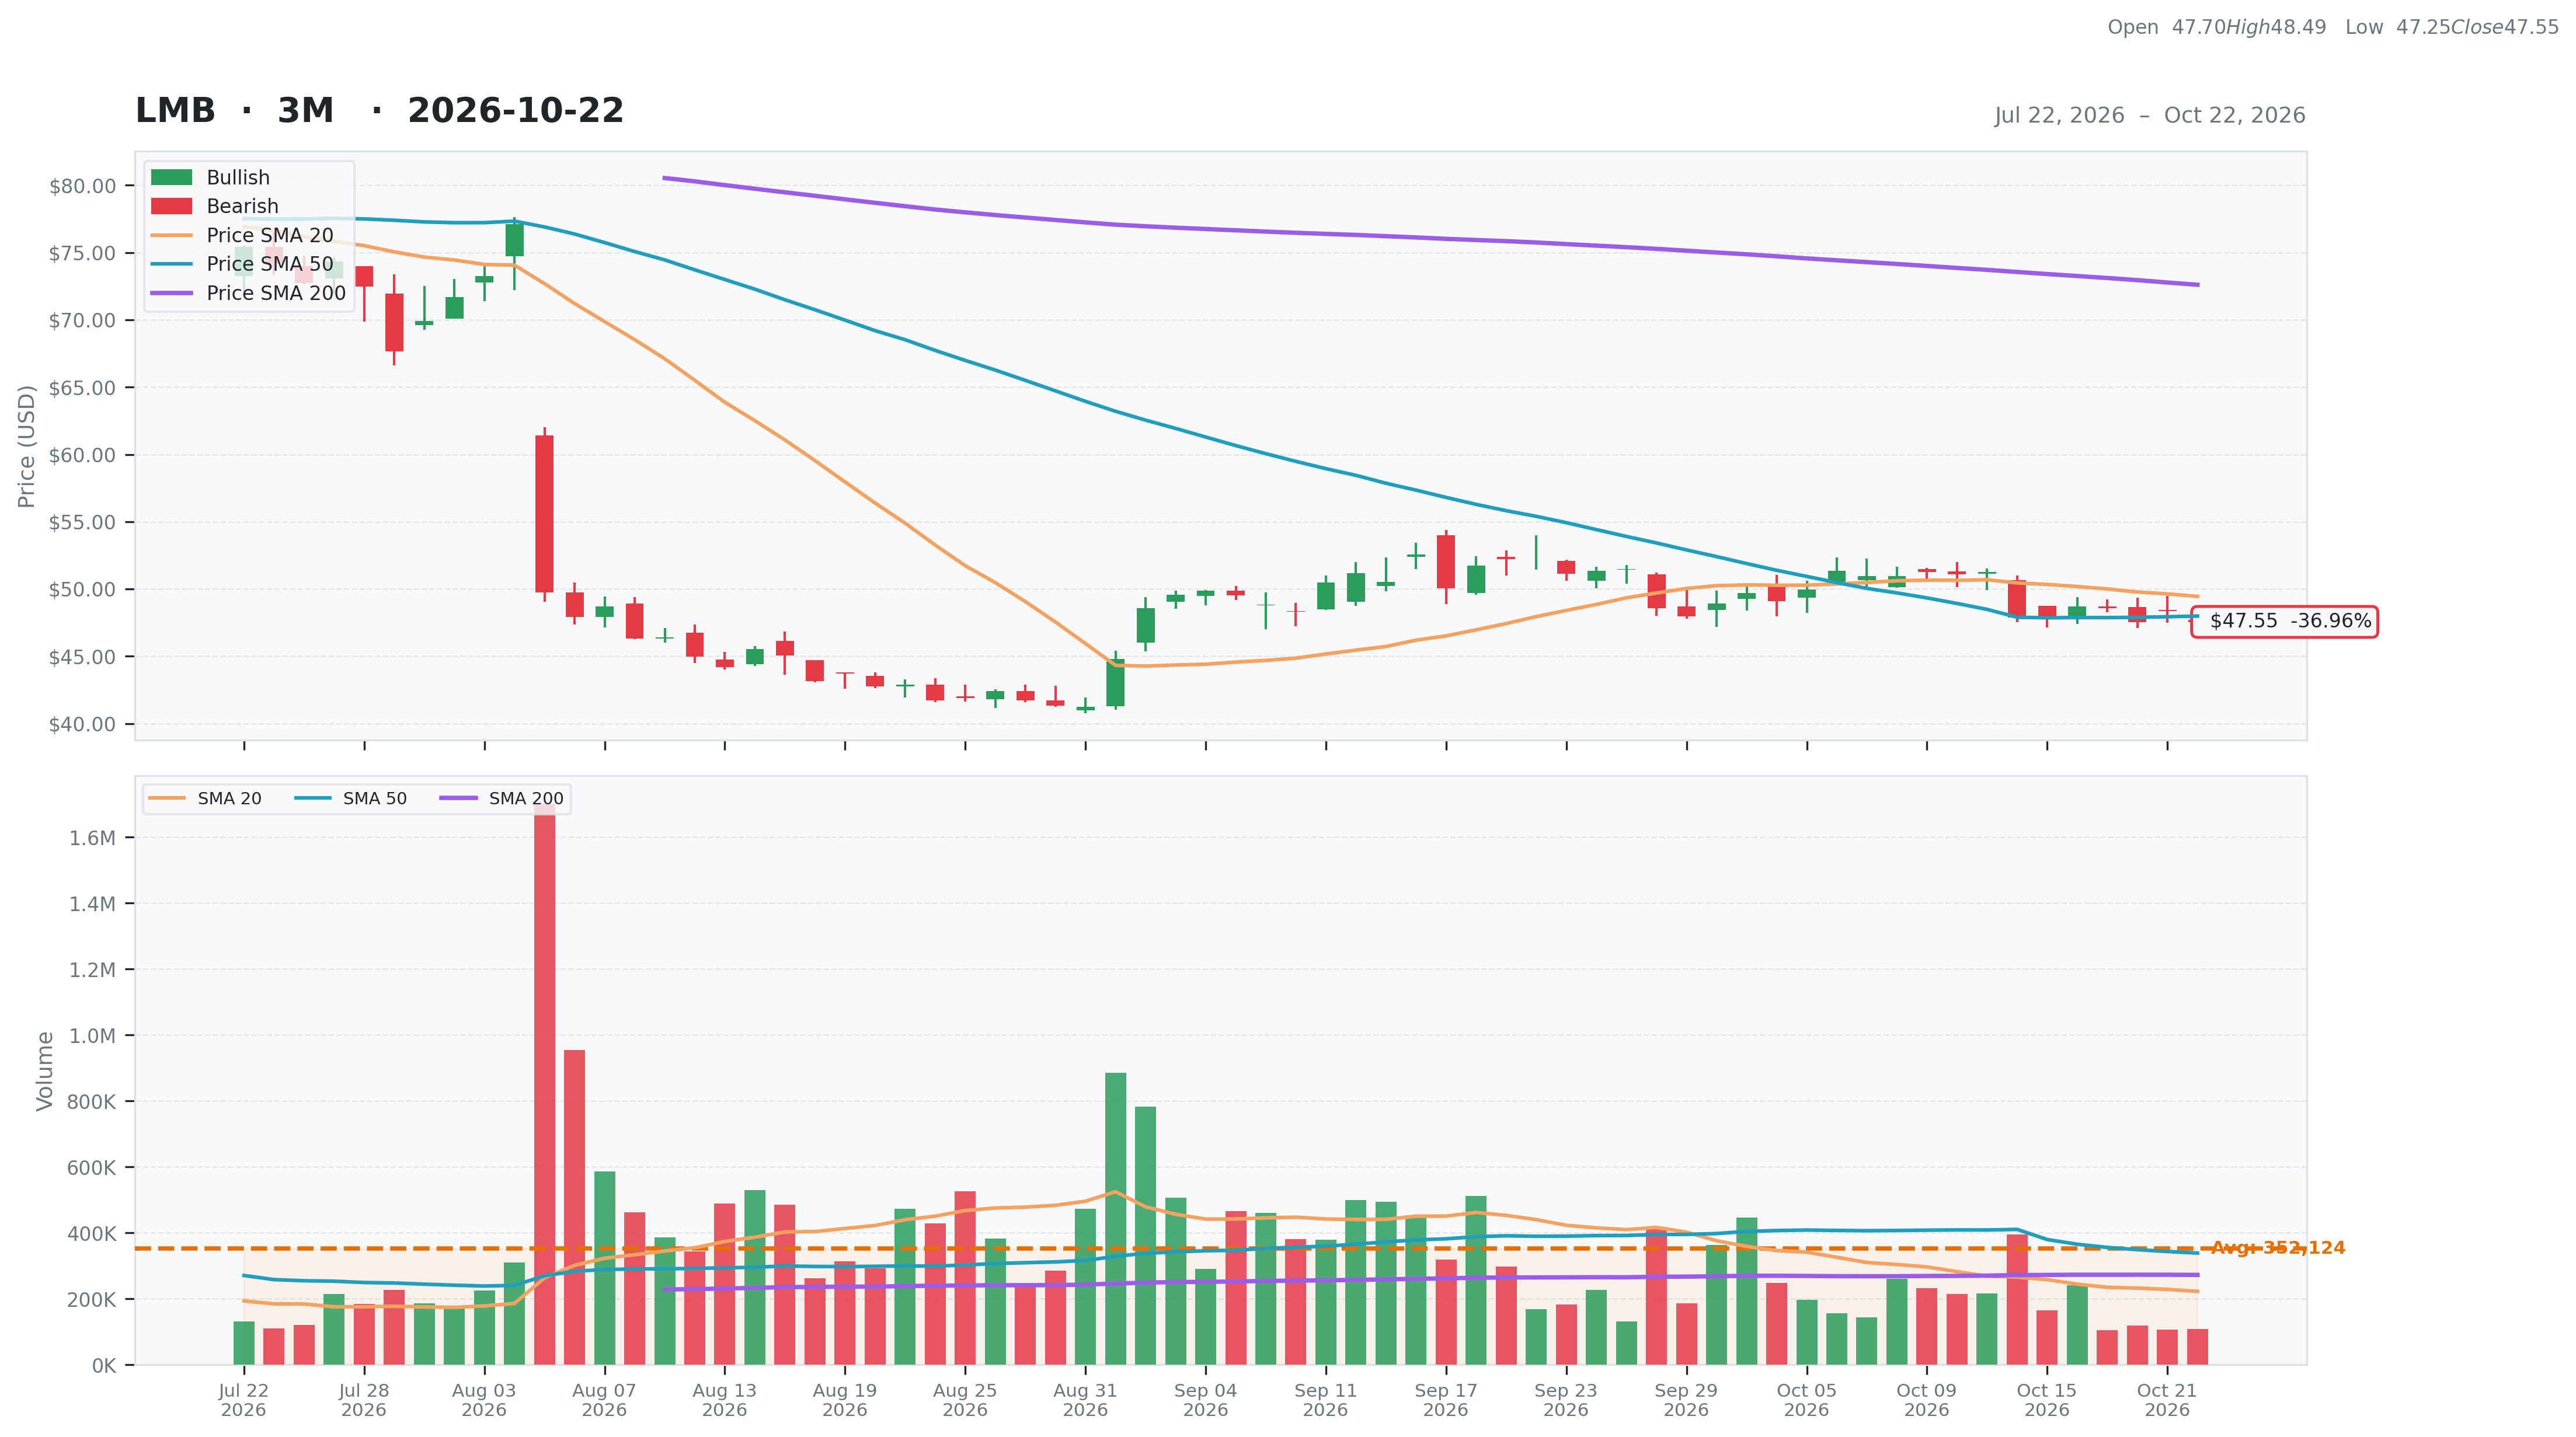
| Total | 48 | Current | $47.55 | 52W High | $114.11 -58.33% | Relative Strength | -0.44 | Beta | 1.32 |
| Business Quality | 4 | Weekly | $47.80 -0.52% | 52W Low | $41.22 15.36% | 3M | -0.35 | Short % | 0.1 |
| Financial Strength | 17 | Monthly | $52.08 -8.70% | Above 50DMA | $47.98 -0.91% | 6M | -0.52 | Risk Score | 5 |
| Growth Outlook | 4 | Quarterly | $72.74 -34.63% | Above 200DMA | $72.61 -34.51% | 9M | -0.45 | ||
| Momentum | 3 | Yearly | $99.18 -52.06% | 12M | -0.53 | ||||
| Valuation | Financial Strength | Growth/Profitability | |||
|---|---|---|---|---|---|
| Trailing P/E | 19.40 | Cash | 18M | Revenue Growth | 0.22% |
| Forward P/E | 10.37 | Debt | 60M | Earnings Growth | -0.39% |
| PEG Ratio | 1.70 | Debt/Equity | 29.33 | Qtr Earnings Growth | -0.39% |
| Price/Sales | 0.85 | Current Ratio | 1.48 | Gross Margin | 0.24% |
| Price/Book | 2.86 | Quick Ratio | 1.40 | Operating Margin | 0.04% |
| EV/Revenue | 0.91 | Operating CF | 52M | Profit Margin | 0.04% |
| EV/EBITDA | 10.50 | Free CF | 38M | EBITDA Margin | 0.09% |
| Ent Value | 623M | Return on Assets | 0.07% | ||
| Return on Equity | 0.16% | ||||
| Technical | Volume & Bollinger Bands | Analyst | |||
|---|---|---|---|---|---|
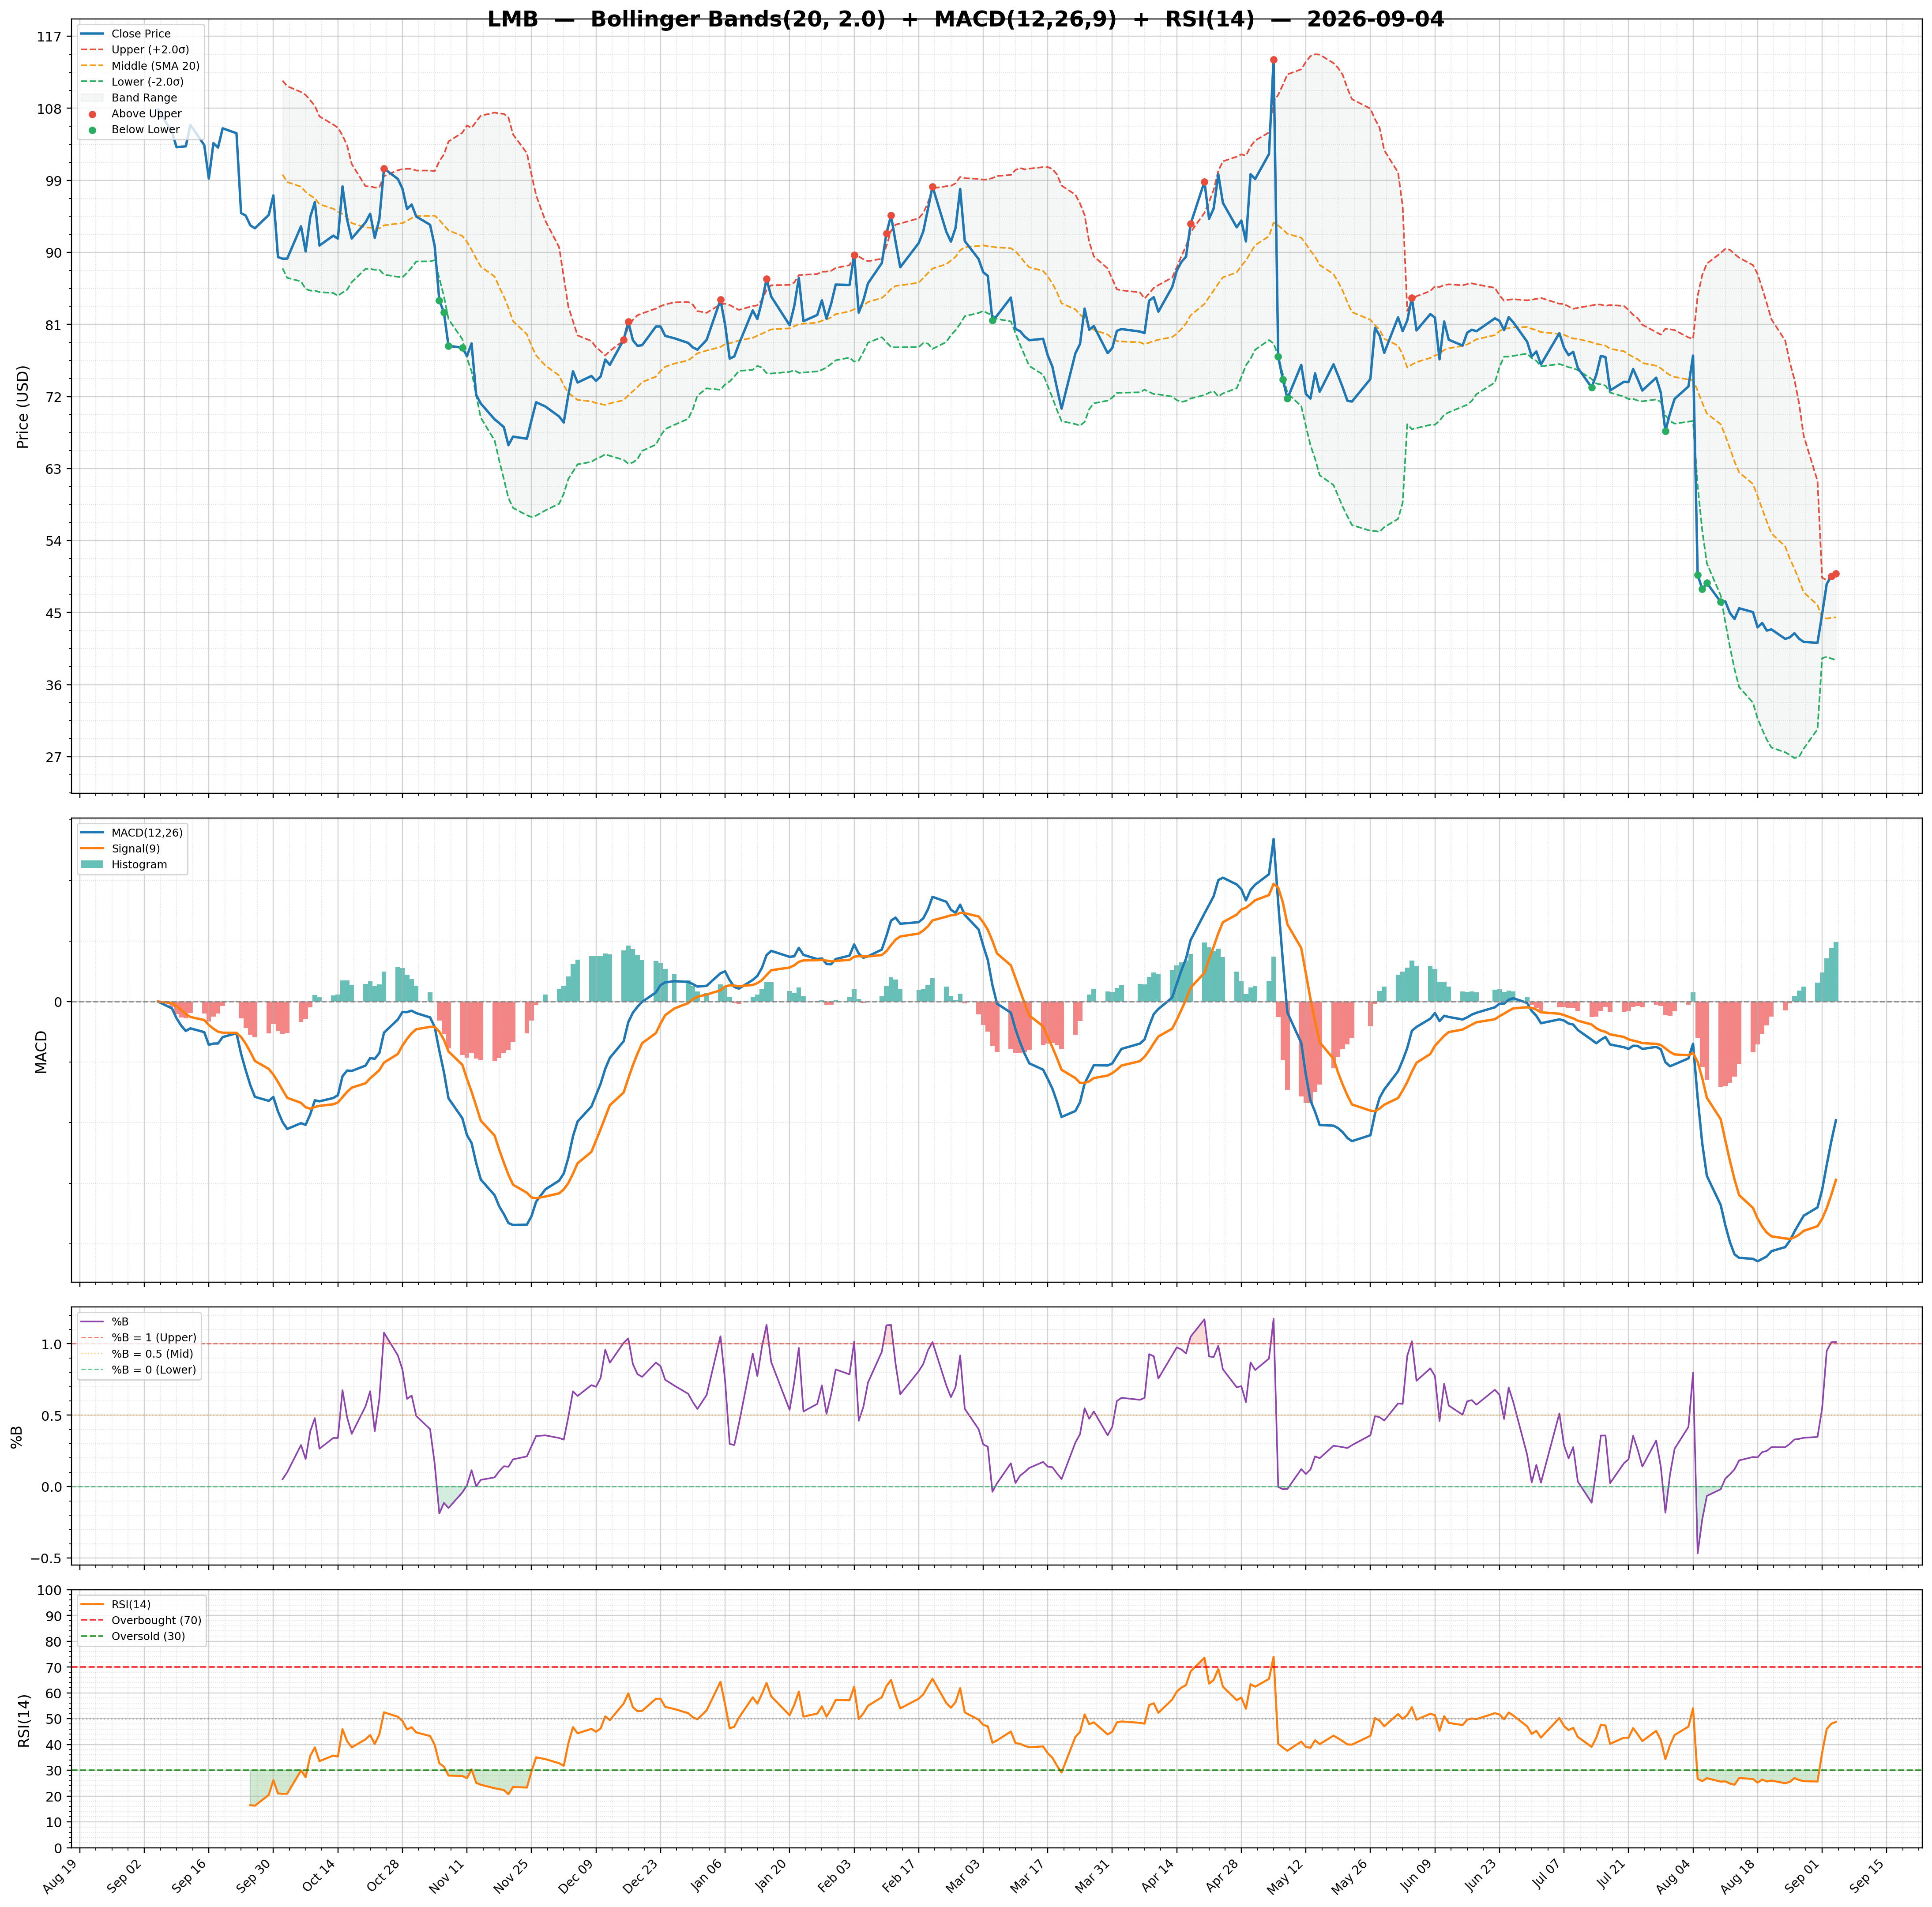
| RSI | 41.53 | Volume | 0.24M | Rating | buy |
| Previous RSI | 44.32 | Avg Volume 20D | 0.22M | Target Mean | $75.00 |
| RSI Trend | Down | Relative Volume | 0.40 | Target High | $95.00 |
| MACD | -0.64 | Lower Band | 46.53 | Target Low | $50.00 |
| MACD Signal | -0.40 | Middle Band | 49.44 | Target Median | $75.00 |
| Histogram | -0.24 | Upper Band | 52.36 | Analysts | 5 |
| Previous Histogram | -0.22 | Bandwidth | 11.780 | Upside | 54.04% |
| Histogram Trend | Decreasing | %B | 0.18 | ||