Lyft, Inc. (LYFT)
Technology • Software - Application • $17.43 • MCap: 6,367,047,168
https://www.lyft.com • Lyft, Inc. operates multimodal transportation networks that offer access to various transportation options through platform and mobile based applications in the United States and internationally. The company facilitates peer-to-peer ridesharing by connecting drivers who have vehicles with riders who need a ride. It also operates Lyft Platform that provides a marketplace where drivers can be matched with riders via the Lyft mobile application. The company's platform provides a ridesharing marketplace that connects drivers with riders; Express Drive, a car rental program for drivers; and a network of shared bikes and scooters in various cities to address the needs of riders for short trips. In addition, it offers licensing and data access agreements; sells bikes and bike station software and hardware; and provides advertising services. The company was formerly known as Zimride, Inc. and changed its name to Lyft, Inc. in April 2013. Lyft, Inc. was incorporated in 2007 and is headquartered in San Francisco, California.
ET
| Score | Price | 52 Week & Averages | Relative Strength | Risk | |||||
|---|---|---|---|---|---|---|---|---|---|
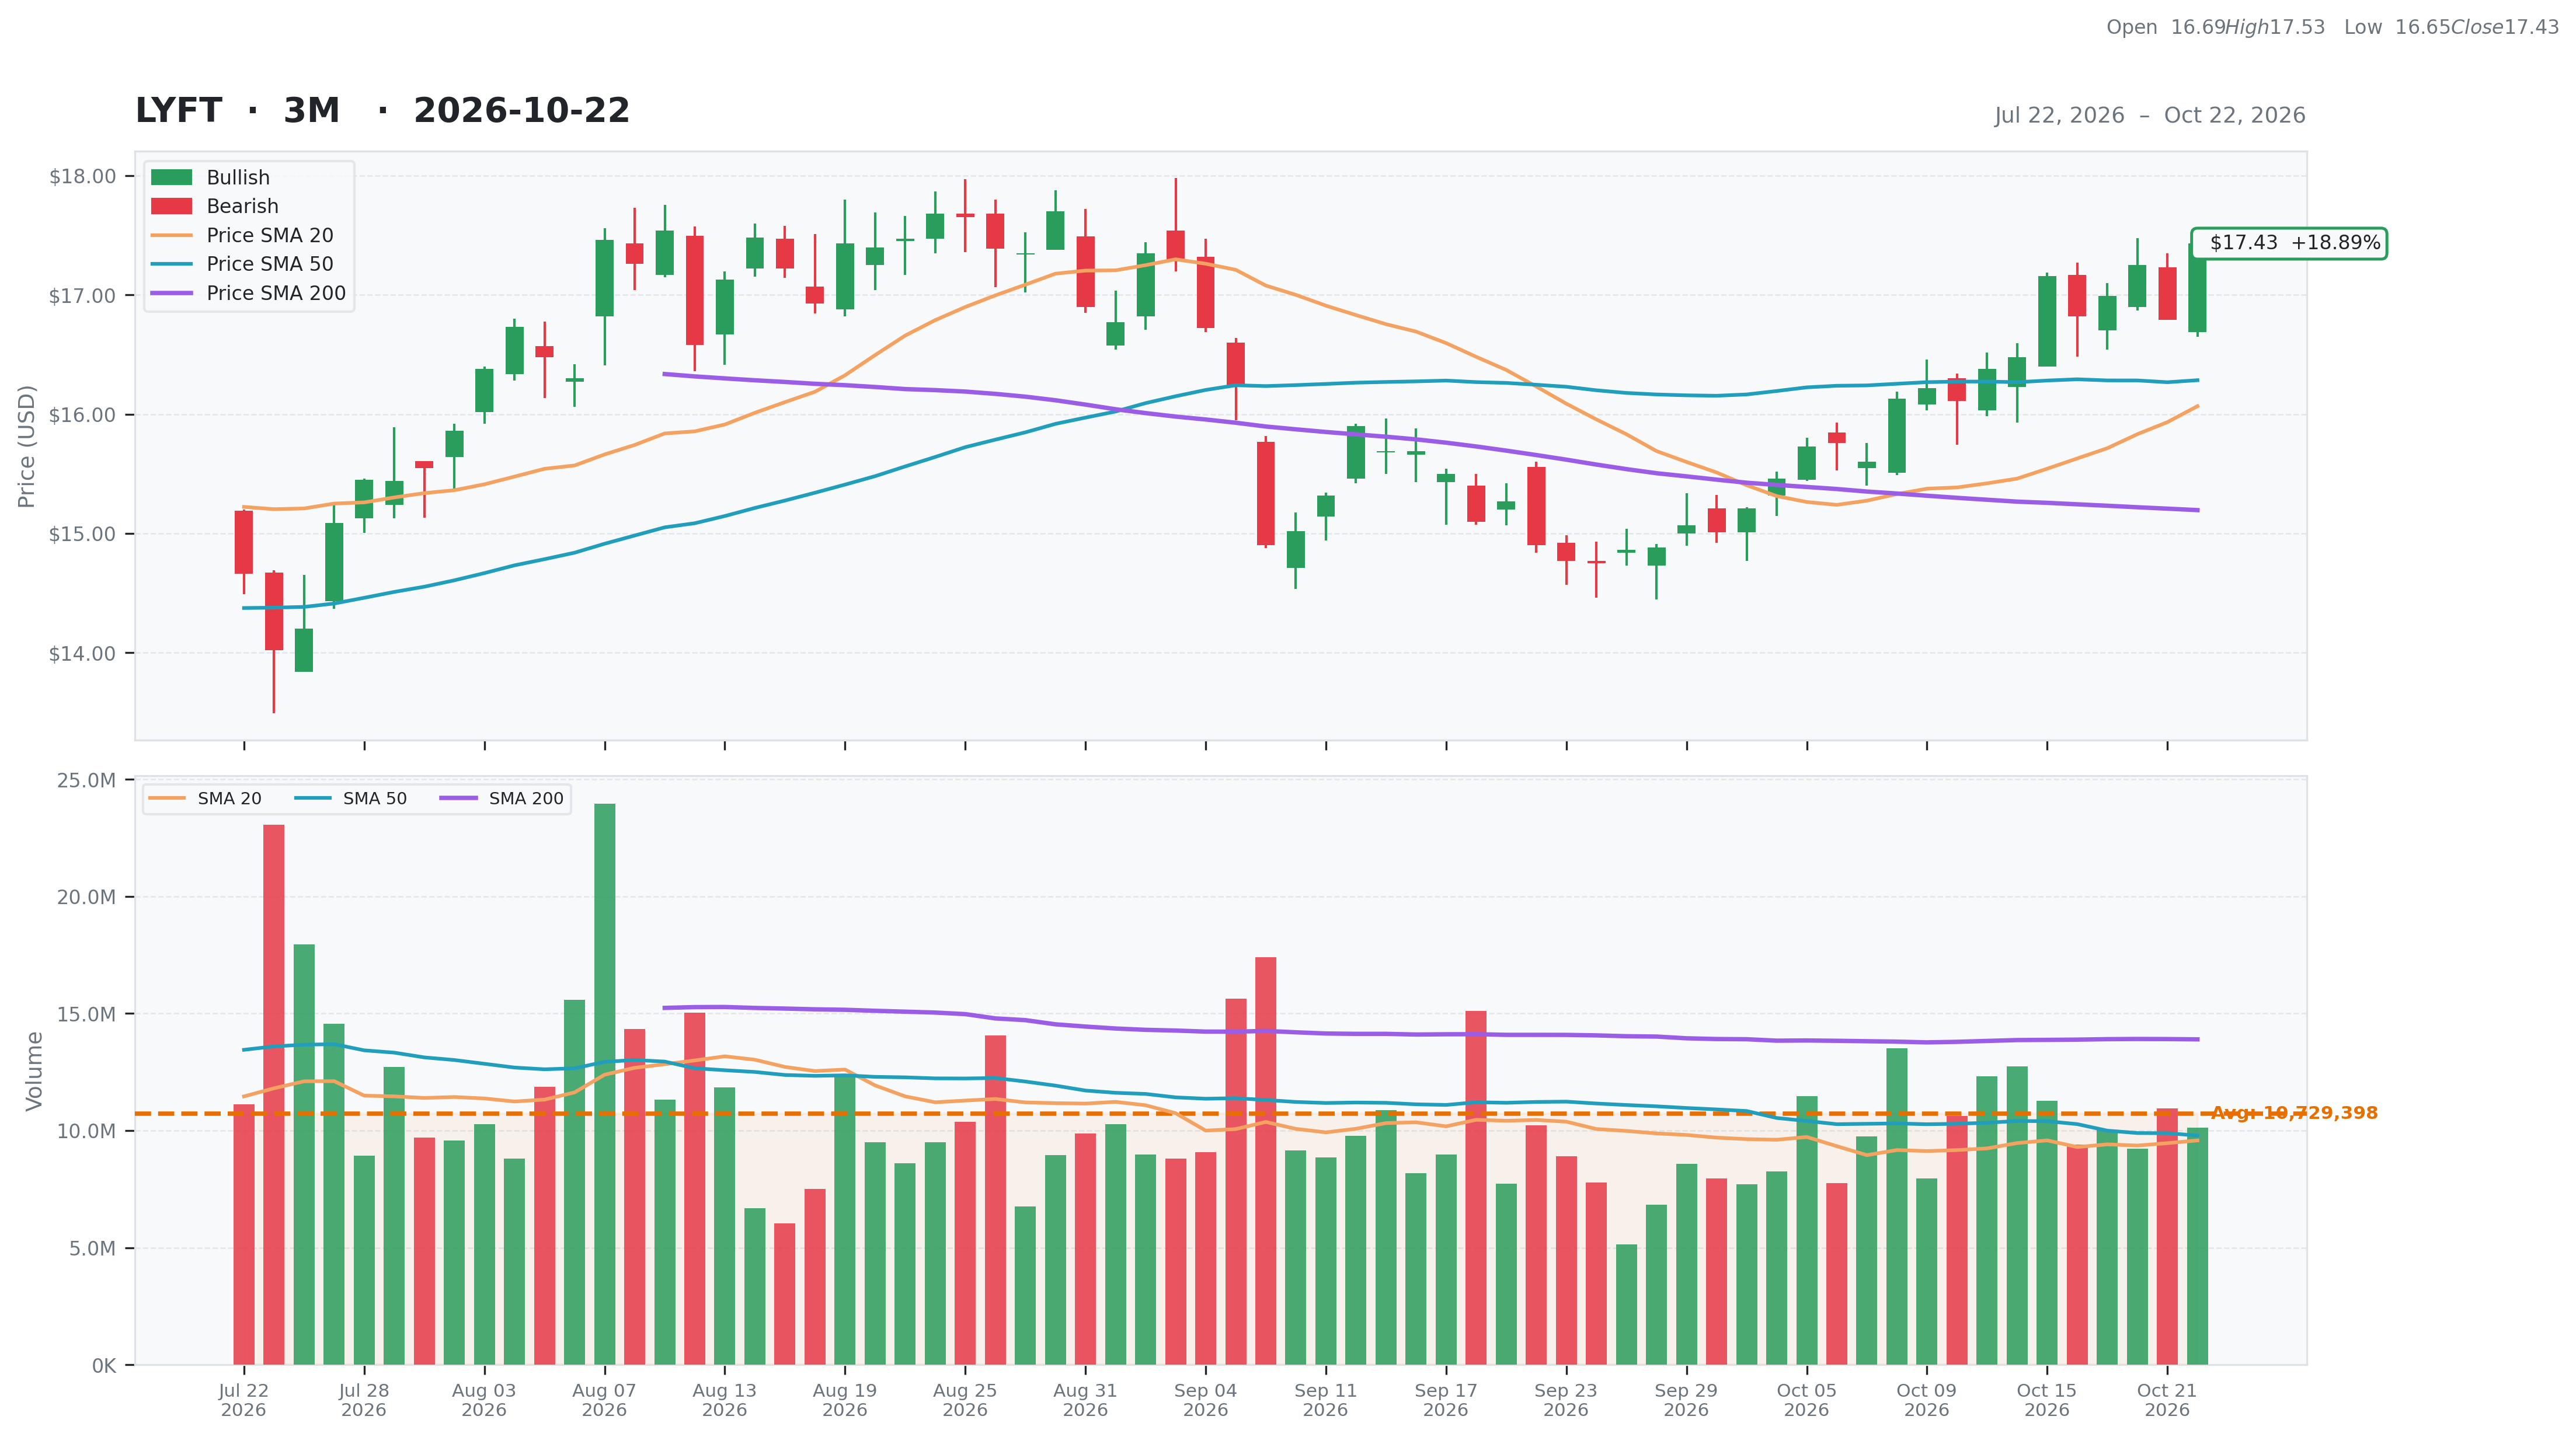
| Total | 59 | Current | $17.43 | 52W High | $24.57 -29.06% | Relative Strength | 0.10 | Beta | 1.96 |
| Business Quality | 14 | Weekly | $17.16 1.57% | 52W Low | $12.65 37.79% | 3M | 0.23 | Short % | 0.21 |
| Financial Strength | 14 | Monthly | $14.90 16.98% | Above 50DMA | $16.28 7.03% | 6M | 0.24 | Risk Score | 7 |
| Growth Outlook | 9 | Quarterly | $14.20 22.75% | Above 200DMA | $15.20 14.70% | 9M | -0.04 | ||
| Momentum | 3 | Yearly | $20.63 -15.51% | 12M | -0.15 | ||||
| Valuation | Financial Strength | Growth/Profitability | |||
|---|---|---|---|---|---|
| Trailing P/E | 2.45 | Cash | 1,795M | Revenue Growth | 0.16% |
| Forward P/E | 7.81 | Debt | 1,292M | Earnings Growth | 0.34% |
| PEG Ratio | 0.15 | Debt/Equity | 42.74 | Qtr Earnings Growth | 0.25% |
| Price/Sales | 0.94 | Current Ratio | 0.59 | Gross Margin | 0.38% |
| Price/Book | 2.11 | Quick Ratio | 0.44 | Operating Margin | 0.03% |
| EV/Revenue | 0.87 | Operating CF | 1,195M | Profit Margin | 0.42% |
| EV/EBITDA | 125.87 | Free CF | 1,153M | EBITDA Margin | 0.01% |
| Ent Value | 5,865M | Return on Assets | -0.01% | ||
| Return on Equity | 1.53% | ||||
| Technical | Volume & Bollinger Bands | Analyst | |||
|---|---|---|---|---|---|
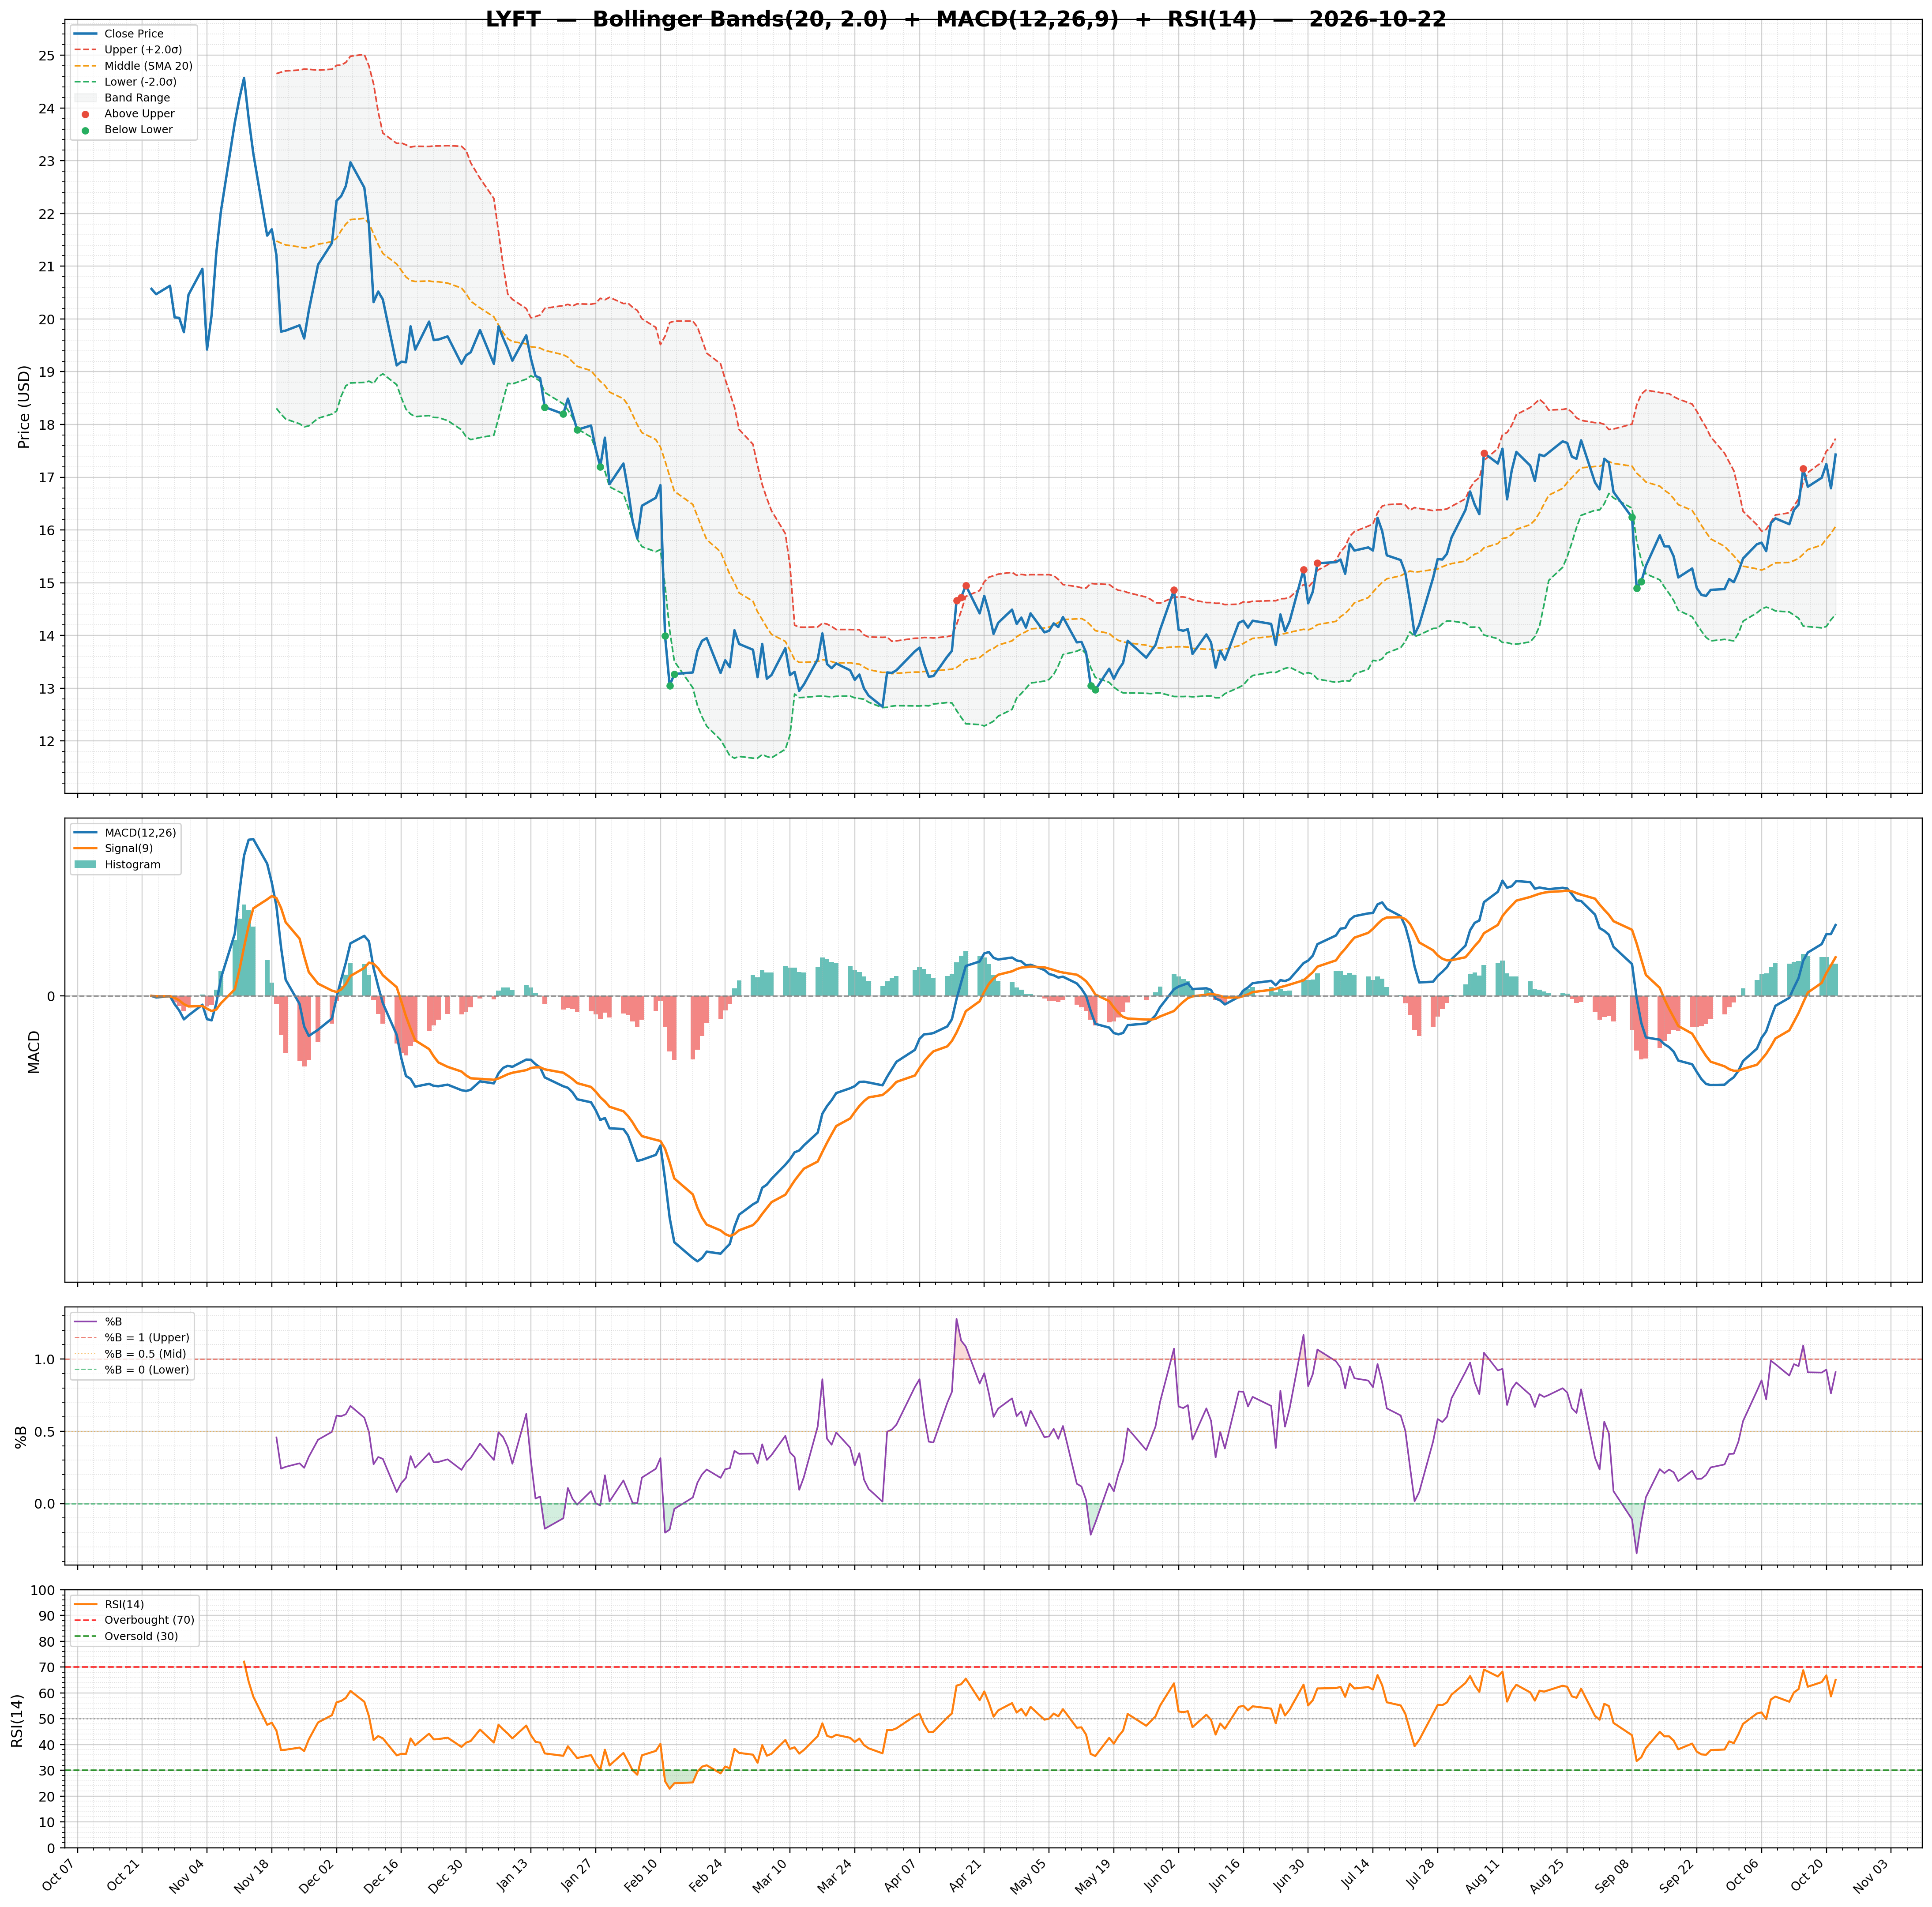
| RSI | 65.04 | Volume | 9.4M | Rating | buy |
| Previous RSI | 58.66 | Avg Volume 20D | 9.58M | Target Mean | $19.47 |
| RSI Trend | Up | Relative Volume | 1.05 | Target High | $30.00 |
| MACD | 0.38 | Lower Band | 14.40 | Target Low | $14.00 |
| MACD Signal | 0.21 | Middle Band | 16.07 | Target Median | $18.00 |
| Histogram | 0.17 | Upper Band | 17.73 | Analysts | 37 |
| Previous Histogram | 0.17 | Bandwidth | 20.740 | Upside | 15.74% |
| Histogram Trend | Increasing | %B | 0.91 | ||