Mastech Digital, Inc (MHH)
Industrials • Staffing & Employment Services • $6.3 • MCap: 76,279,888
https://www.mastechdigital.com • Mastech Digital, Inc., together with its subsidiaries, provides digital transformation IT services to large, medium-sized, and small companies in the United States, Canada, India, and internationally. It operates through Data and Analytics Services and IT Staffing Services segments. The company offers data and analytics services, including project-based consulting services in the areas of master data management, enterprise data integration, big data, analytics and digital transformation, data engineering, data science, and customer experience; and cloud services. It also provides data management, analytics, cloud, mobility, social, automation, and artificial intelligence; business intelligence/data warehousing, web services, enterprise resource planning and customer resource management, and e-business solutions; project-focused temporary IT staffing requirements for smaller organizations; offshore staffing; and engineering staffing services. In addition, the company offers digital learning services, such as custom training programs; and various cloud-based enterprise applications across sales, marketing, and customer service organizations. It provides its services through onsite and offshore resources across various industry verticals, such as financial services, retail, technology, healthcare, manufacturing, government, telecommunications, transportation, and other verticals. The company was formerly known as Mastech Holdings, Inc. and changed its name to Mastech Digital, Inc. in September 2016. Mastech Digital, Inc. was founded in 1986 and is headquartered in Moon Township, Pennsylvania.
ET
| Score | Price | 52 Week & Averages | Relative Strength | Risk | |||||
|---|---|---|---|---|---|---|---|---|---|
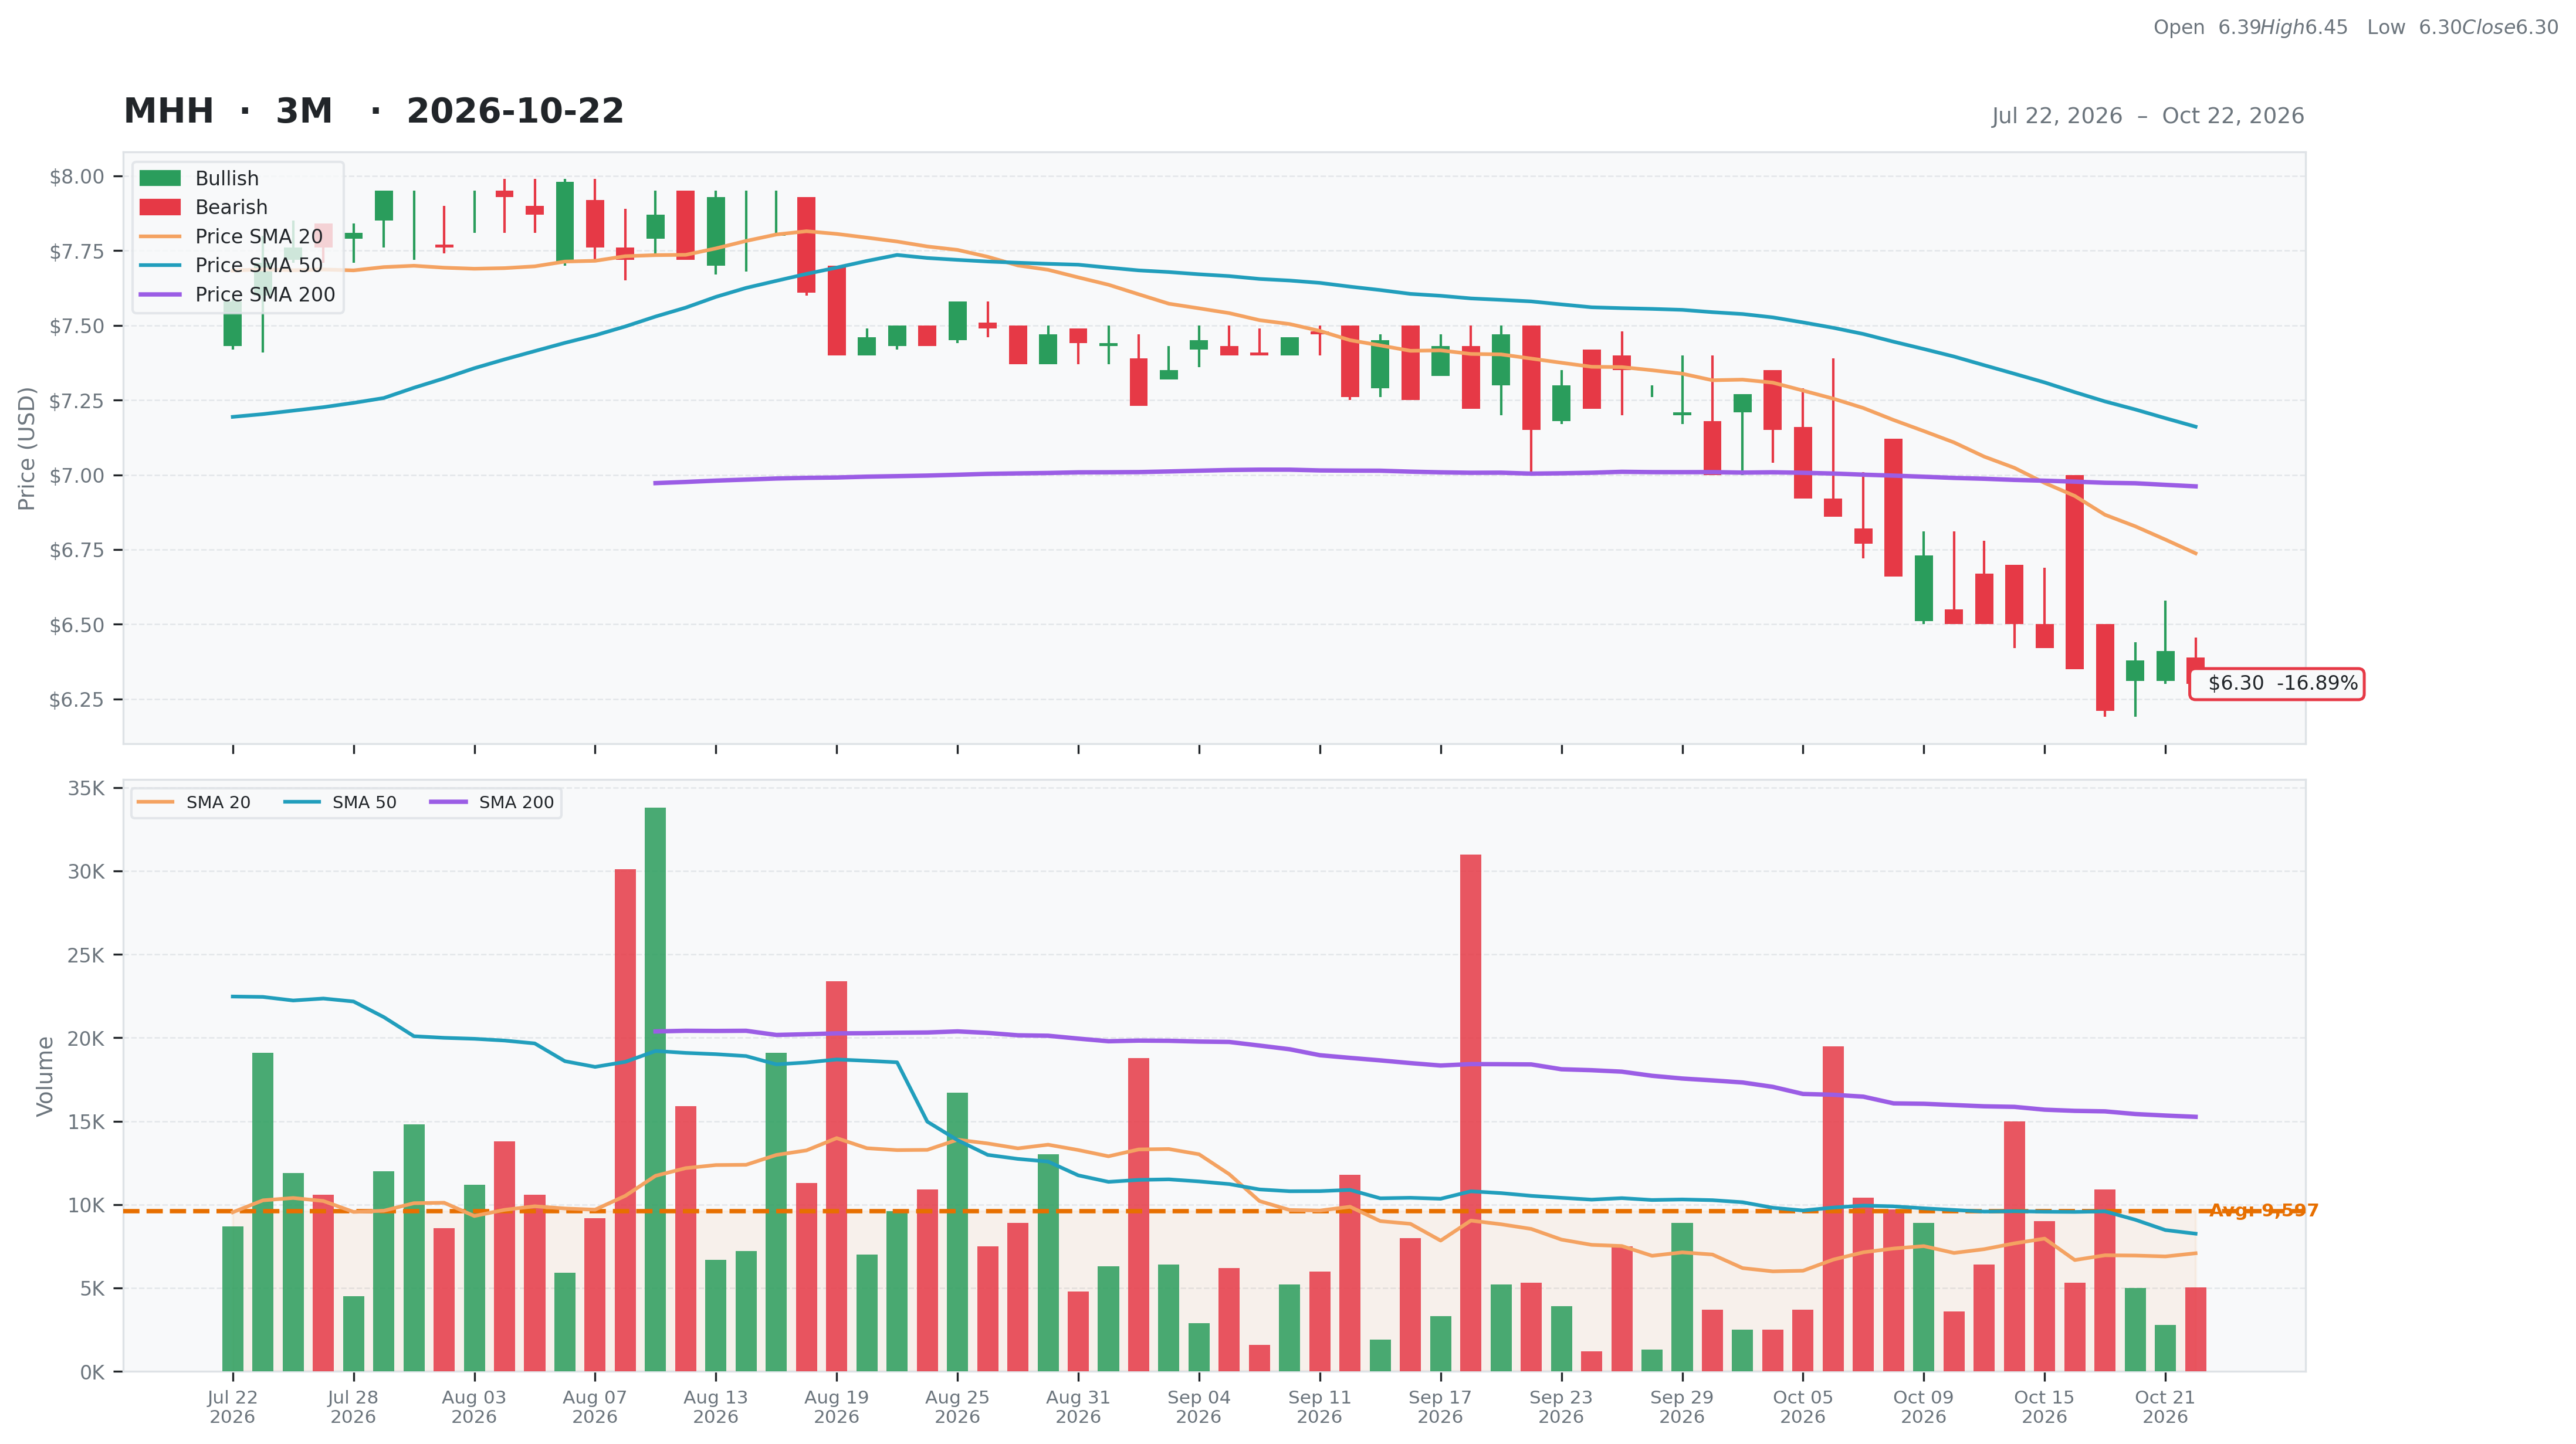
| Total | 50 | Current | $6.30 | 52W High | $8.02 -21.45% | Relative Strength | -0.13 | Beta | 0.86 |
| Business Quality | 4 | Weekly | $6.42 -1.87% | 52W Low | $5.50 14.55% | 3M | -0.19 | Short % | 0.01 |
| Financial Strength | 12 | Monthly | $7.15 -11.89% | Above 50DMA | $7.16 -12.03% | 6M | -0.06 | Risk Score | 10 |
| Growth Outlook | 5 | Quarterly | $7.76 -18.81% | Above 200DMA | $6.96 -9.50% | 9M | -0.11 | ||
| Momentum | 2 | Yearly | $7.18 -12.26% | 12M | -0.10 | ||||
| Valuation | Financial Strength | Growth/Profitability | |||
|---|---|---|---|---|---|
| Trailing P/E | 37.35 | Cash | 36M | Revenue Growth | -0.16% |
| Forward P/E | 6.58 | Debt | 2M | Earnings Growth | N/A |
| PEG Ratio | 0.44 | Debt/Equity | 2.32 | Qtr Earnings Growth | N/A |
| Price/Sales | 0.43 | Current Ratio | 4.10 | Gross Margin | 0.28% |
| Price/Book | 0.83 | Quick Ratio | 3.75 | Operating Margin | -0.01% |
| EV/Revenue | 0.24 | Operating CF | 10M | Profit Margin | 0.01% |
| EV/EBITDA | 12.54 | Free CF | 7M | EBITDA Margin | 0.02% |
| Ent Value | 43M | Return on Assets | 0.00% | ||
| Return on Equity | 0.02% | ||||
| Technical | Volume & Bollinger Bands | Analyst | |||
|---|---|---|---|---|---|
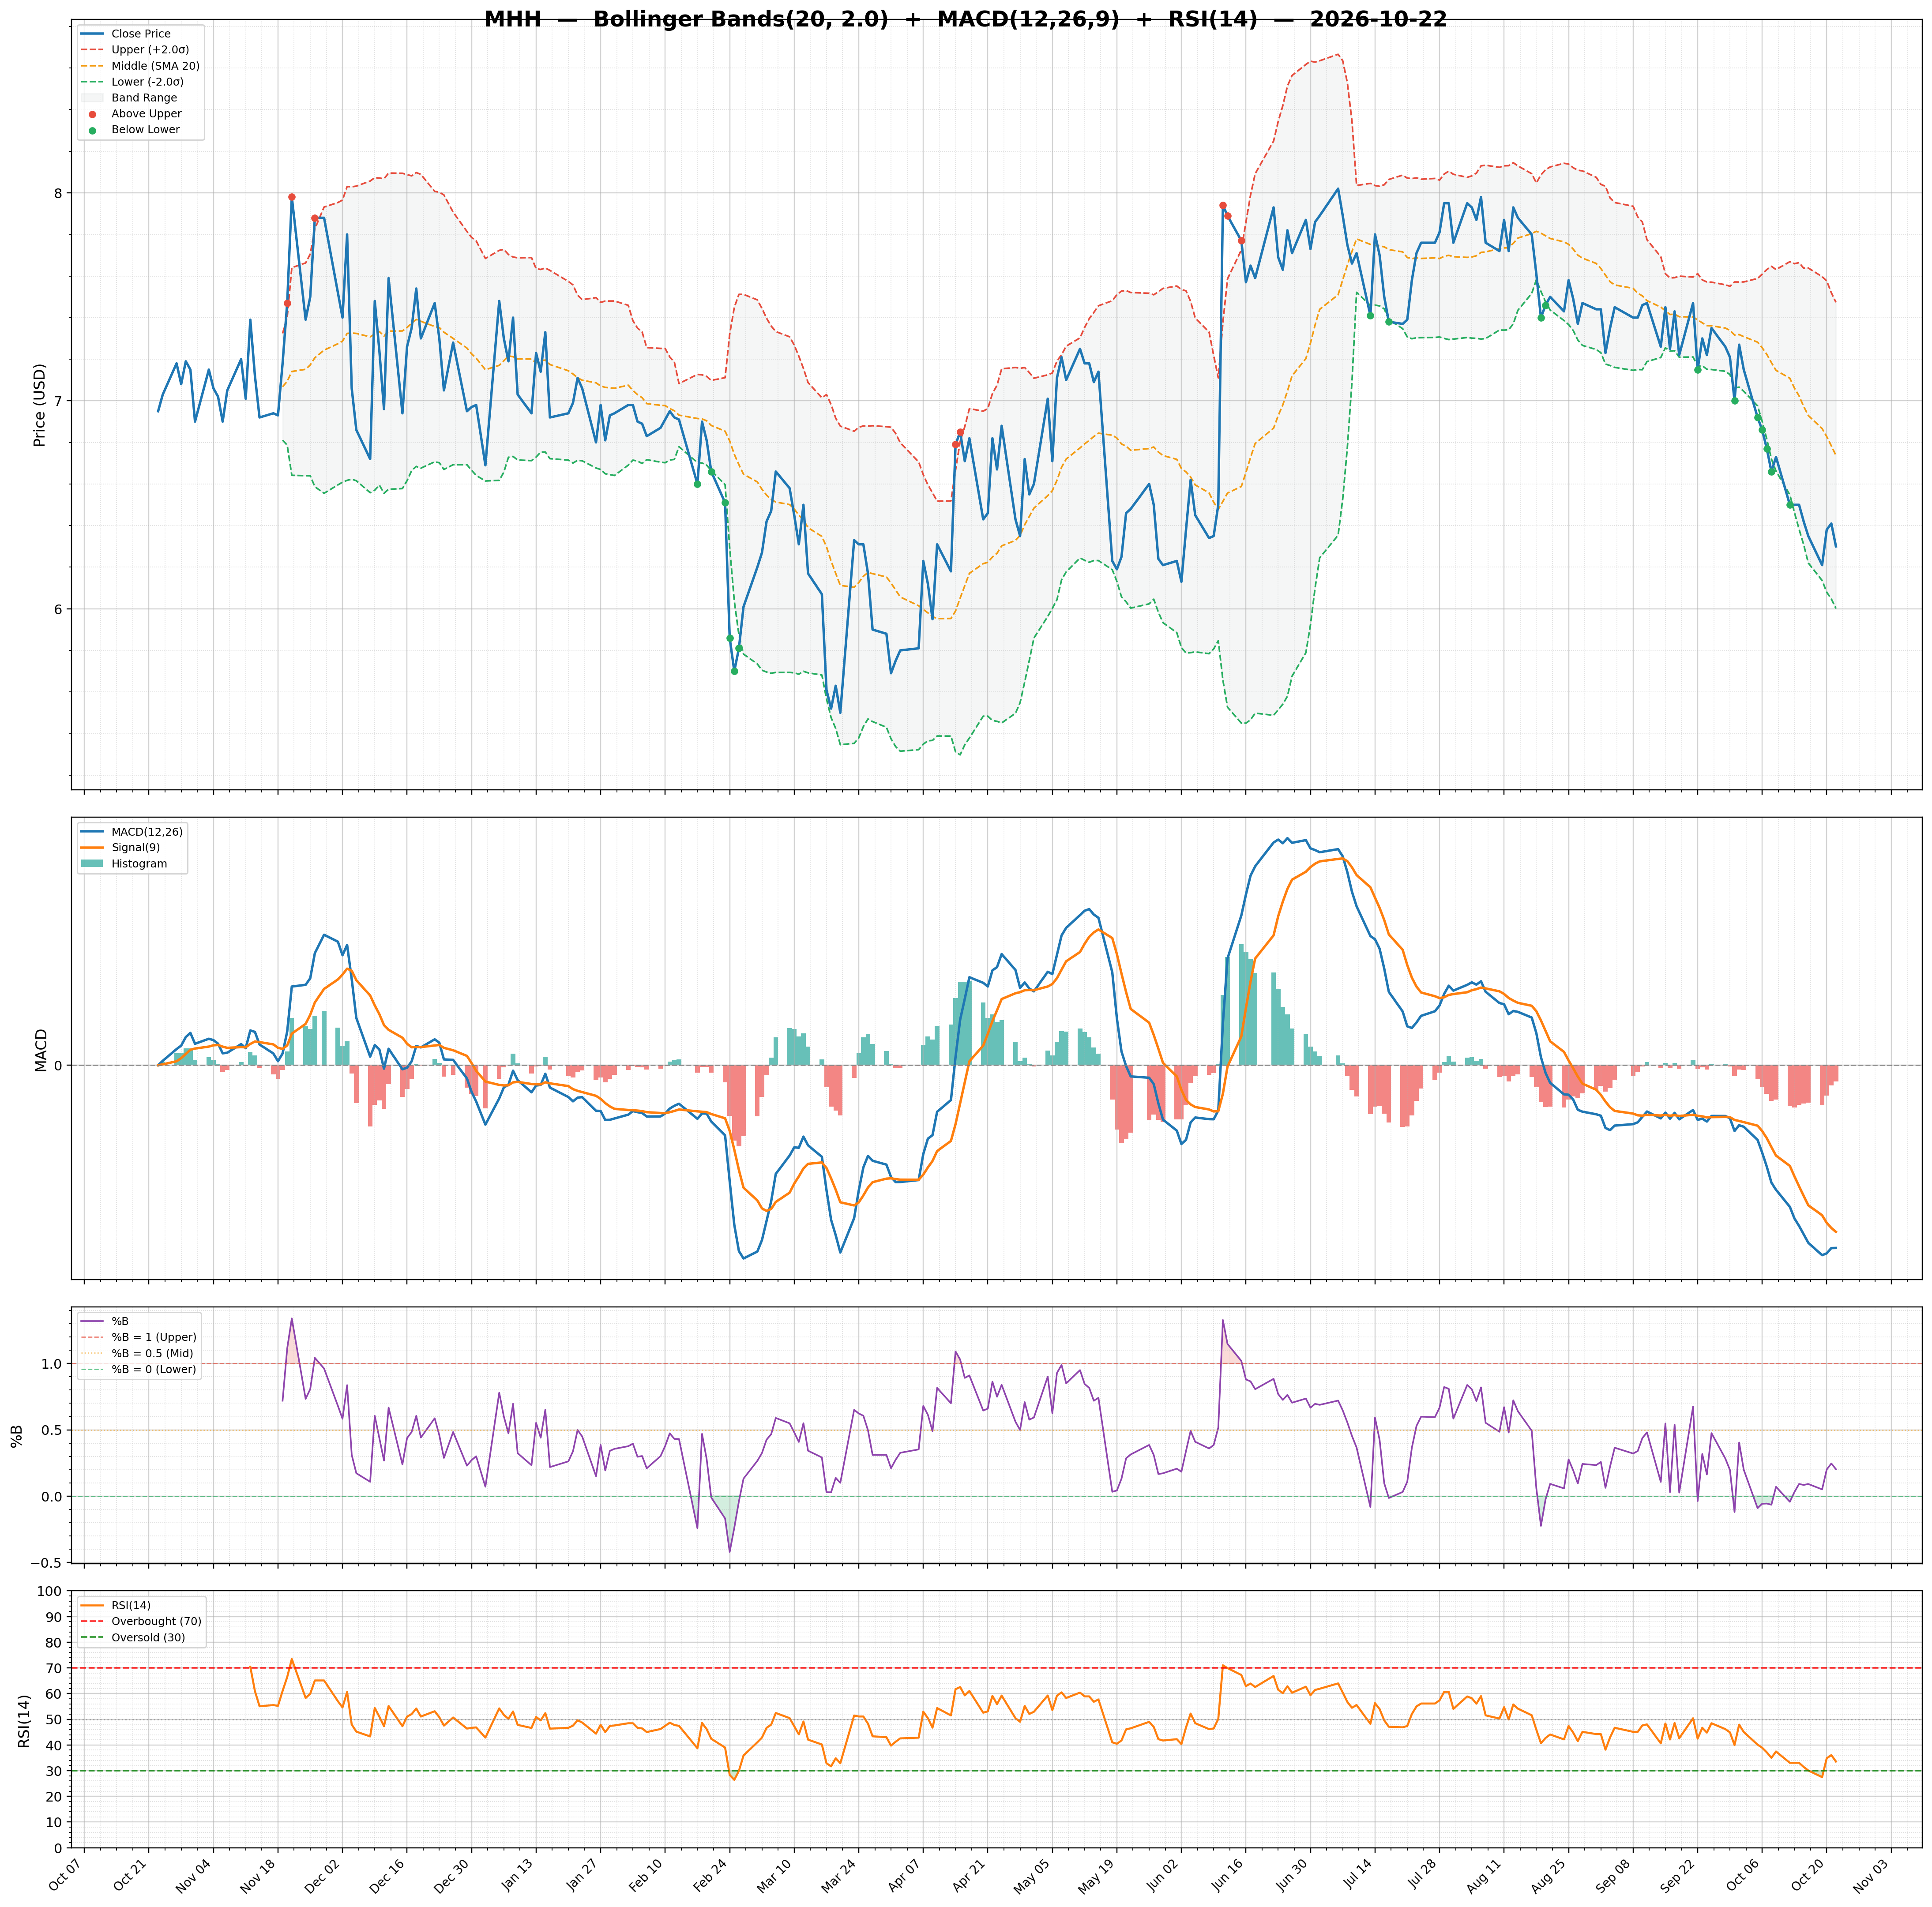
| RSI | 33.55 | Volume | 0.01M | Rating | none |
| Previous RSI | 36.06 | Avg Volume 20D | 0.01M | Target Mean | $12.75 |
| RSI Trend | Down | Relative Volume | 0.69 | Target High | $14.00 |
| MACD | -0.26 | Lower Band | 6.00 | Target Low | $11.50 |
| MACD Signal | -0.24 | Middle Band | 6.74 | Target Median | $12.75 |
| Histogram | -0.02 | Upper Band | 7.47 | Analysts | 2 |
| Previous Histogram | -0.03 | Bandwidth | 21.850 | Upside | 100.79% |
| Histogram Trend | Increasing | %B | 0.20 | ||