MIND Technology, Inc. (MIND)
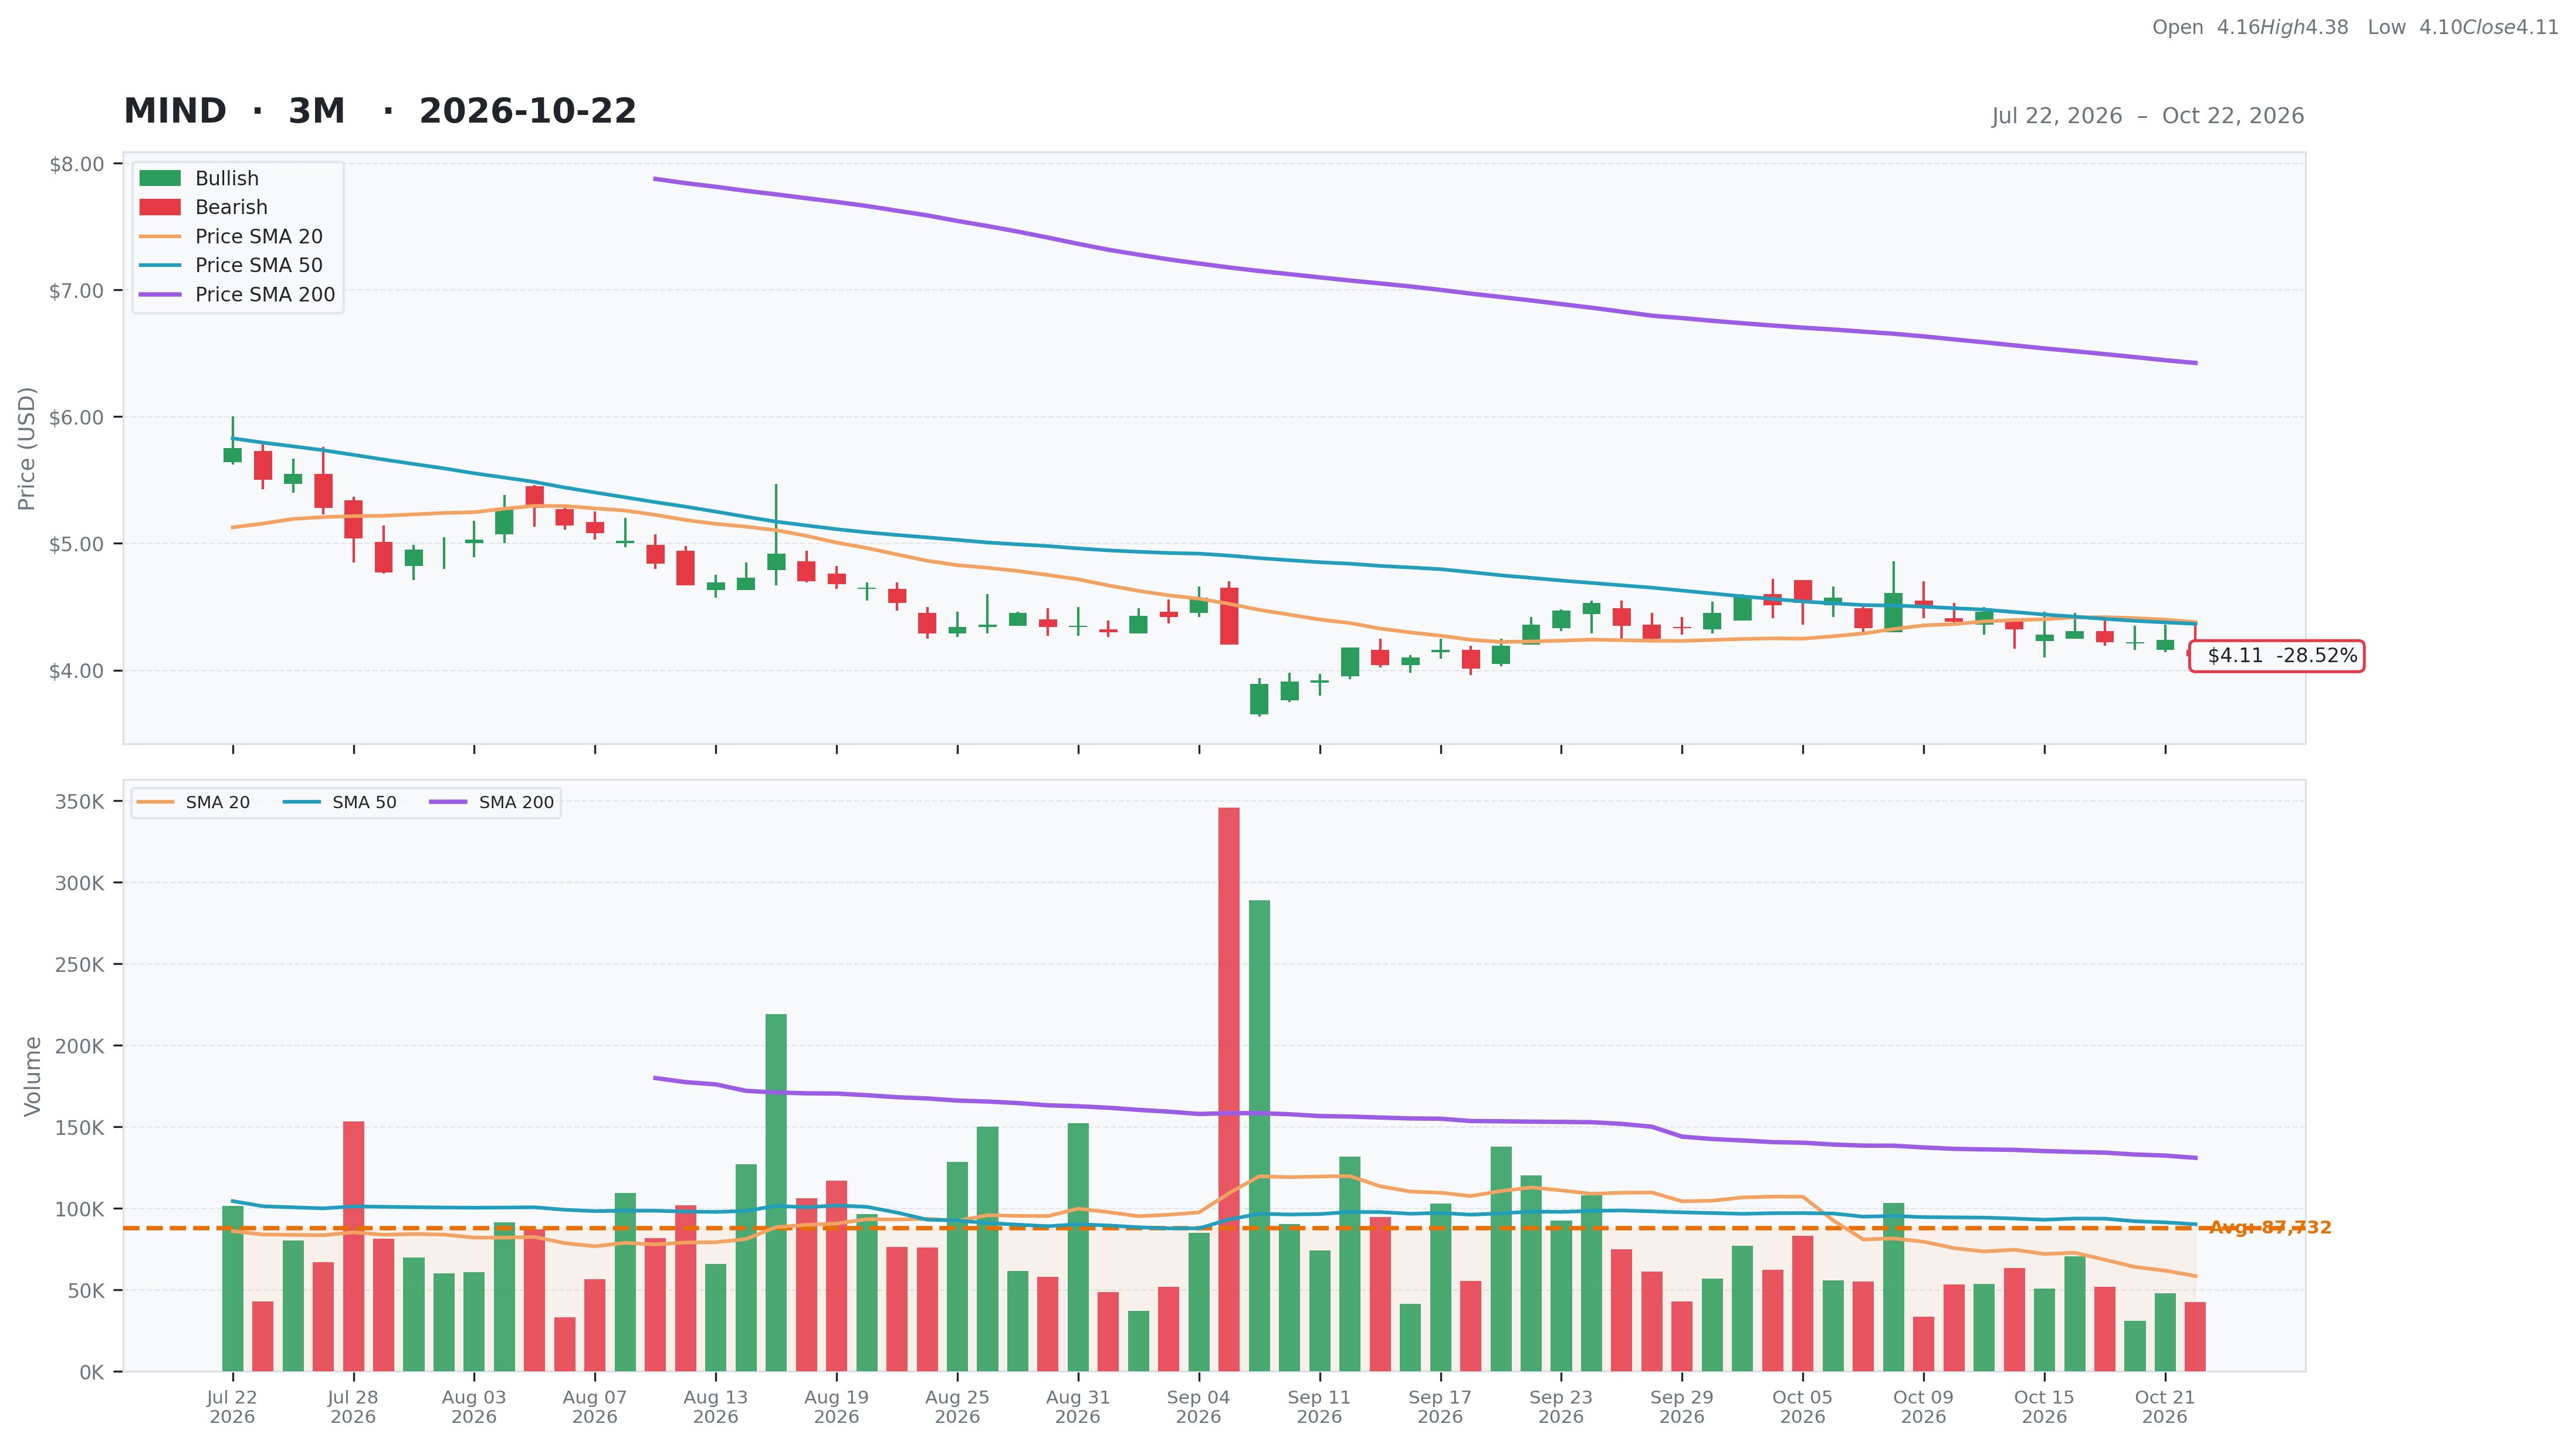
Technology • Scientific & Technical Instruments • $4.11 • MCap: 39,173,828
https://mind-technology.com • MIND Technology, Inc., together with its subsidiaries, designs, manufactures, and sells products for the oceanographic, hydrographic, and marine seismic industries in the United States, China, Norway, Turkey, Singapore, Japan, and internationally. The company offers GunLink seismic source acquisitions and control systems for operators of marine seismic surveys; BuoyLink RGNSS positioning system for positioning of marine seismic energy sources and streamers; Sleeve Gun energy sources; and SeaLink towed seismic streamer system. It also provides streamer weight collars, depth transducers, pressure transducers, air control valves, and source array systems; spare and replacement parts; and repair, training, field service operations, and umbilical termination services. The company was formerly known as Mitcham Industries, Inc. MIND Technology, Inc. was incorporated in 1987 and is headquartered in The Woodlands, Texas.
Ex-AAII
| Score | Price | 52 Week & Averages | Relative Strength | Risk | |||||
|---|---|---|---|---|---|---|---|---|---|
| Total | 42 | Current | $4.11 | 52W High | $14.29 -71.24% | Relative Strength | -0.41 | Beta | 0.33 |
| Business Quality | 7 | Weekly | $4.28 -3.97% | 52W Low | $3.89 5.66% | 3M | -0.26 | Short % | 0.03 |
| Financial Strength | 9 | Monthly | $4.36 -5.73% | Above 50DMA | $4.37 -5.85% | 6M | -0.34 | Risk Score | |
| Growth Outlook | 1 | Quarterly | $5.55 -25.95% | Above 200DMA | $6.42 -36.02% | 9M | -0.57 | ||
| Momentum | 2 | Yearly | $11.09 -62.94% | 12M | -0.61 | ||||
| Valuation | Financial Strength | Growth/Profitability | |||
|---|---|---|---|---|---|
| Trailing P/E | N/A | Cash | 16M | Revenue Growth | -0.58% |
| Forward P/E | 7.70 | Debt | 1M | Earnings Growth | N/A |
| PEG Ratio | 0.37 | Debt/Equity | 2.08 | Qtr Earnings Growth | N/A |
| Price/Sales | 1.13 | Current Ratio | 6.92 | Gross Margin | 0.42% |
| Price/Book | 0.97 | Quick Ratio | 4.97 | Operating Margin | -0.32% |
| EV/Revenue | 0.70 | Operating CF | -3M | Profit Margin | -0.07% |
| EV/EBITDA | -516.06 | Free CF | -2M | EBITDA Margin | 0.00% |
| Ent Value | 24M | Return on Assets | -0.01% | ||
| Return on Equity | -0.07% | ||||
| Technical | Volume & Bollinger Bands | Analyst | |||
|---|---|---|---|---|---|
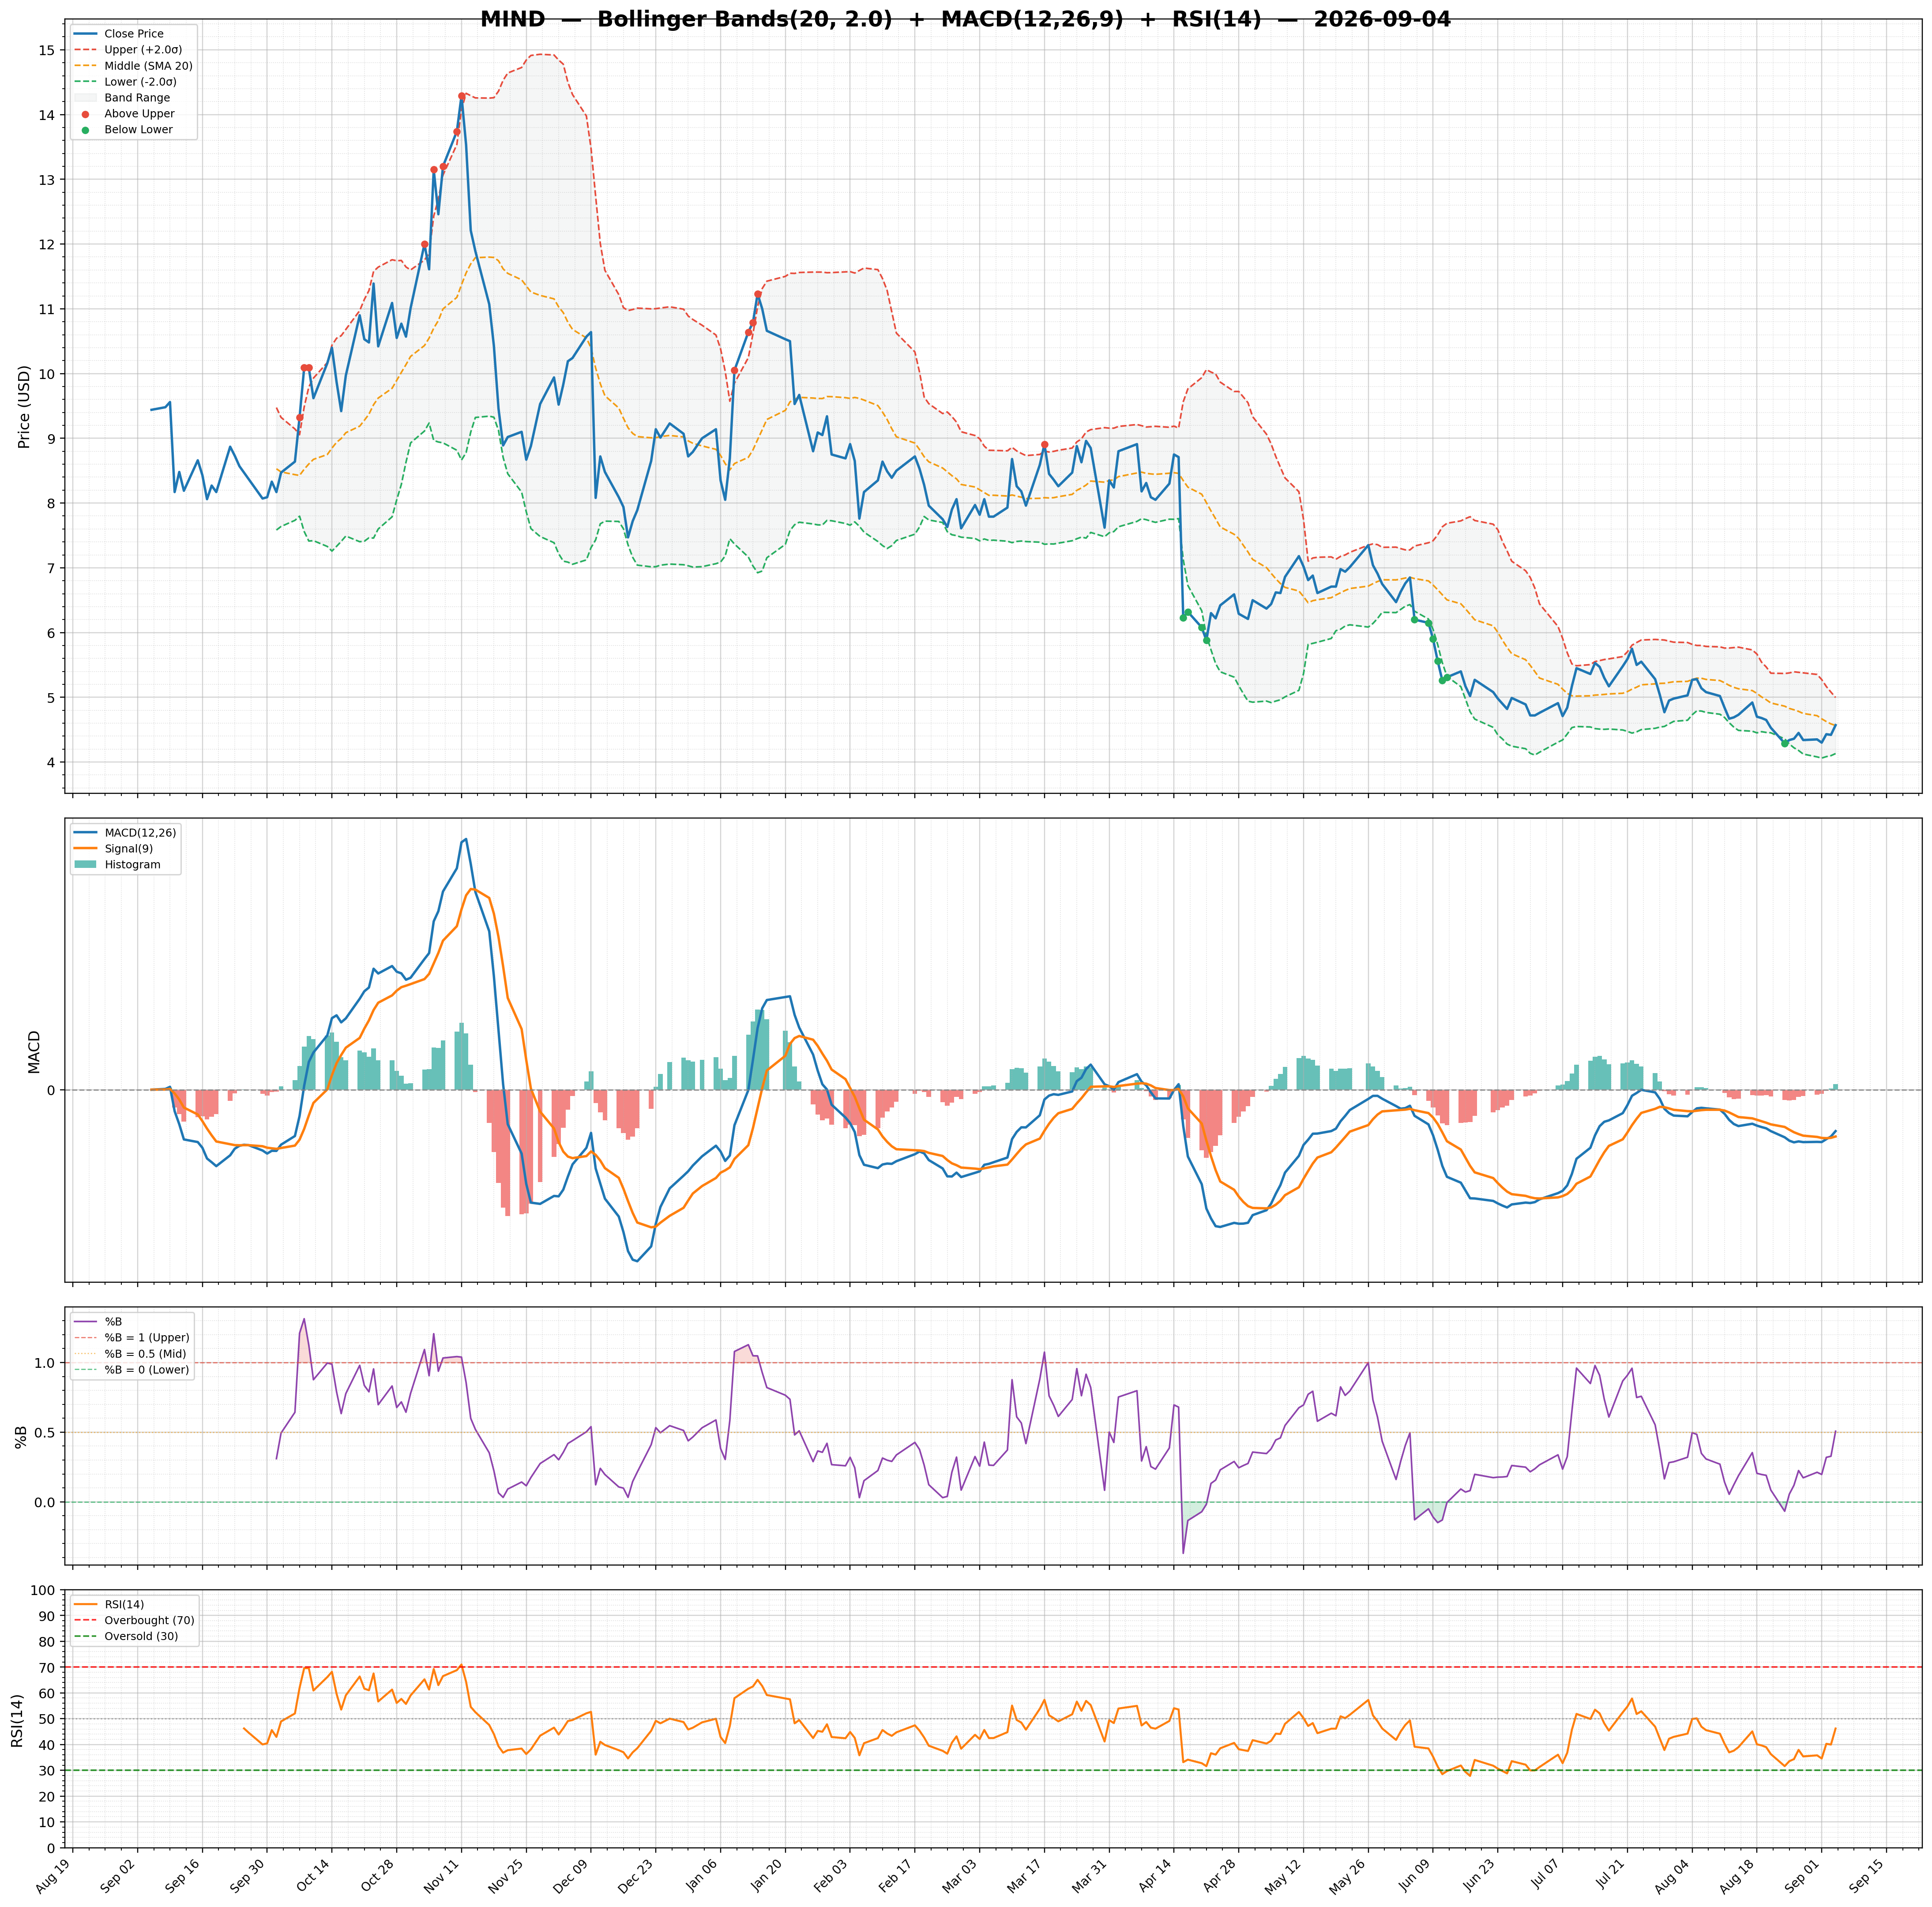
| RSI | 40.72 | Volume | 0.07M | Rating | none |
| Previous RSI | 44.92 | Avg Volume 20D | 0.06M | Target Mean | $9.00 |
| RSI Trend | Down | Relative Volume | 0.60 | Target High | $9.00 |
| MACD | -0.05 | Lower Band | 4.09 | Target Low | $9.00 |
| MACD Signal | -0.02 | Middle Band | 4.38 | Target Median | $9.00 |
| Histogram | -0.03 | Upper Band | 4.66 | Analysts | 1 |
| Previous Histogram | -0.02 | Bandwidth | 12.970 | Upside | 108.82% |
| Histogram Trend | Decreasing | %B | 0.03 | ||