Mirion Technologies, Inc. (MIR)
Industrials • Specialty Industrial Machinery • $14.92 • MCap: 3,772,995,840
https://www.mirion.com • Mirion Technologies, Inc. provides radiation detection, measurement, analysis, and monitoring products and services in North America, Europe, and the Asia Pacific. It operates in two segments, Medical, and Nuclear & Safety. The Medical segment offers radiation oncology quality assurance and dosimetry solutions; patient safety solutions for diagnostic imaging and radiation therapy centers; radiation therapy quality assurance solutions for calibrating and verifying imaging and treatment accuracy; and radionuclide therapy products for nuclear medicine applications, such as product handling, medical imaging furniture, and rehabilitation products. This segment improves the quality and safety of cancer care delivery; and supports applications across medical diagnostics and practitioner safety. The Nuclear & Safety segment focuses on addressing critical radiation safety, measurement, and analysis applications; and provides personal radiation detection, identification equipment, and analysis tools. The company also offers include radiation measurement and monitoring solutions, reactor instrumentation and control detectors, imaging systems and cameras, and waste management systems; laboratory and scientific analysis systems comprising gamma/alpha spectroscopy, alpha/beta counting, specialty detectors, and spectroscopy software; radiation measurement and health physics instrumentation; and contamination and clearance monitors. It serves hospitals, clinics and urgent care facilities, dental and veterinary offices, radiation treatment facilities, OEMs for radiation therapy, laboratories, military organizations, government agencies, industrial companies, power and utility companies, reactor design firms, and NPPs. The company was formerly known as Global Monitoring Systems, Inc. and changed its name to Mirion Technologies, Inc. in January 2006. Mirion Technologies, Inc. was incorporated in 2005 and is headquartered in Atlanta, Georgia.
ET
Notes
10/05/2026
hold
| Score | Price | 52 Week & Averages | Relative Strength | Risk | |||||
|---|---|---|---|---|---|---|---|---|---|
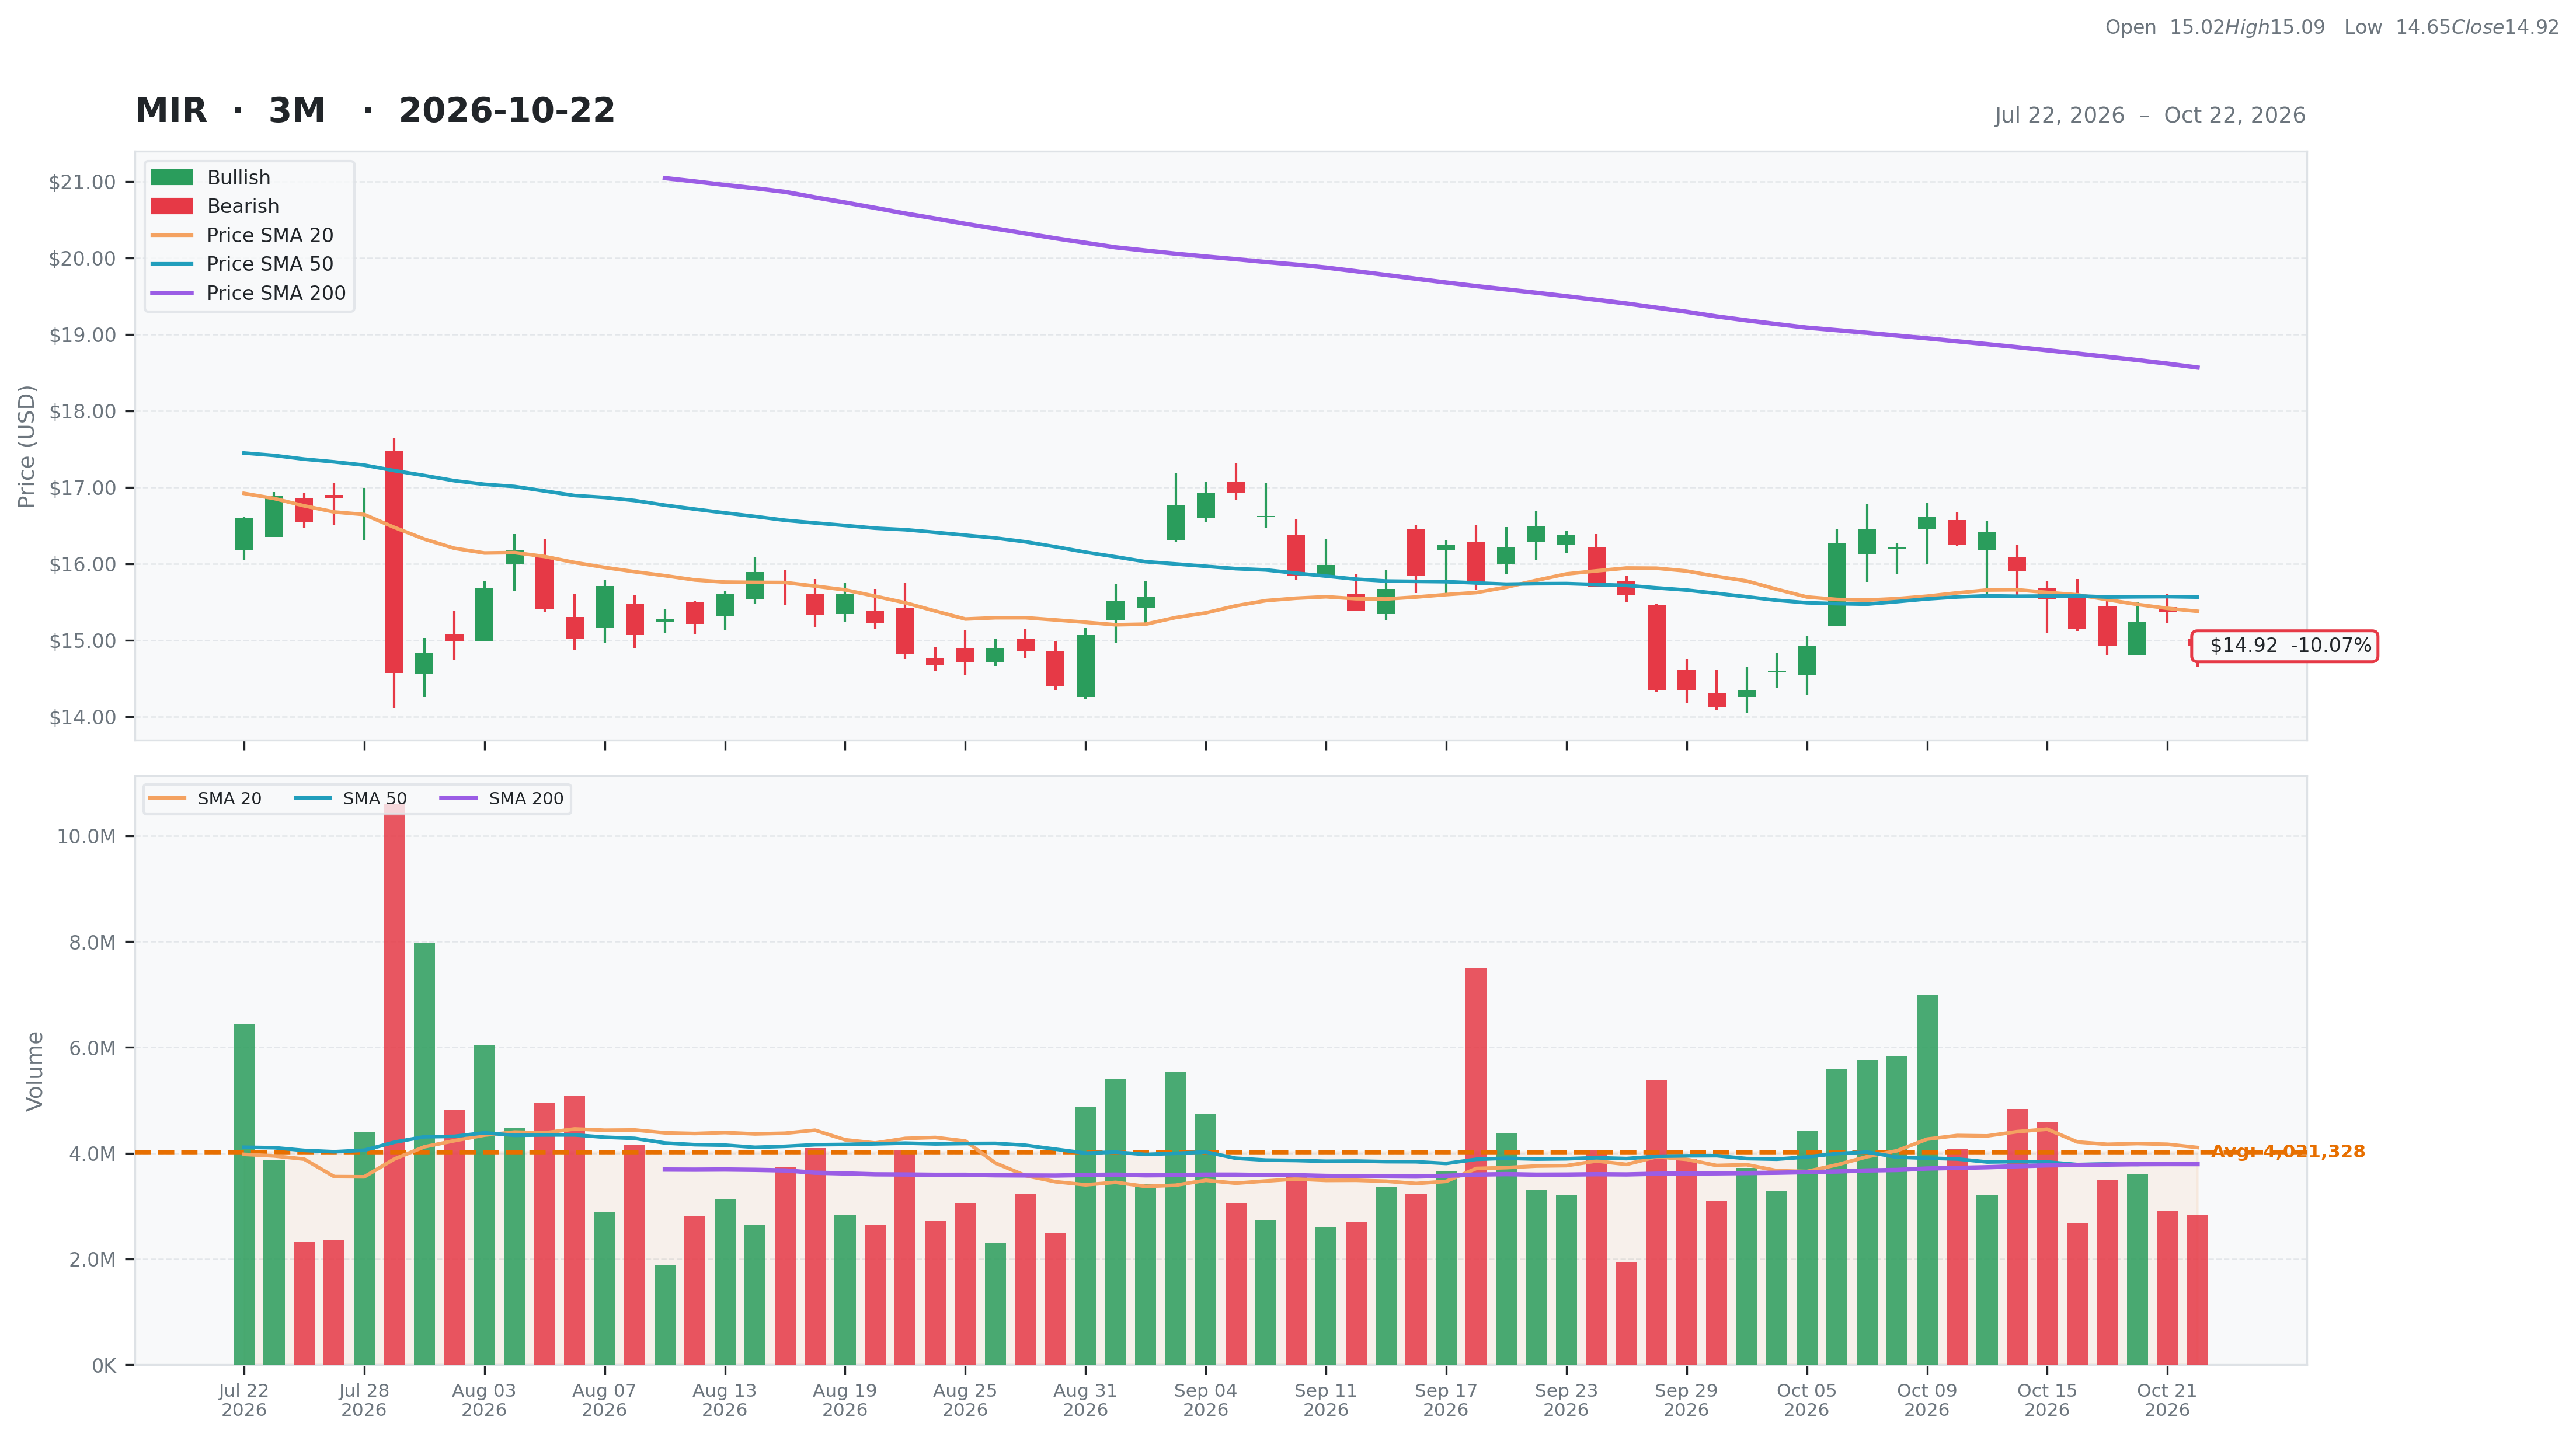
| Total | 48 | Current | $14.92 | 52W High | $29.75 -49.85% | Relative Strength | -0.25 | Beta | 1.10 |
| Business Quality | 9 | Weekly | $15.54 -3.99% | 52W Low | $14.12 5.67% | 3M | -0.10 | Short % | 0.23 |
| Financial Strength | 14 | Monthly | $16.49 -9.52% | Above 50DMA | $15.56 -4.13% | 6M | -0.23 | Risk Score | 4 |
| Growth Outlook | 4 | Quarterly | $16.54 -9.79% | Above 200DMA | $18.57 -19.63% | 9M | -0.44 | ||
| Momentum | 3 | Yearly | $24.54 -39.20% | 12M | -0.40 | ||||
| Valuation | Financial Strength | Growth/Profitability | |||
|---|---|---|---|---|---|
| Trailing P/E | 168.33 | Cash | 425M | Revenue Growth | 0.20% |
| Forward P/E | 22.46 | Debt | 1,233M | Earnings Growth | 0.00% |
| PEG Ratio | N/A | Debt/Equity | 65.76 | Qtr Earnings Growth | -0.07% |
| Price/Sales | 3.68 | Current Ratio | 3.20 | Gross Margin | 0.48% |
| Price/Book | 2.02 | Quick Ratio | 2.51 | Operating Margin | 0.07% |
| EV/Revenue | 4.43 | Operating CF | 173M | Profit Margin | 0.02% |
| EV/EBITDA | 20.49 | Free CF | 115M | EBITDA Margin | 0.22% |
| Ent Value | 4,543M | Return on Assets | 0.01% | ||
| Return on Equity | 0.02% | ||||
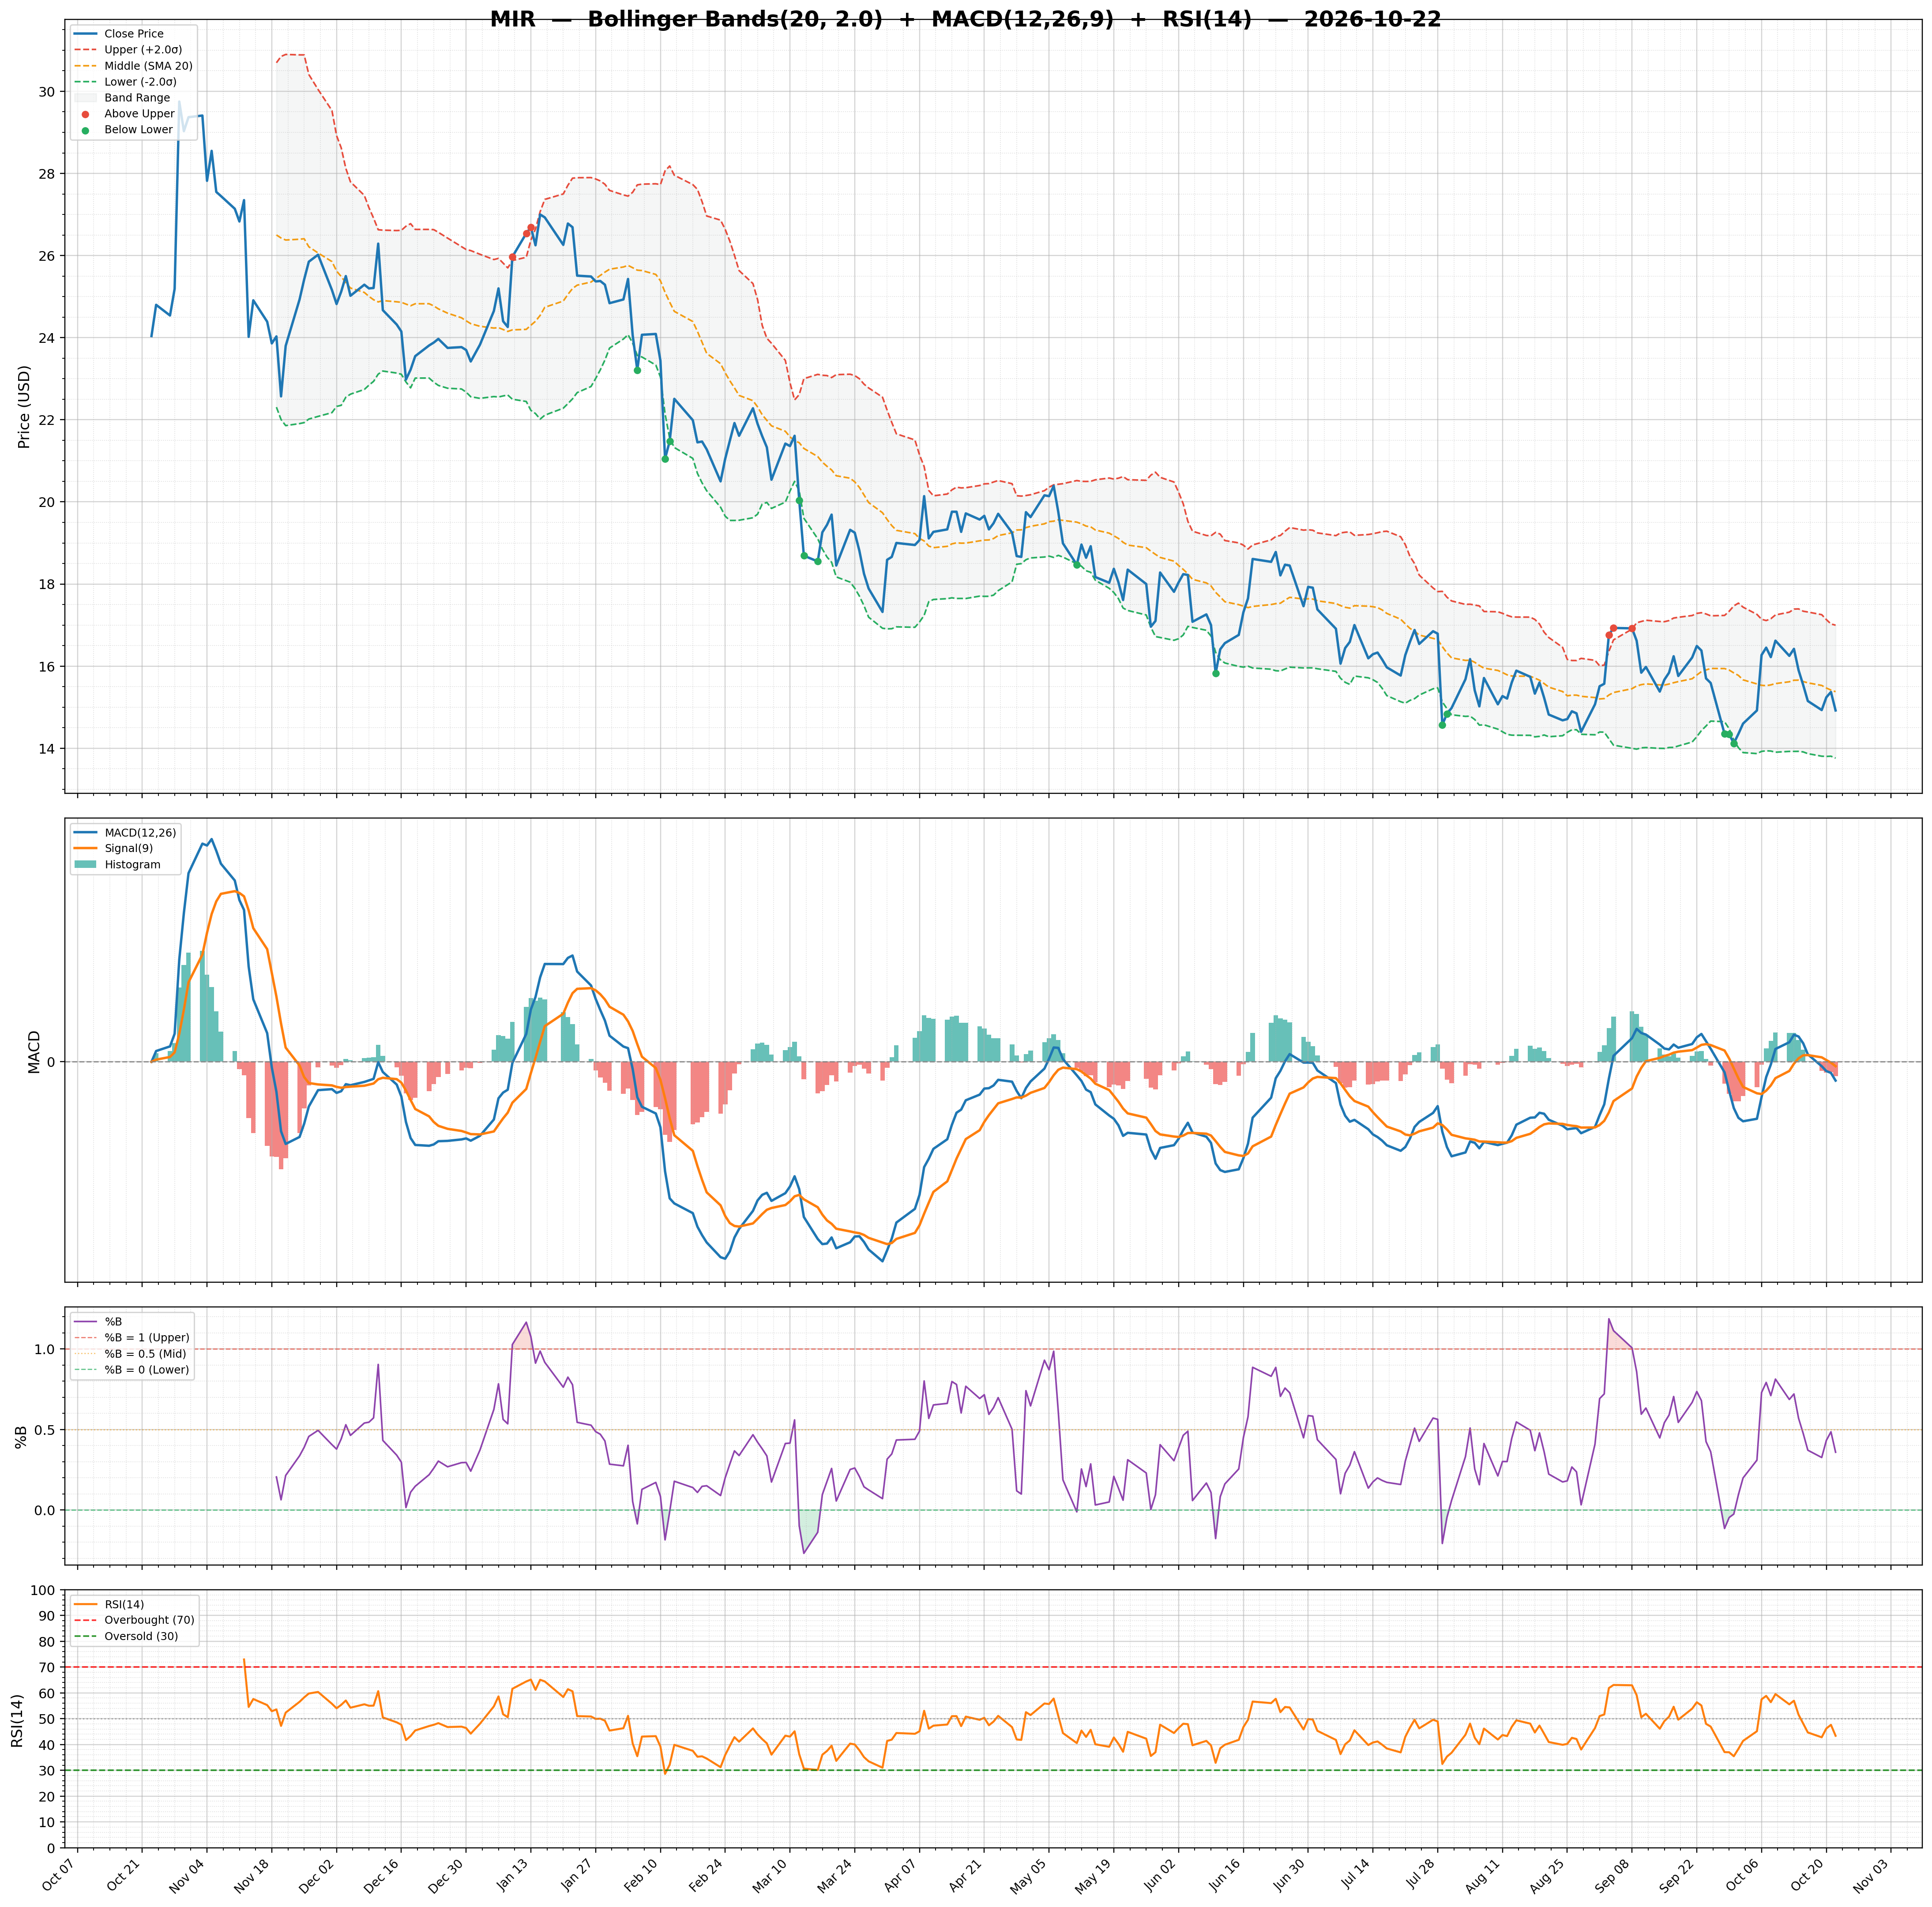
| Technical | Volume & Bollinger Bands | Analyst | |||
|---|---|---|---|---|---|
| RSI | 43.38 | Volume | 2.67M | Rating | strong_buy |
| Previous RSI | 47.63 | Avg Volume 20D | 4.11M | Target Mean | $24.00 |
| RSI Trend | Down | Relative Volume | 0.71 | Target High | $29.00 |
| MACD | -0.11 | Lower Band | 13.76 | Target Low | $20.00 |
| MACD Signal | -0.02 | Middle Band | 15.38 | Target Median | $24.00 |
| Histogram | -0.08 | Upper Band | 17.00 | Analysts | 11 |
| Previous Histogram | -0.06 | Bandwidth | 21.060 | Upside | 58.42% |
| Histogram Trend | Decreasing | %B | 0.36 | ||