Merlin, Inc. (MRLN)
Industrials • Aerospace & Defense • $0.83 • MCap: 110,669,224
https://www.merlinlabs.com • Merlin, Inc., an aerospace and defense technology company, develops AI-powered autonomous flight software and systems for aircraft in the United States and New Zealand. The company provides an aircraft-agnostic, AI-powered software platform that enables autonomous flight for both legacy and next-generation airborne systems. Its main product, the Merlin Pilot, is an integrated hardware and software solution that manages navigation, communication with air traffic control, obstacle avoidance, and real-time decision-making using sensor technologies and natural language processing. The company supports both military and civil aviation programs, offering solutions for missions such as cargo transport and national security operations. It collaborates with partners and regulatory bodies to conduct flight trials and support the certification of autonomous flight systems. The company serves defense organizations, commercial aviation clients, government agencies, regulators, and air cargo operators. The company was founded in 2018 and is based in Boston, Massachusetts.
Ex-AAII
| Score | Price | 52 Week & Averages | Relative Strength | Risk | |||||
|---|---|---|---|---|---|---|---|---|---|
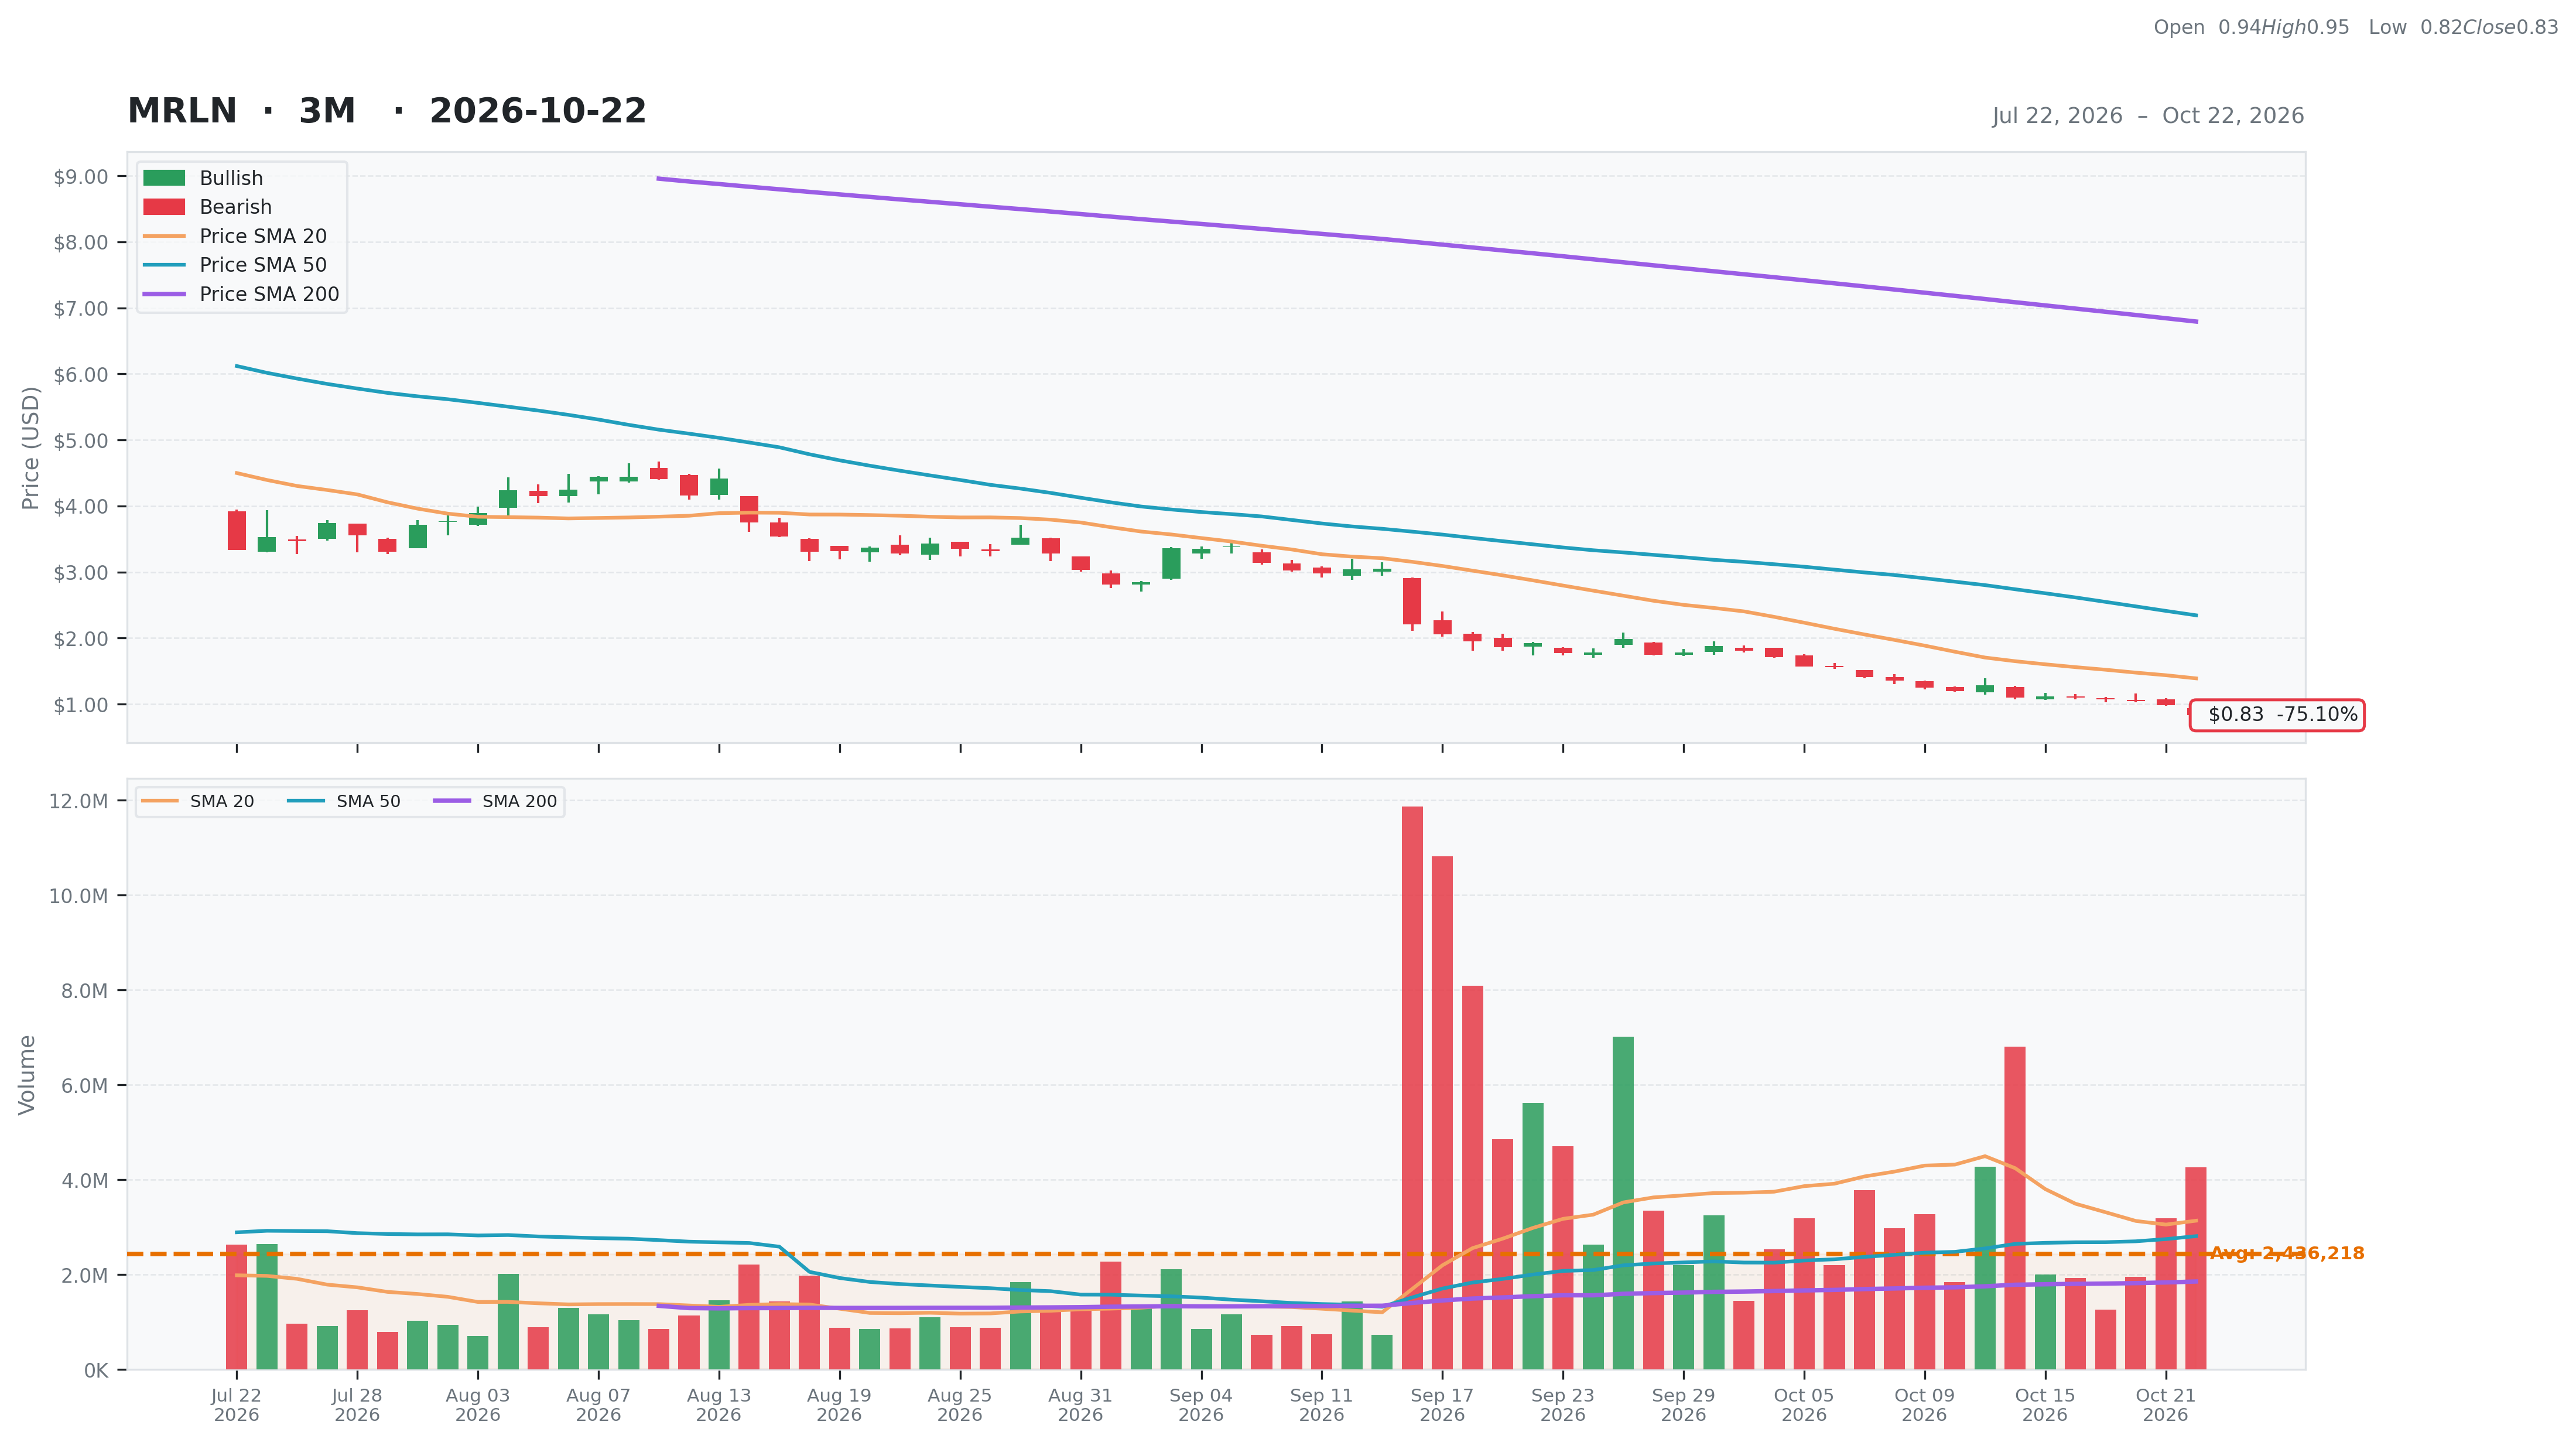
| Total | 33 | Current | $0.83 | 52W High | $16.09 -94.84% | Relative Strength | -0.86 | Beta | N/A |
| Business Quality | 1 | Weekly | $1.12 -25.86% | 52W Low | $0.83 0.00% | 3M | -0.76 | Short % | |
| Financial Strength | 9 | Monthly | $1.92 -56.75% | Above 50DMA | $2.35 -64.59% | 6M | -0.93 | Risk Score | |
| Growth Outlook | 1 | Quarterly | $3.47 -76.07% | Above 200DMA | $6.79 -87.78% | 9M | -0.92 | ||
| Momentum | 3 | Yearly | $11.91 -93.03% | 12M | -0.93 | ||||
| Valuation | Financial Strength | Growth/Profitability | |||
|---|---|---|---|---|---|
| Trailing P/E | N/A | Cash | 184M | Revenue Growth | -0.29% |
| Forward P/E | -0.99 | Debt | 2M | Earnings Growth | N/A |
| PEG Ratio | N/A | Debt/Equity | 3.50 | Qtr Earnings Growth | N/A |
| Price/Sales | 16.34 | Current Ratio | 14.67 | Gross Margin | -0.02% |
| Price/Book | -1.10 | Quick Ratio | 14.25 | Operating Margin | -15.29% |
| EV/Revenue | 13.51 | Operating CF | -86M | Profit Margin | 0.00% |
| EV/EBITDA | -1.00 | Free CF | N/A | EBITDA Margin | 0.00% |
| Ent Value | 91M | Return on Assets | N/A | ||
| Return on Equity | N/A | ||||
| Technical | Volume & Bollinger Bands | Analyst | |||
|---|---|---|---|---|---|
| RSI | 20.34 | Volume | 1.9M | Rating | strong_buy |
| Previous RSI | 22.75 | Avg Volume 20D | 3.14M | Target Mean | $7.92 |
| RSI Trend | Down | Relative Volume | 1.12 | Target High | $10.00 |
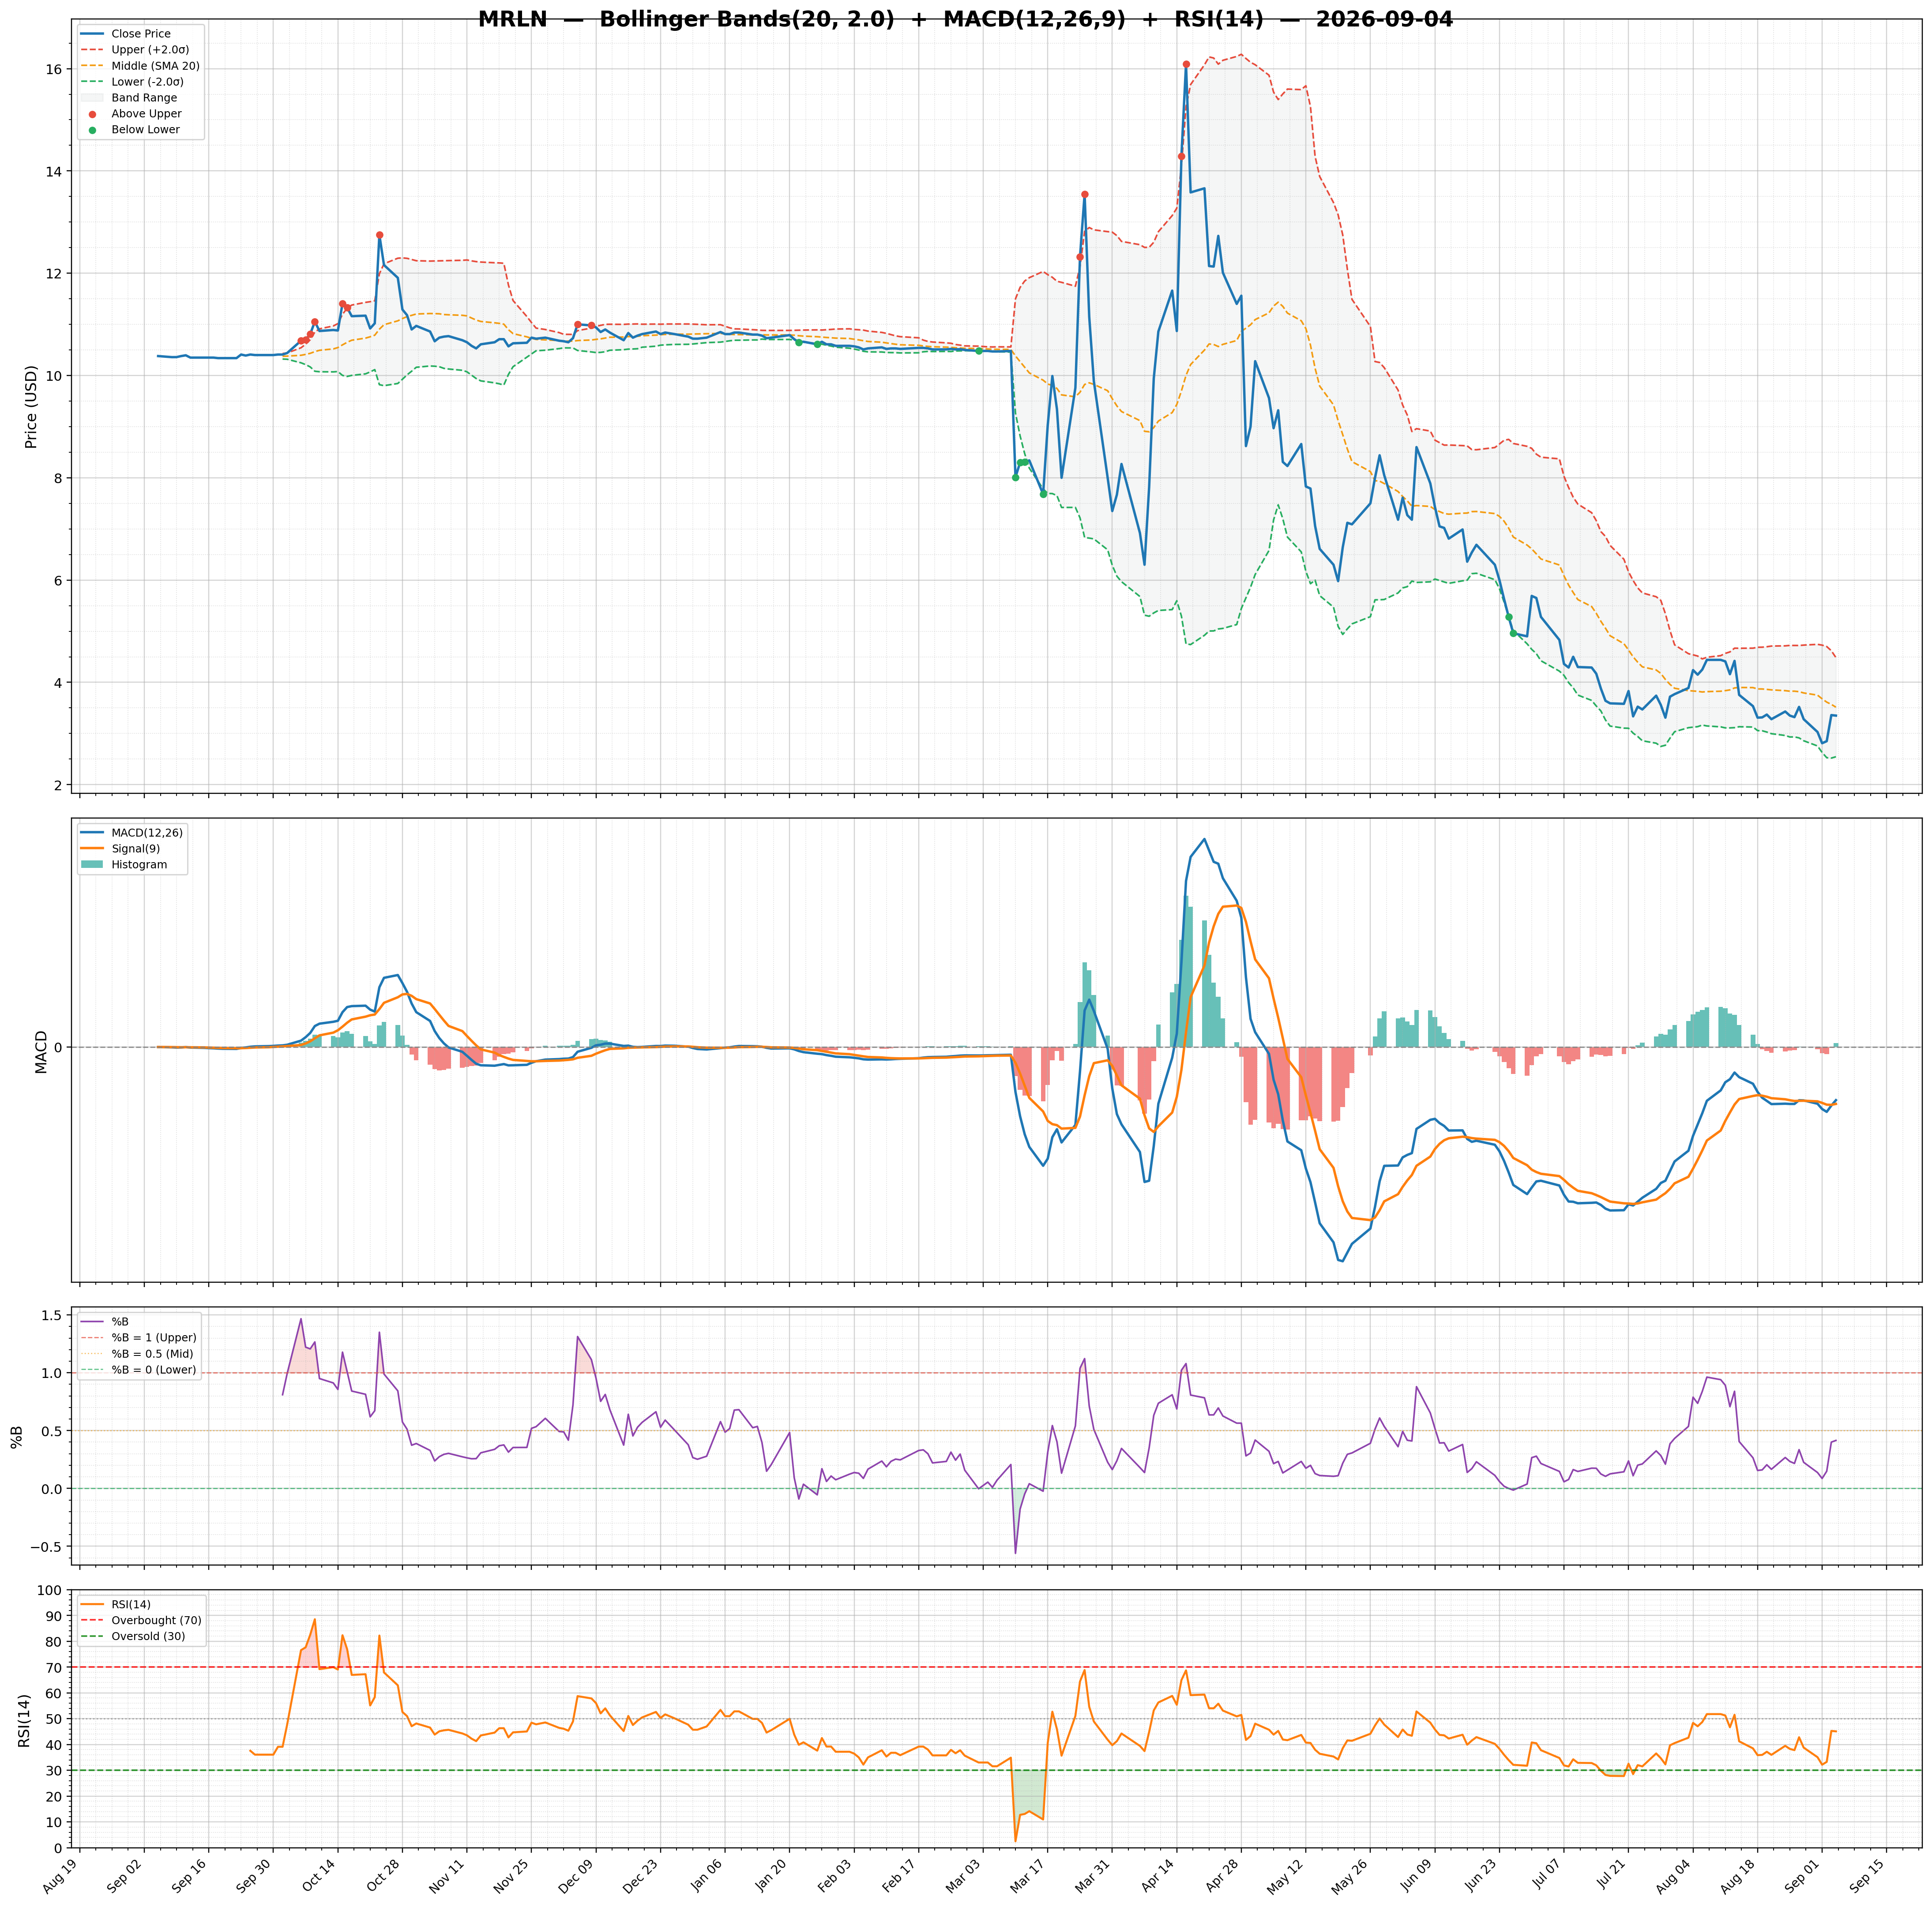
| MACD | -0.41 | Lower Band | 0.70 | Target Low | $4.00 |
| MACD Signal | -0.42 | Middle Band | 1.39 | Target Median | $8.25 |
| Histogram | 0.01 | Upper Band | 2.08 | Analysts | 6 |
| Previous Histogram | 0.02 | Bandwidth | 98.620 | Upside | 622.98% |
| Histogram Trend | Decreasing | %B | 0.09 | ||