Niagen Bioscience, Inc. (NAGE)
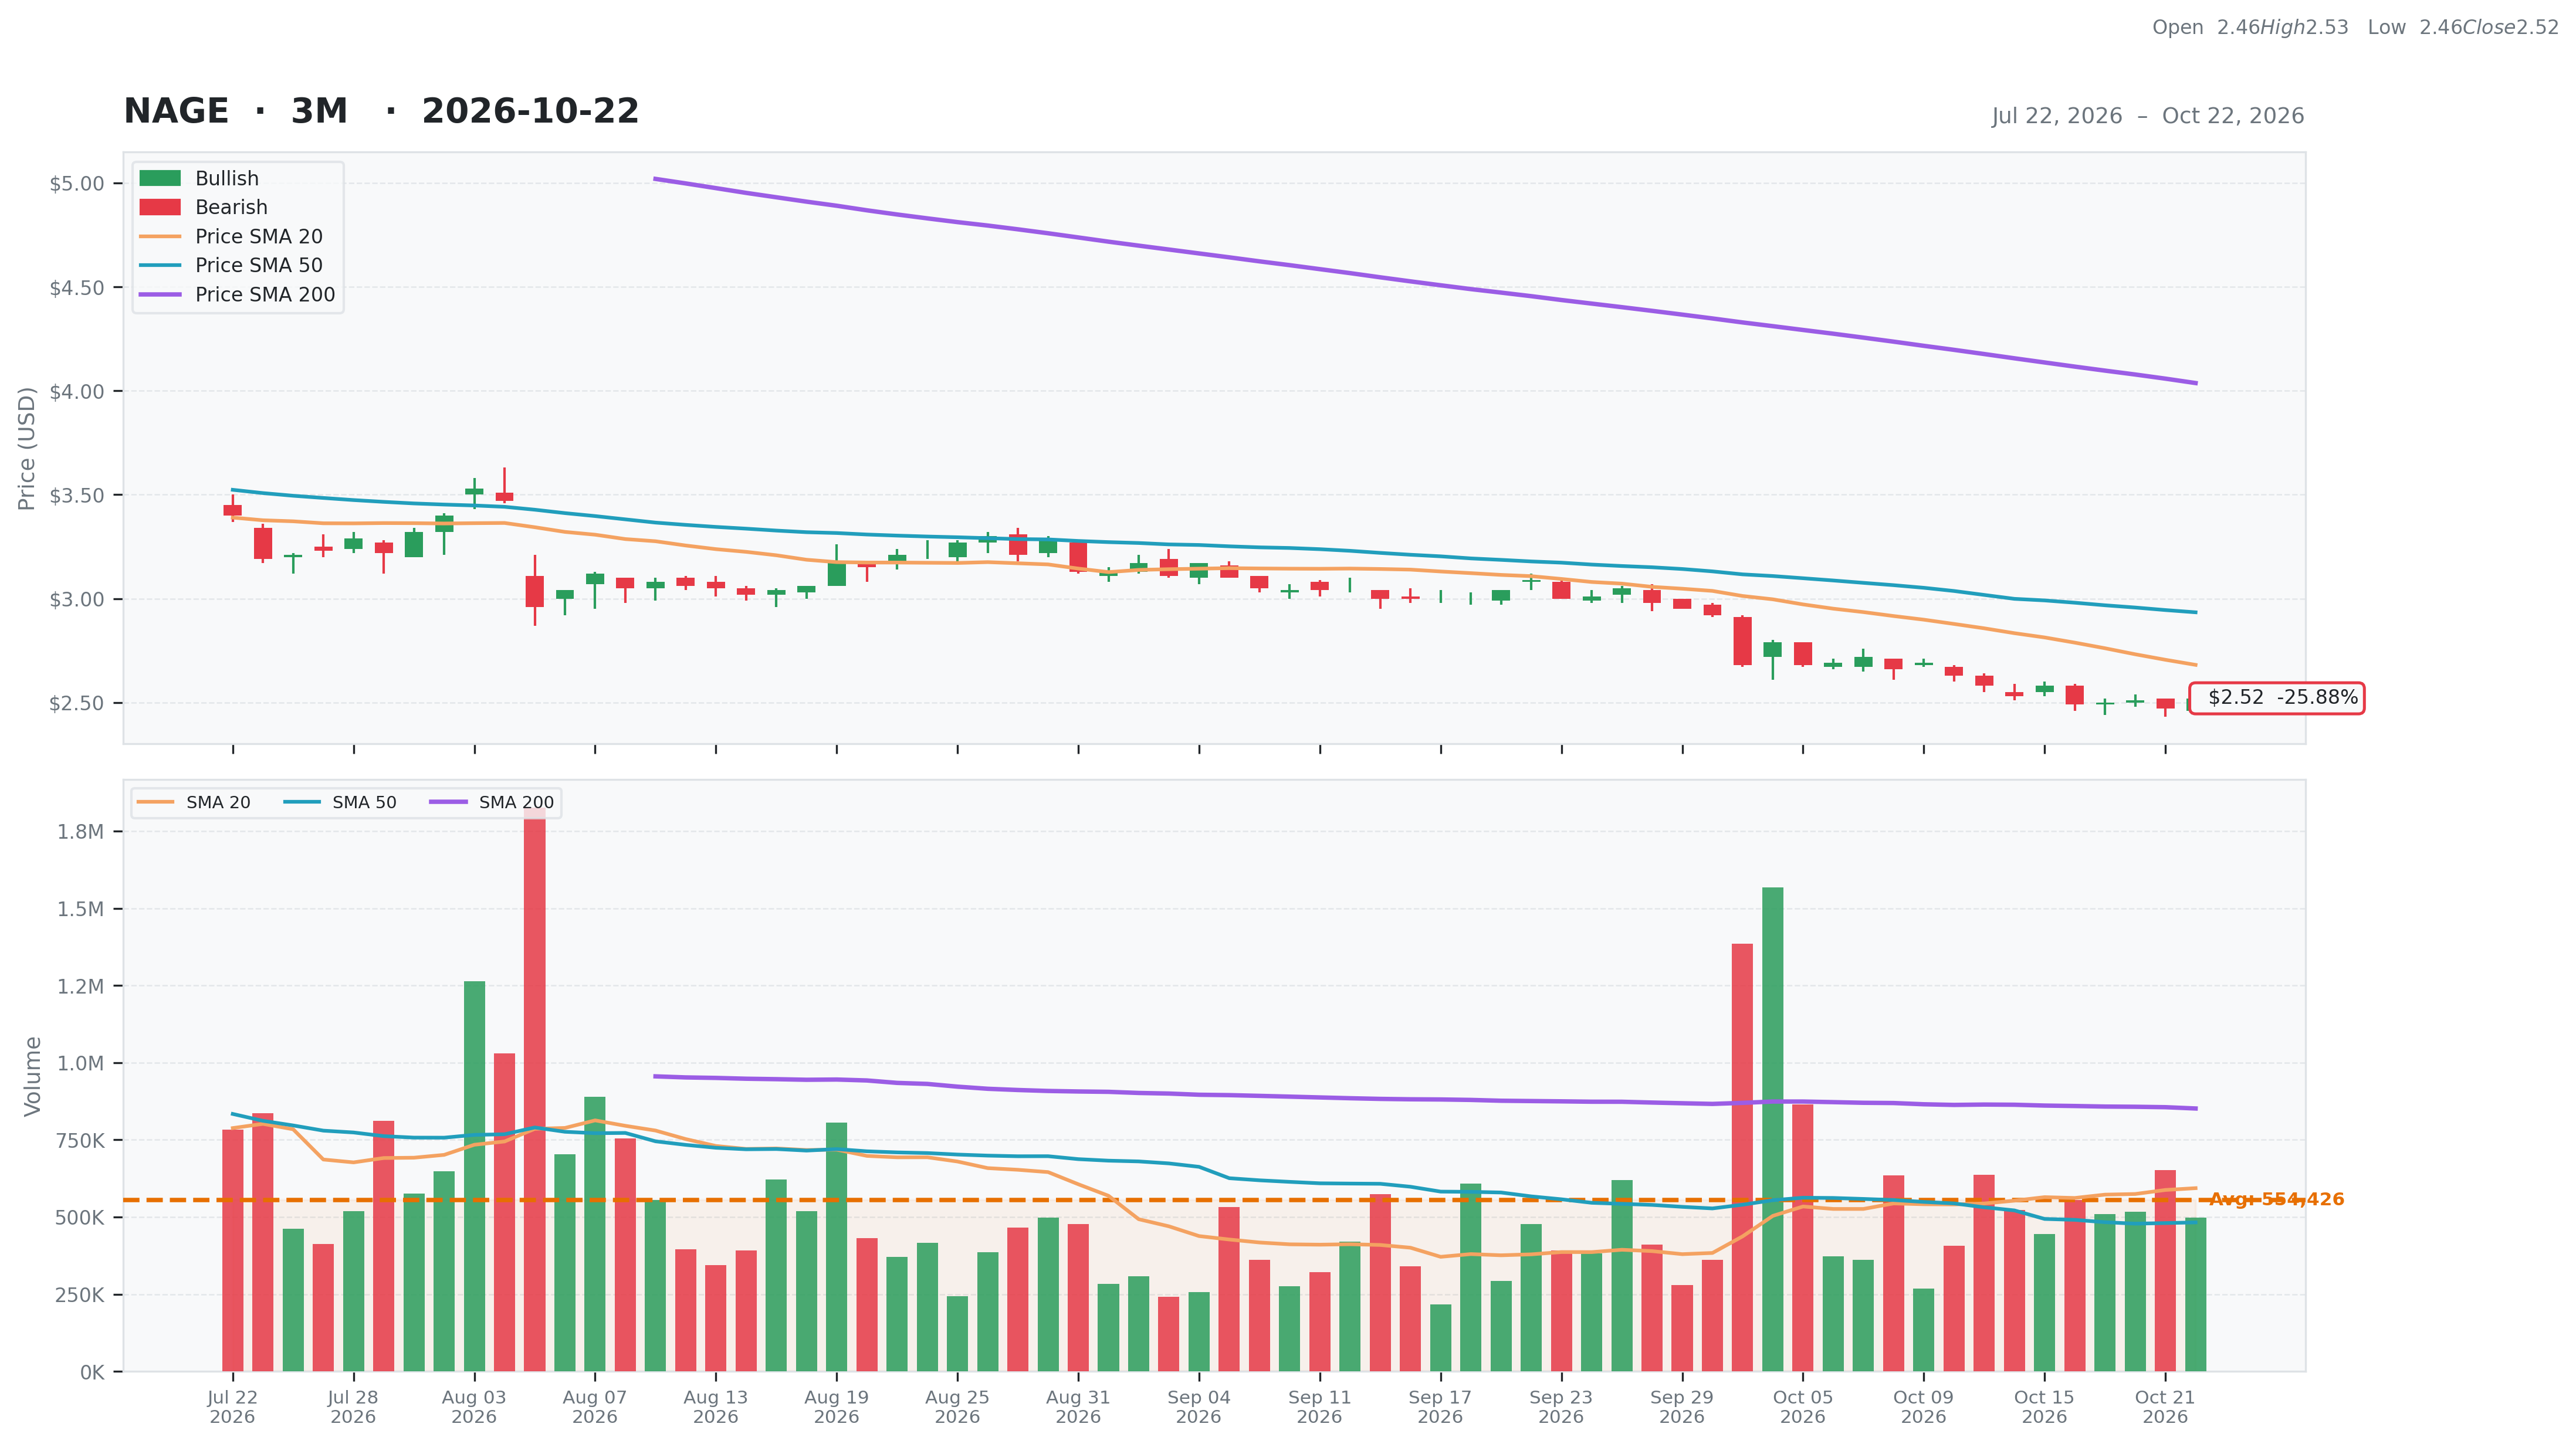
Consumer Defensive • Packaged Foods • $2.52 • MCap: 197,023,744
https://www.niagenbioscience.com • Niagen Bioscience, Inc. operates as a bioscience company engages in developing healthy aging products. The company operates through Consumer products; Ingredients; and Pharmaceutical Segments. It provides finished dietary supplement products that contain its proprietary ingredients directly to consumers and distributors; nicotinamide adenine dinucleotide (NAD+), an essential coenzyme that regulates cellular metabolism; and develops and commercializes proprietary-based ingredient technologies, including food-grade, Niagen, and pharmaceutical-grade Niagen and supplies these ingredients as raw materials to the manufacturers of consumer products. In addition, it commercializes NAD+ precursor nicotinamide riboside as the flagship ingredient under NIAGEN brand name. The company distributes TRU NIAGEN products direct to consumers through its propriety e-commerce platform TRUNIAGEN.com, Amazon, and other internet marketplaces, as well as specialty retailers and authorized healthcare practitioners resellers. The company was formerly known as ChromaDex Corporation and changed its name to Niagen Bioscience, Inc. in March 2025. Niagen Bioscience, Inc. was founded in 1999 and is headquartered in Los Angeles, California.
ET
| Score | Price | 52 Week & Averages | Relative Strength | Risk | |||||
|---|---|---|---|---|---|---|---|---|---|
| Total | 53 | Current | $2.52 | 52W High | $7.60 -66.84% | Relative Strength | -0.43 | Beta | 2.02 |
| Business Quality | 15 | Weekly | $2.58 -2.33% | 52W Low | $2.47 2.02% | 3M | -0.21 | Short % | 0.08 |
| Financial Strength | 16 | Monthly | $3.09 -18.45% | Above 50DMA | $2.93 -14.11% | 6M | -0.47 | Risk Score | 5 |
| Growth Outlook | 0 | Quarterly | $3.21 -21.50% | Above 200DMA | $4.04 -37.58% | 9M | -0.60 | ||
| Momentum | 3 | Yearly | $7.60 -66.84% | 12M | -0.67 | ||||
| Valuation | Financial Strength | Growth/Profitability | |||
|---|---|---|---|---|---|
| Trailing P/E | 13.11 | Cash | 67M | Revenue Growth | -0.04% |
| Forward P/E | -41.50 | Debt | 2M | Earnings Growth | -0.75% |
| PEG Ratio | N/A | Debt/Equity | 2.82 | Qtr Earnings Growth | -0.73% |
| Price/Sales | 1.53 | Current Ratio | 6.50 | Gross Margin | 0.64% |
| Price/Book | 2.39 | Quick Ratio | 5.00 | Operating Margin | 0.02% |
| EV/Revenue | 1.03 | Operating CF | 6M | Profit Margin | 0.12% |
| EV/EBITDA | 13.80 | Free CF | 2M | EBITDA Margin | 0.07% |
| Ent Value | 132M | Return on Assets | 0.05% | ||
| Return on Equity | 0.22% | ||||
| Technical | Volume & Bollinger Bands | Analyst | |||
|---|---|---|---|---|---|
| RSI | 34.34 | Volume | 0.56M | Rating | strong_buy |
| Previous RSI | 29.36 | Avg Volume 20D | 0.59M | Target Mean | $12.08 |
| RSI Trend | Up | Relative Volume | 0.94 | Target High | $22.00 |
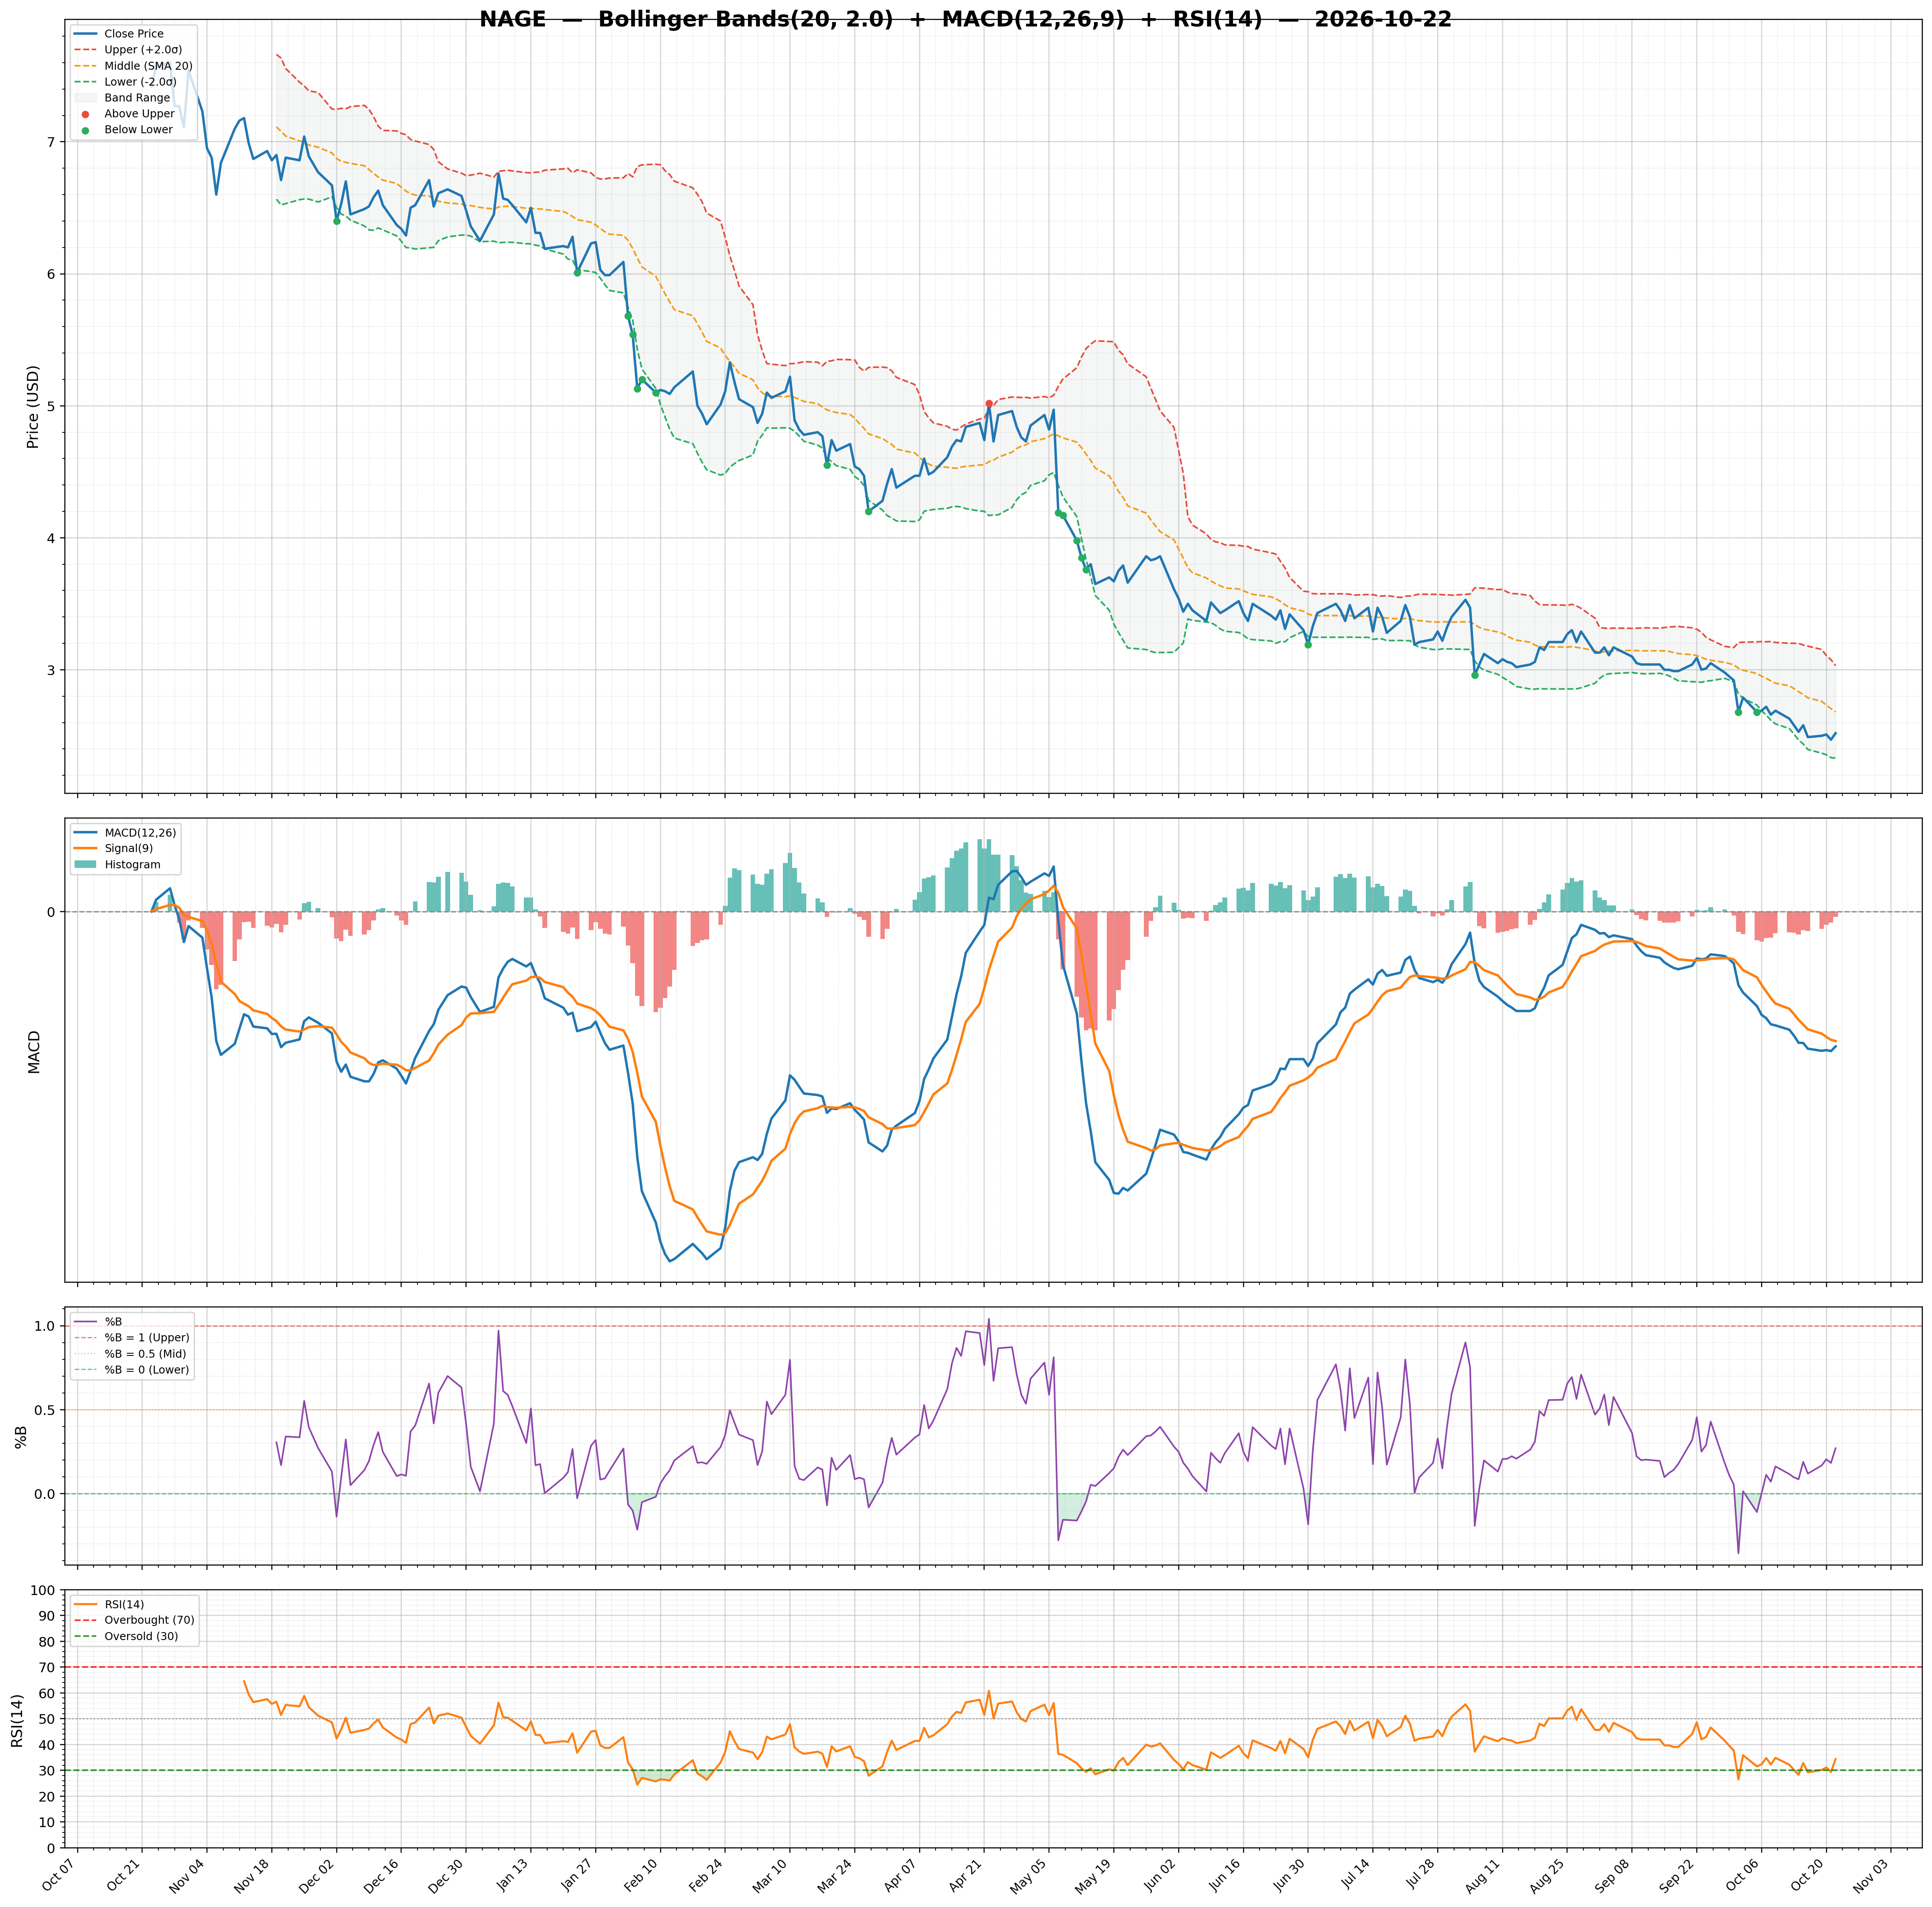
| MACD | -0.14 | Lower Band | 2.33 | Target Low | $8.50 |
| MACD Signal | -0.13 | Middle Band | 2.68 | Target Median | $10.50 |
| Histogram | -0.00 | Upper Band | 3.03 | Analysts | 6 |
| Previous Histogram | -0.01 | Bandwidth | 26.150 | Upside | 385.27% |
| Histogram Trend | Increasing | %B | 0.27 | ||