NACCO Industries, Inc. (NC)
Energy • Thermal Coal • $33.46 • MCap: 258,492,096
https://nacco.com • NACCO Industries, Inc., together with its subsidiaries, engages in the natural resources business. The company operates through three segments: Utility Coal Mining, Contract Mining, and Minerals and Royalties. The Utility Coal Mining operates surface coal mines under long-term contracts for power plants and a synfuels plant. This segment operates coal mines in North Dakota and Mississippi. The Contract Mining segment provides value-added contract mining and other services for producers of industrial minerals and products; contract mining services for independently owned mines and quarries in Florida, Arkansas, and Nebraska; and dragline services. The Minerals and Royalties segment is involved in the leasing of its royalty and mineral interests to third-party exploration and production companies, and other mining companies, which grants them the rights to explore, develop, mine, produce, market, and sell gas, oil, and coal. The company also provides natural resource restoration and reclamation services that include stream and wetland mitigation solutions. NACCO Industries, Inc. was founded in 1913 and is headquartered in Cleveland, Ohio.
AAII
Joie
| Score | Price | 52 Week & Averages | Relative Strength | Risk | |||||
|---|---|---|---|---|---|---|---|---|---|
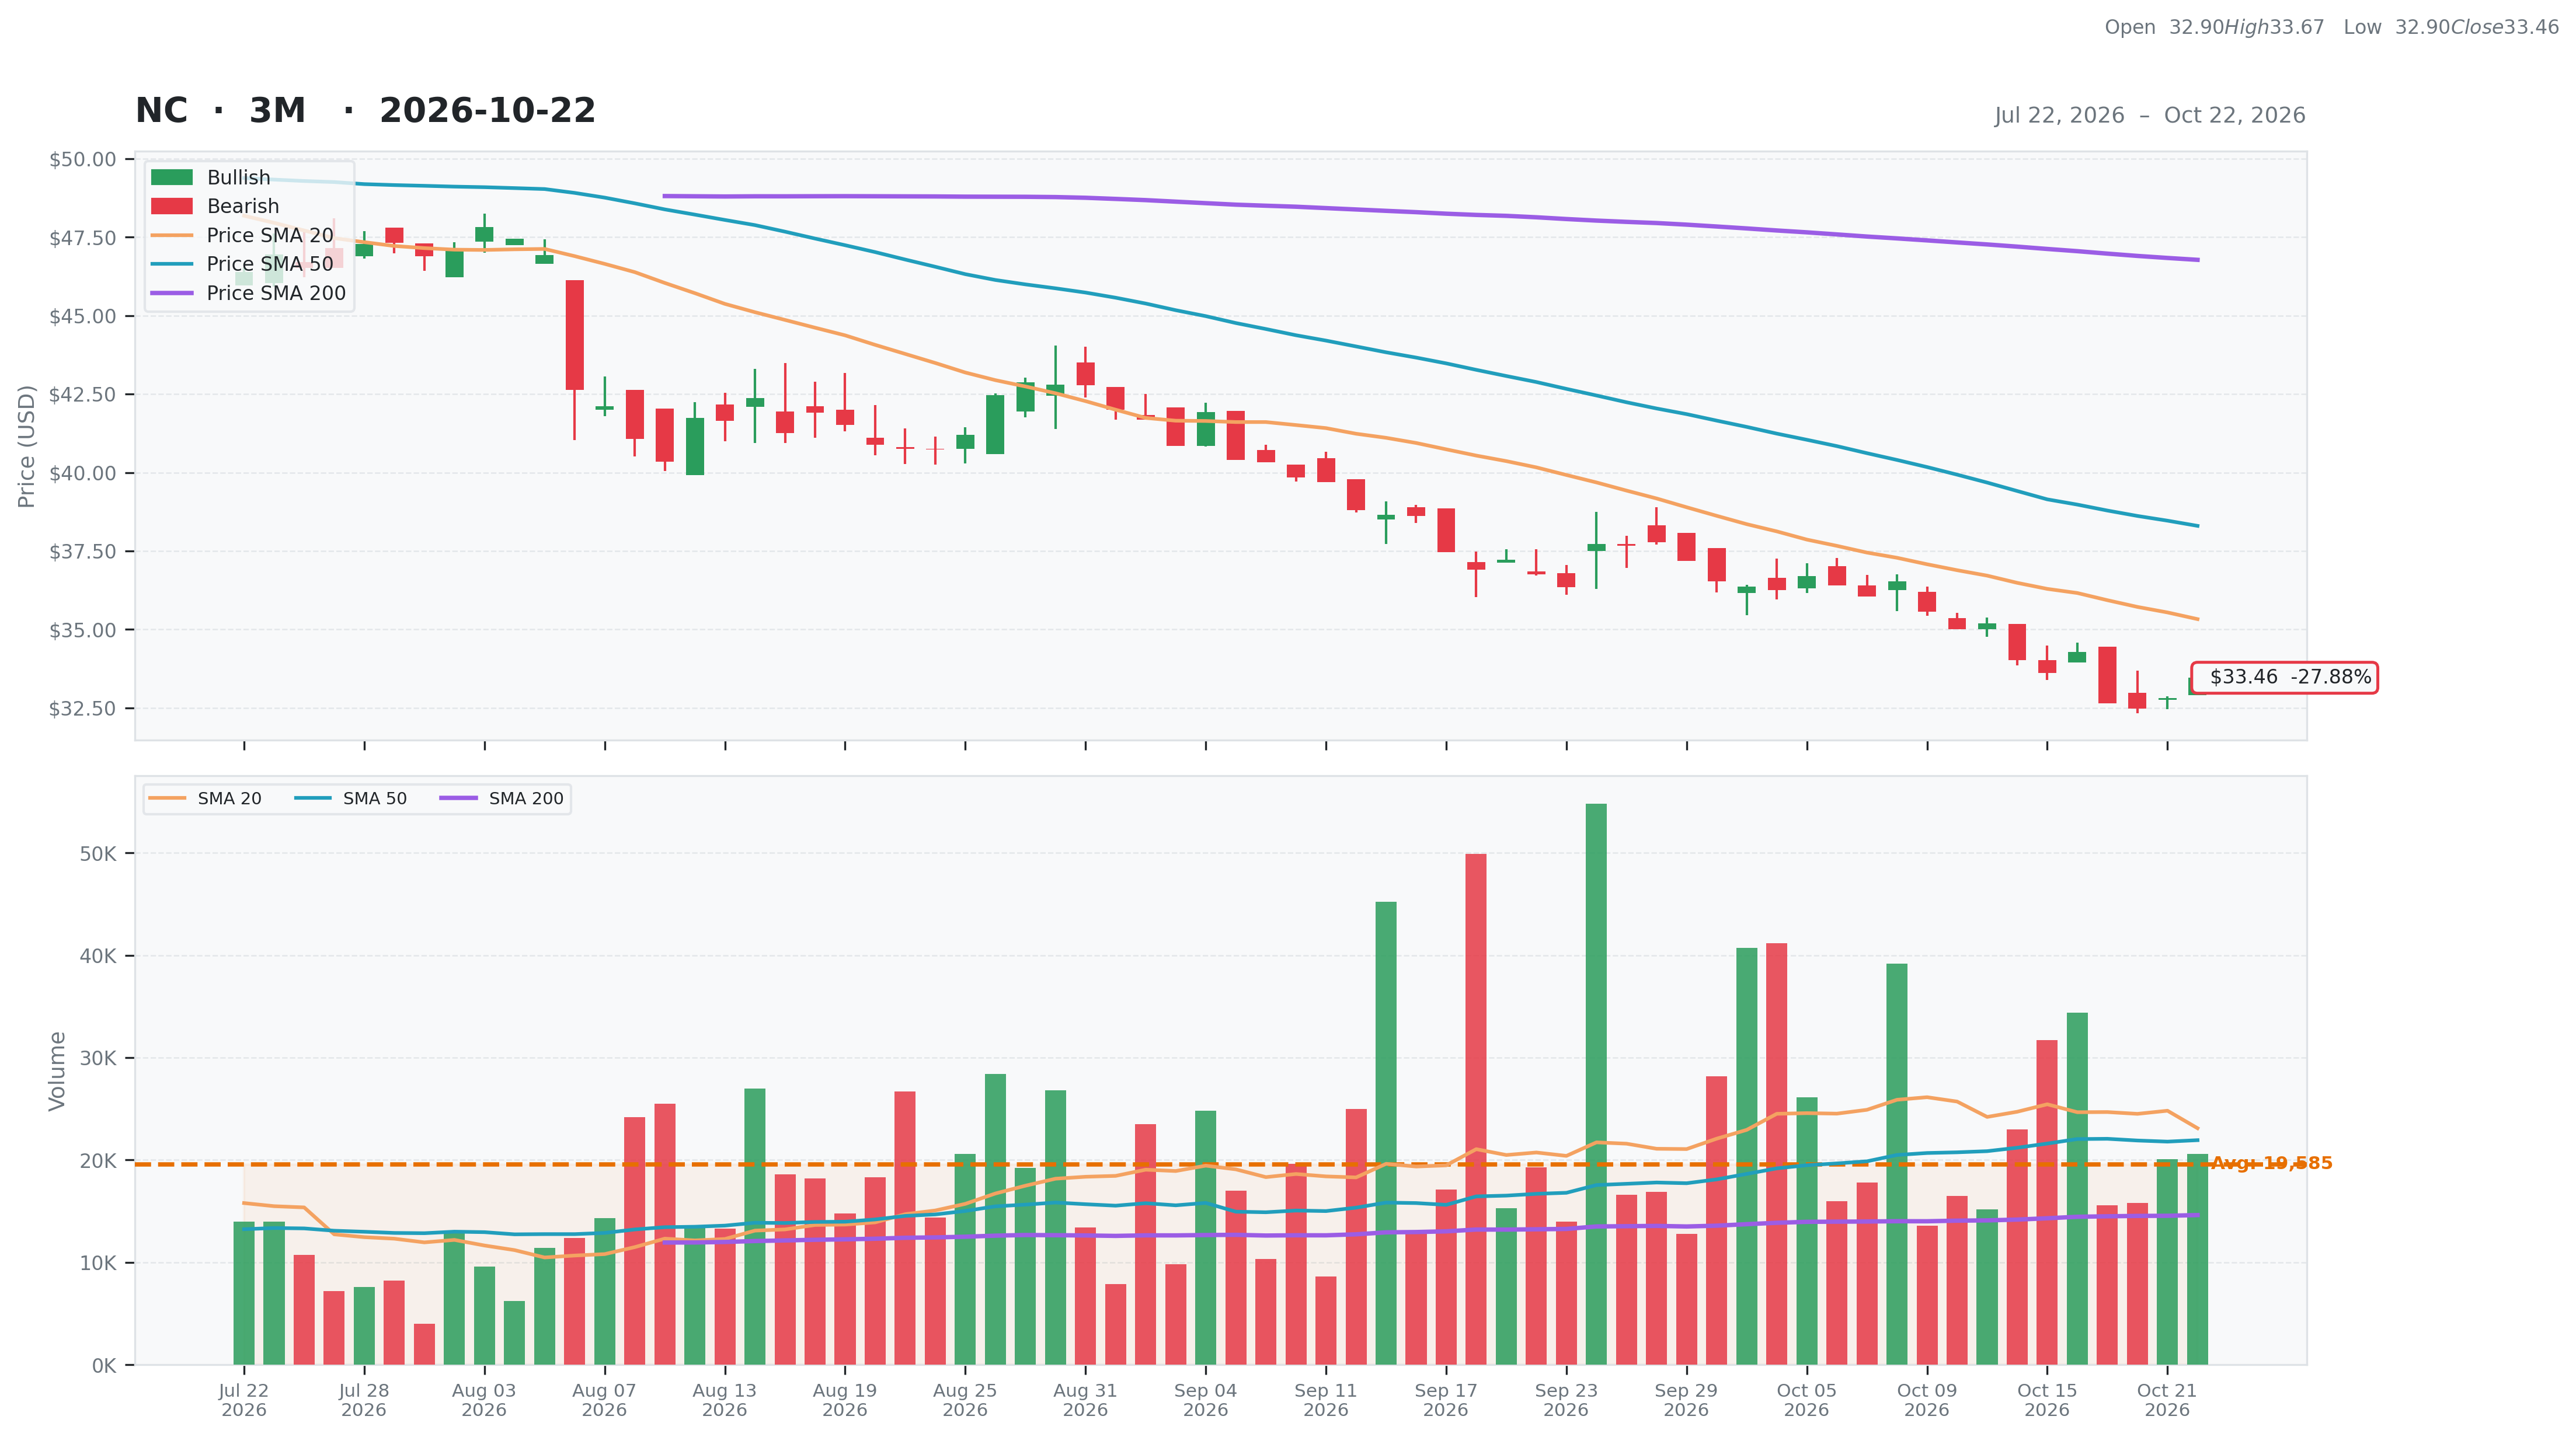
| Total | 40 | Current | $33.46 | 52W High | $58.18 -42.49% | Relative Strength | -0.28 | Beta | 0.56 |
| Business Quality | 3 | Weekly | $33.62 -0.48% | 52W Low | $32.47 3.05% | 3M | -0.28 | Short % | 0.02 |
| Financial Strength | 11 | Monthly | $36.75 -8.95% | Above 50DMA | $38.30 -12.64% | 6M | -0.30 | Risk Score | 9 |
| Growth Outlook | 1 | Quarterly | $46.52 -28.08% | Above 200DMA | $46.78 -28.47% | 9M | -0.32 | ||
| Momentum | 0 | Yearly | $41.16 -18.70% | 12M | -0.22 | ||||
| Valuation | Financial Strength | Growth/Profitability | |||
|---|---|---|---|---|---|
| Trailing P/E | 14.90 | Cash | 46M | Revenue Growth | 0.06% |
| Forward P/E | N/A | Debt | 127M | Earnings Growth | N/A |
| PEG Ratio | 0.30 | Debt/Equity | 29.14 | Qtr Earnings Growth | N/A |
| Price/Sales | 0.93 | Current Ratio | 3.30 | Gross Margin | 0.18% |
| Price/Book | 0.59 | Quick Ratio | 1.57 | Operating Margin | -0.06% |
| EV/Revenue | 1.22 | Operating CF | 74M | Profit Margin | 0.06% |
| EV/EBITDA | -71.45 | Free CF | -56M | EBITDA Margin | -0.02% |
| Ent Value | 340M | Return on Assets | -0.03% | ||
| Return on Equity | 0.04% | ||||
| Technical | Volume & Bollinger Bands | Analyst | |||
|---|---|---|---|---|---|
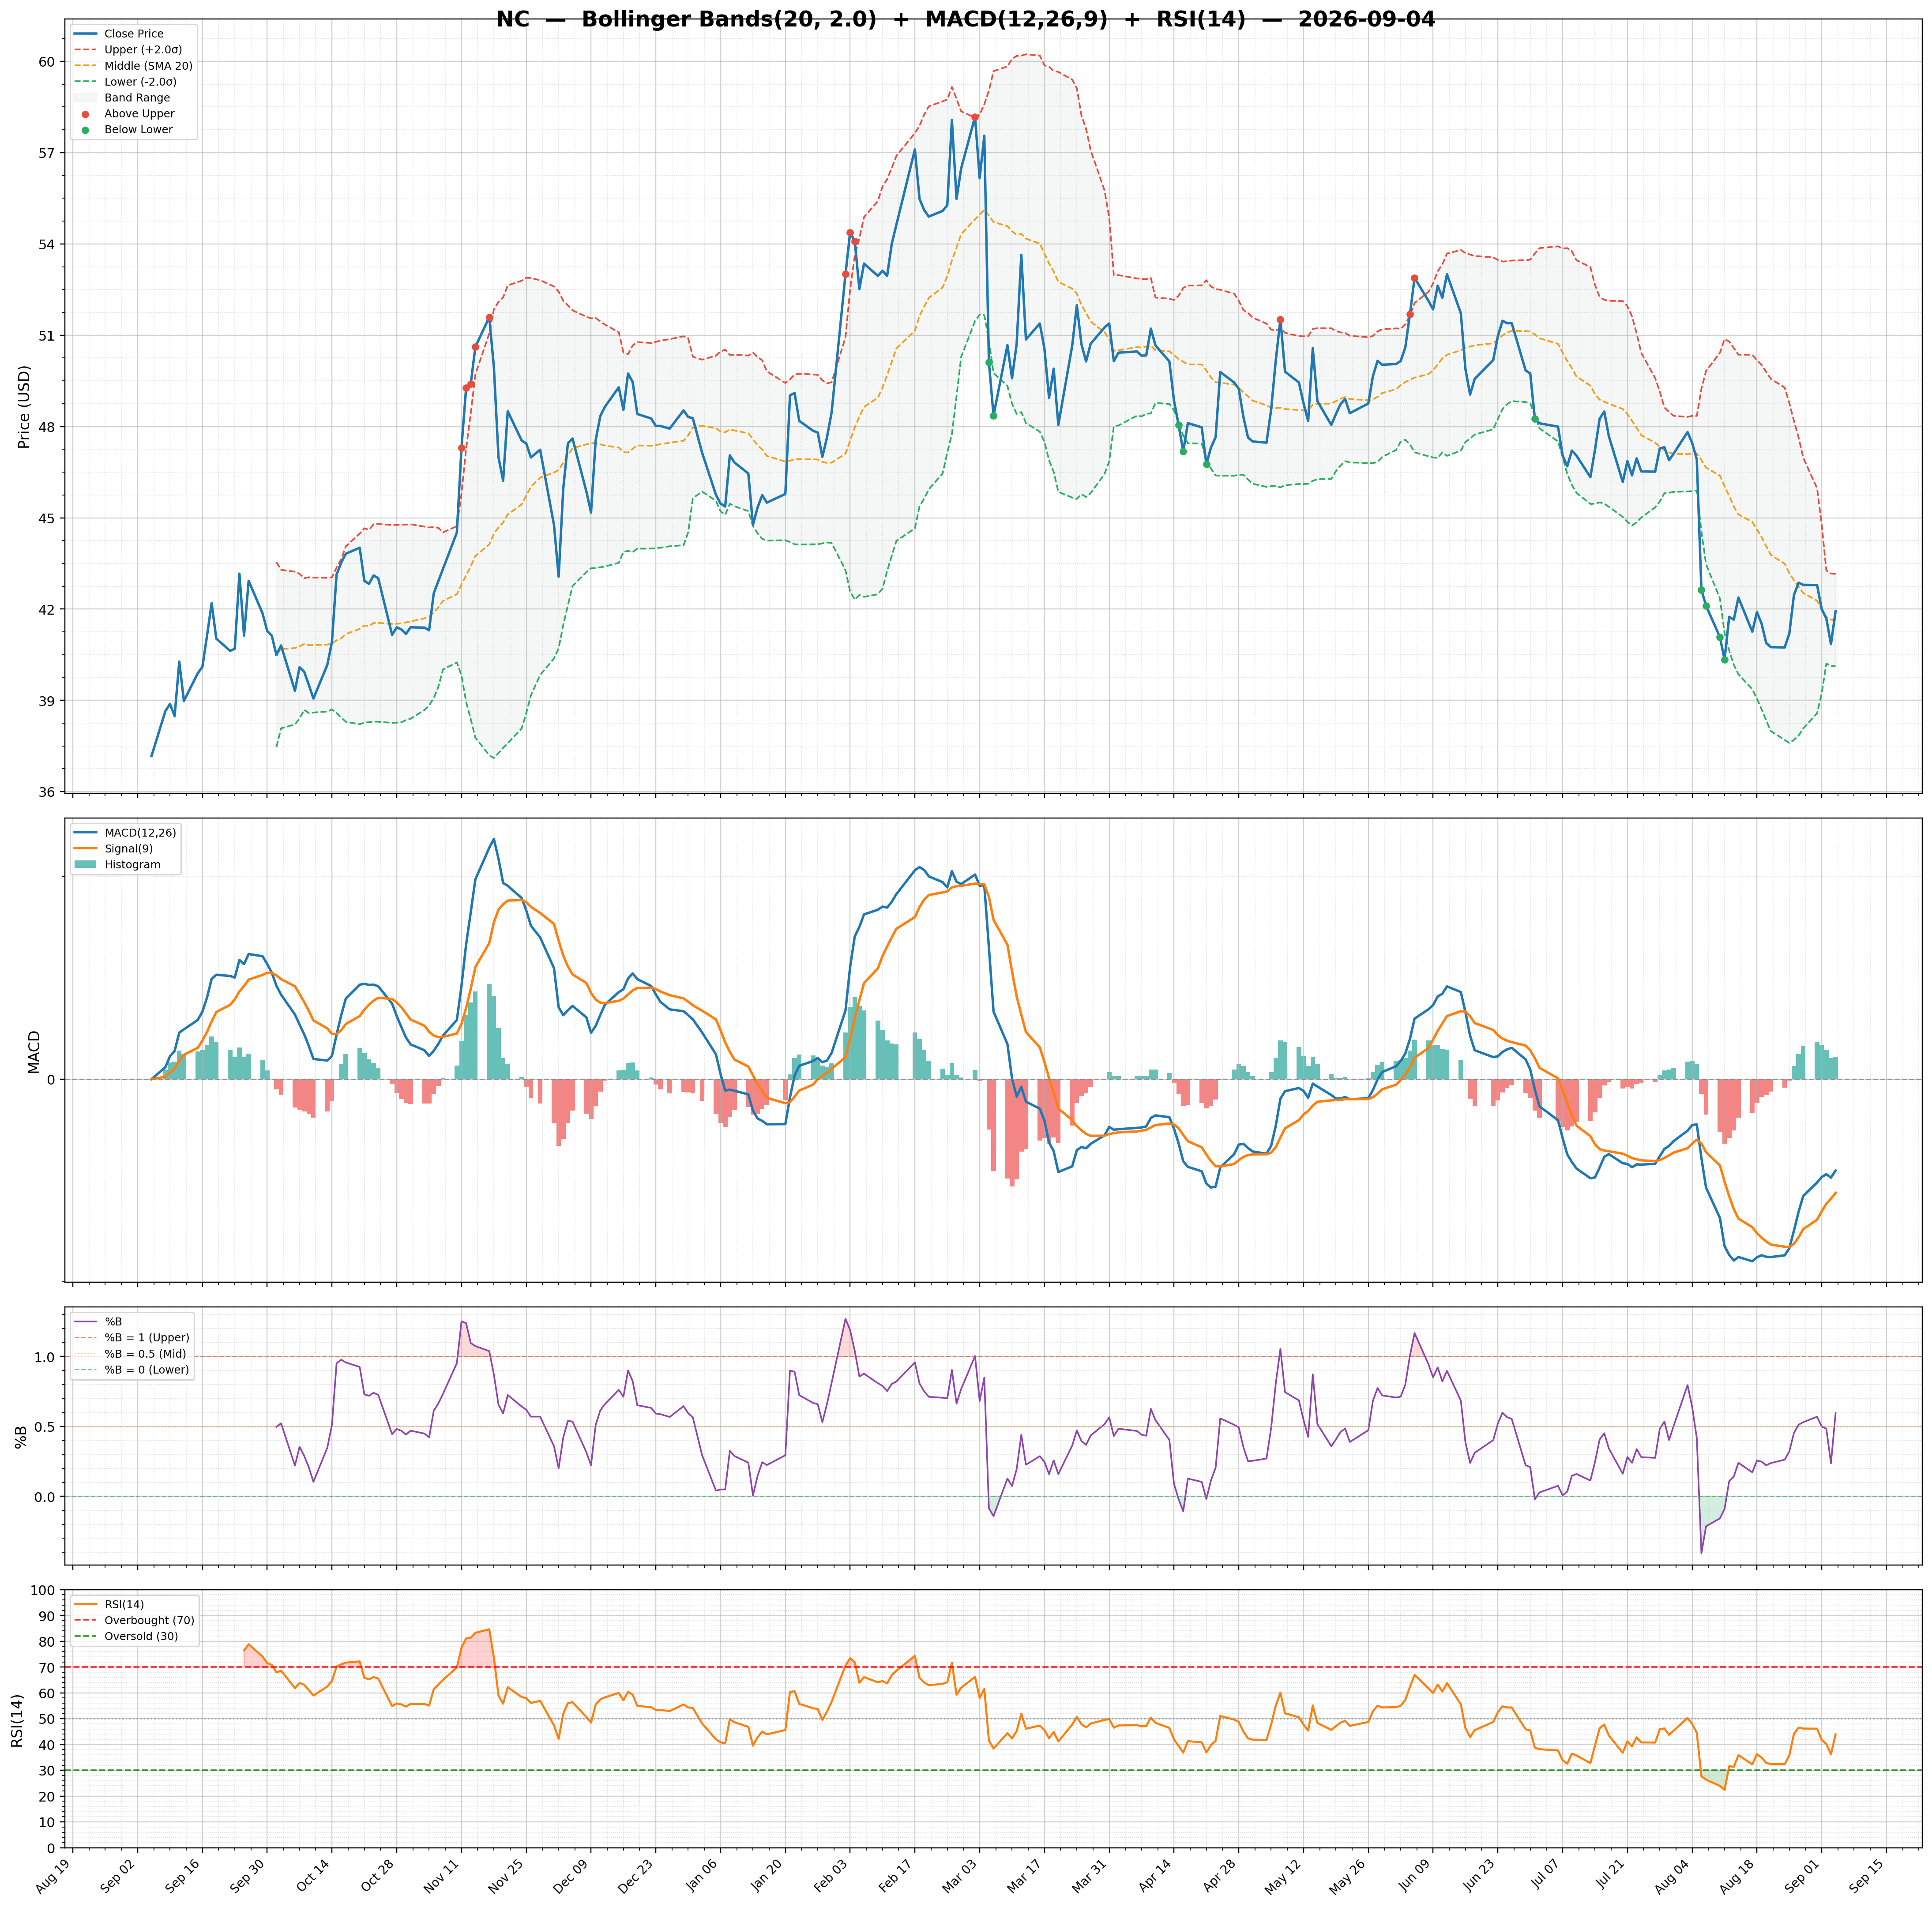
| RSI | 33.86 | Volume | 0.03M | Rating | none |
| Previous RSI | 28.11 | Avg Volume 20D | 0.02M | Target Mean | N/A |
| RSI Trend | Up | Relative Volume | 0.85 | Target High | N/A |
| MACD | -1.60 | Lower Band | 31.94 | Target Low | N/A |
| MACD Signal | -1.52 | Middle Band | 35.33 | Target Median | N/A |
| Histogram | -0.08 | Upper Band | 38.71 | Analysts | N/A |
| Previous Histogram | -0.16 | Bandwidth | 19.170 | Upside | N/A |
| Histogram Trend | Increasing | %B | 0.22 | ||