Norwegian Cruise Line Holdings (NCLH)
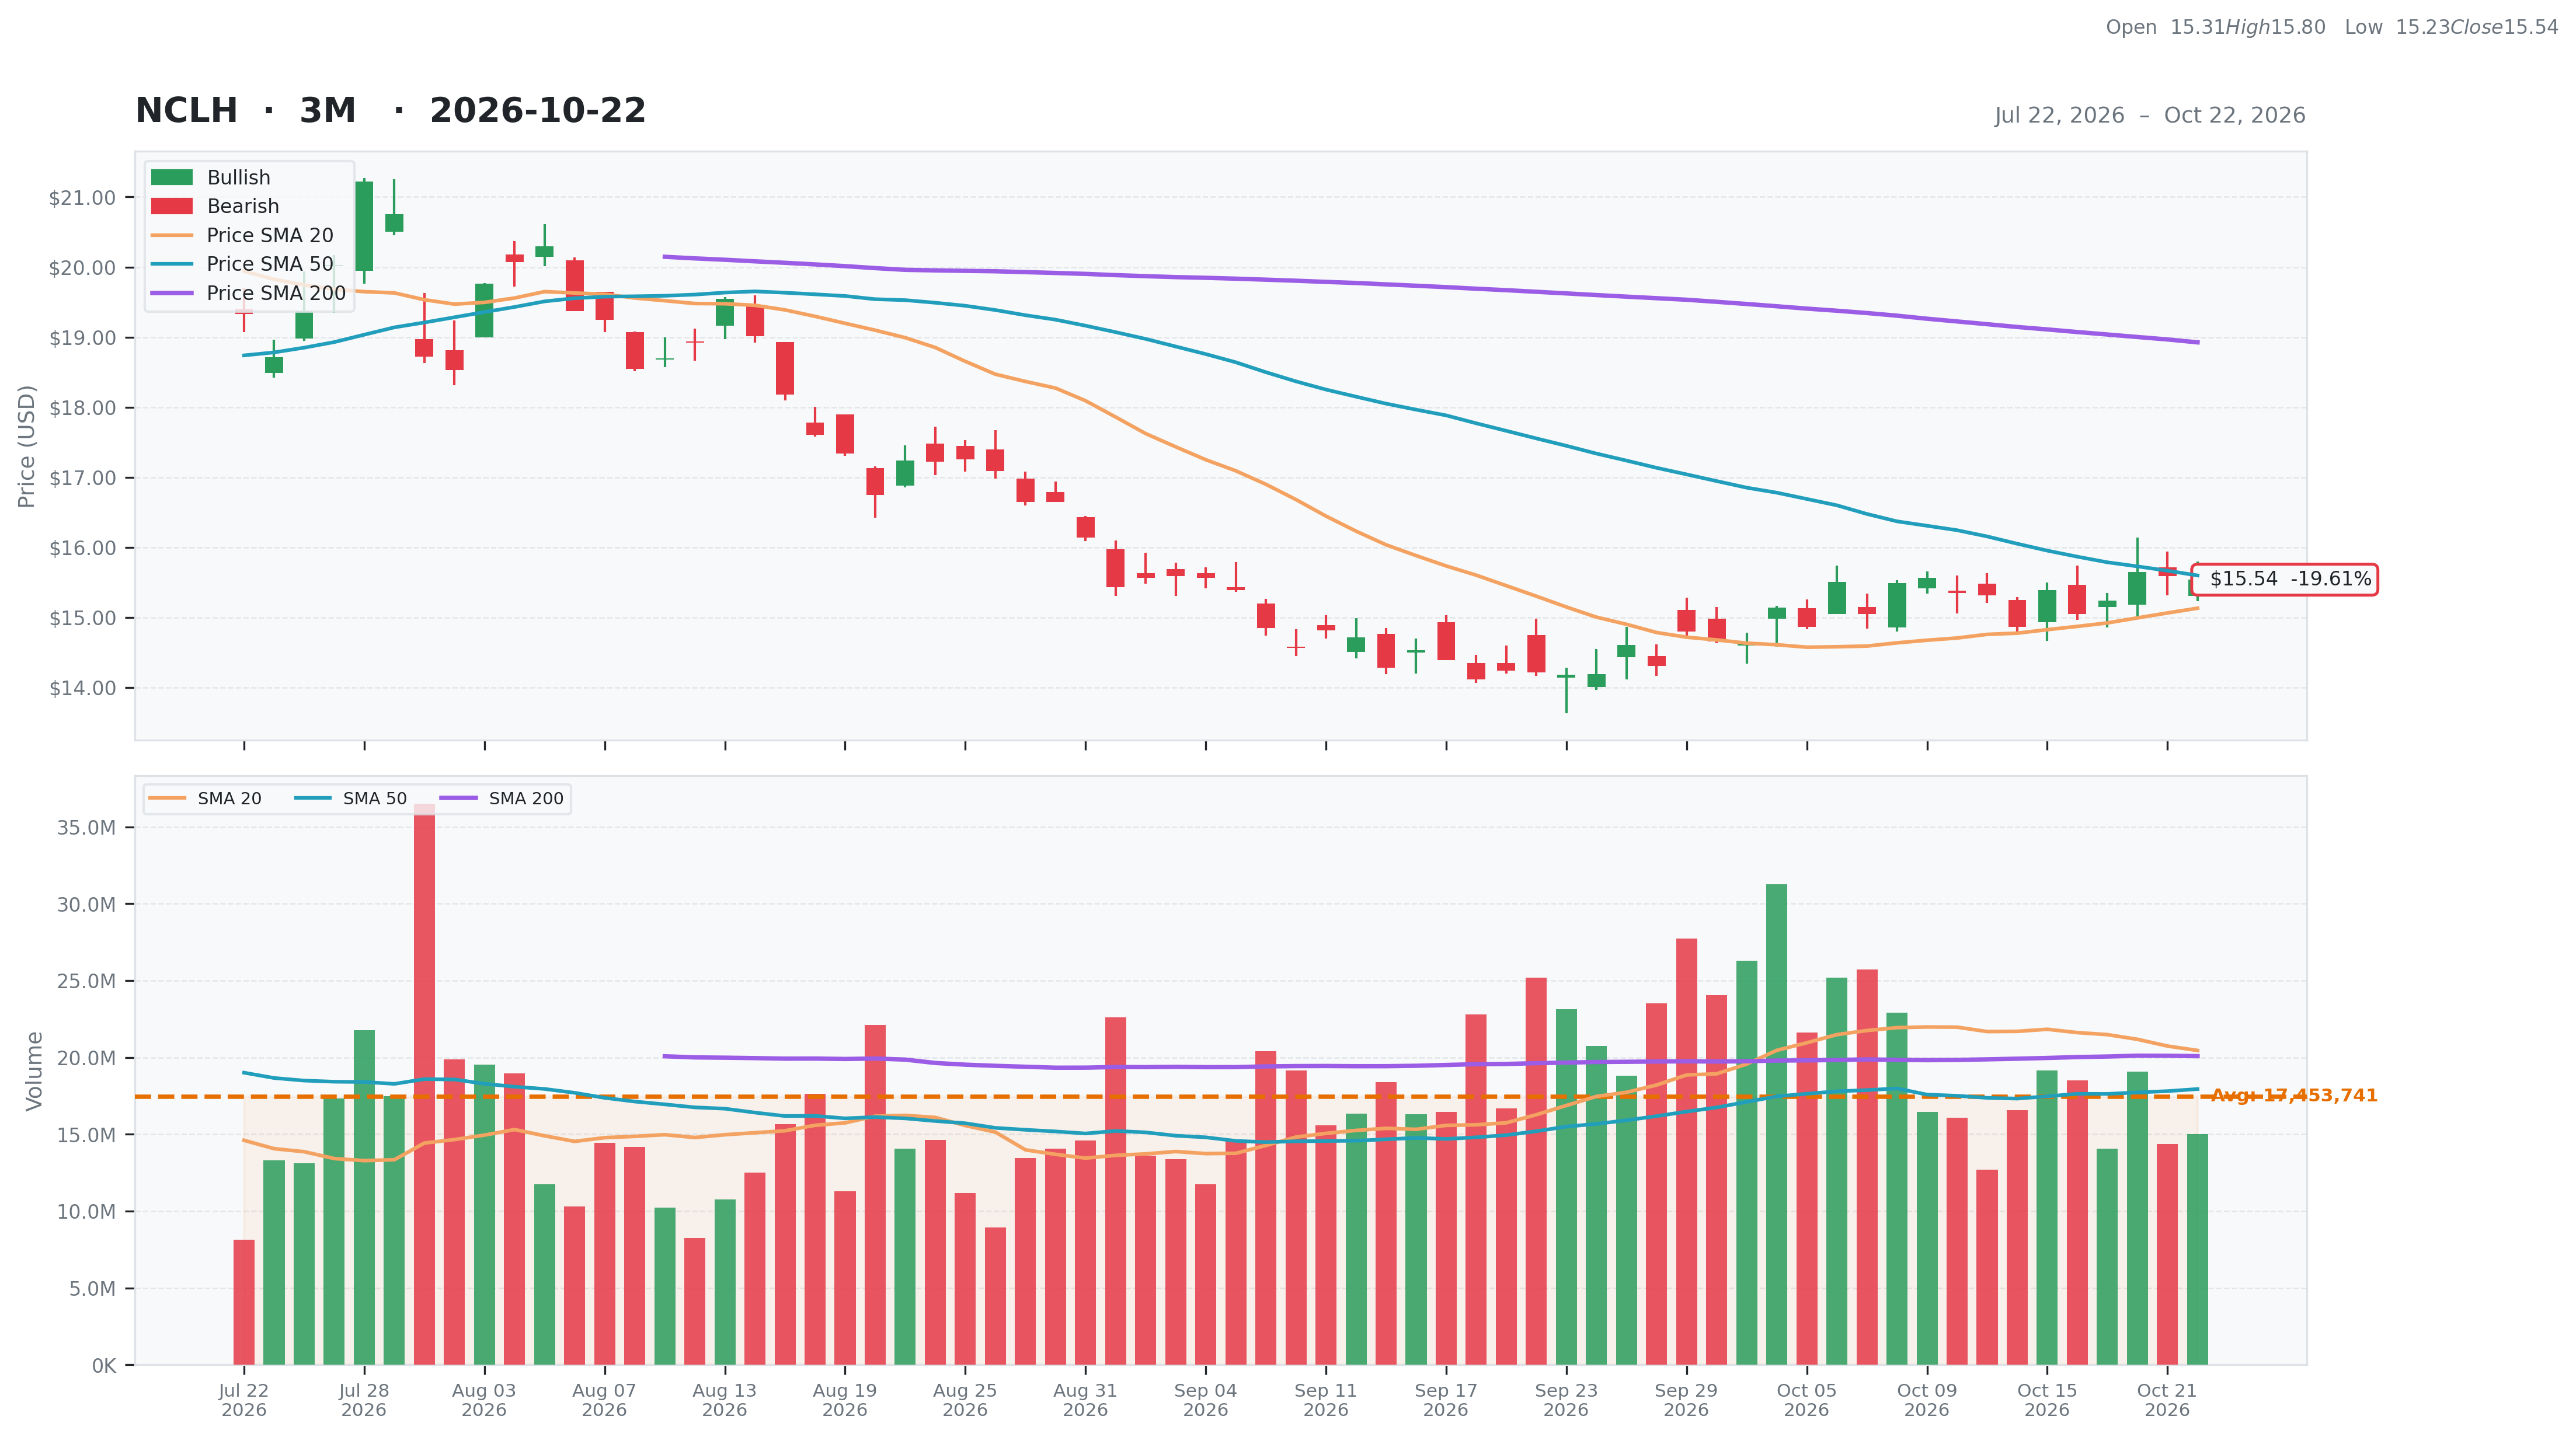
Consumer Cyclical • Travel Services • $15.54 • MCap: 6,910,776,832
https://www.nclhltd.com • Norwegian Cruise Line Holdings Ltd., together with its subsidiaries, operates as a cruise company in North America, Europe, the Asia-Pacific, and internationally. It offers itineraries to destinations, such as Europe, Asia, Australia, New Zealand, South America, Africa, Canada, Bermuda, the Caribbean, and Alaska; and inter-island itinerary in Hawaii. The company also provides features, amenities, and activities, including various accommodations, dining venues, bars and lounges, spas, casino and retail shopping areas, and entertainment choices; shore excursions at each port of call, and air transportation and hotel packages for stays before or after a voyage. It offers its products and services under the Norwegian Cruise Line, Oceania Cruises, and Regent Seven Seas Cruises brands. The company was founded in 1966 and is based in Miami, Florida.
Joie
| Score | Price | 52 Week & Averages | Relative Strength | Risk | |||||
|---|---|---|---|---|---|---|---|---|---|
| Total | 49 | Current | $15.54 | 52W High | $25.02 -37.89% | Relative Strength | -0.23 | Beta | 1.96 |
| Business Quality | 14 | Weekly | $15.39 0.97% | 52W Low | $14.12 10.06% | 3M | -0.20 | Short % | 0.24 |
| Financial Strength | 5 | Monthly | $14.22 9.28% | Above 50DMA | $15.60 -0.38% | 6M | -0.16 | Risk Score | 5 |
| Growth Outlook | 11 | Quarterly | $19.37 -19.77% | Above 200DMA | $18.93 -17.89% | 9M | -0.25 | ||
| Momentum | 2 | Yearly | $23.51 -33.90% | 12M | -0.34 | ||||
| Valuation | Financial Strength | Growth/Profitability | |||
|---|---|---|---|---|---|
| Trailing P/E | 9.29 | Cash | 218M | Revenue Growth | 0.05% |
| Forward P/E | 9.85 | Debt | 15,979M | Earnings Growth | 6.16% |
| PEG Ratio | 1.29 | Debt/Equity | 621.05 | Qtr Earnings Growth | 6.42% |
| Price/Sales | 0.68 | Current Ratio | 0.20 | Gross Margin | 0.42% |
| Price/Book | 2.69 | Quick Ratio | 0.08 | Operating Margin | 0.14% |
| EV/Revenue | 2.23 | Operating CF | 2,110M | Profit Margin | 0.07% |
| EV/EBITDA | 8.74 | Free CF | -1,680M | EBITDA Margin | 0.26% |
| Ent Value | 22,671M | Return on Assets | 0.04% | ||
| Return on Equity | 0.37% | ||||
| Technical | Volume & Bollinger Bands | Analyst | |||
|---|---|---|---|---|---|
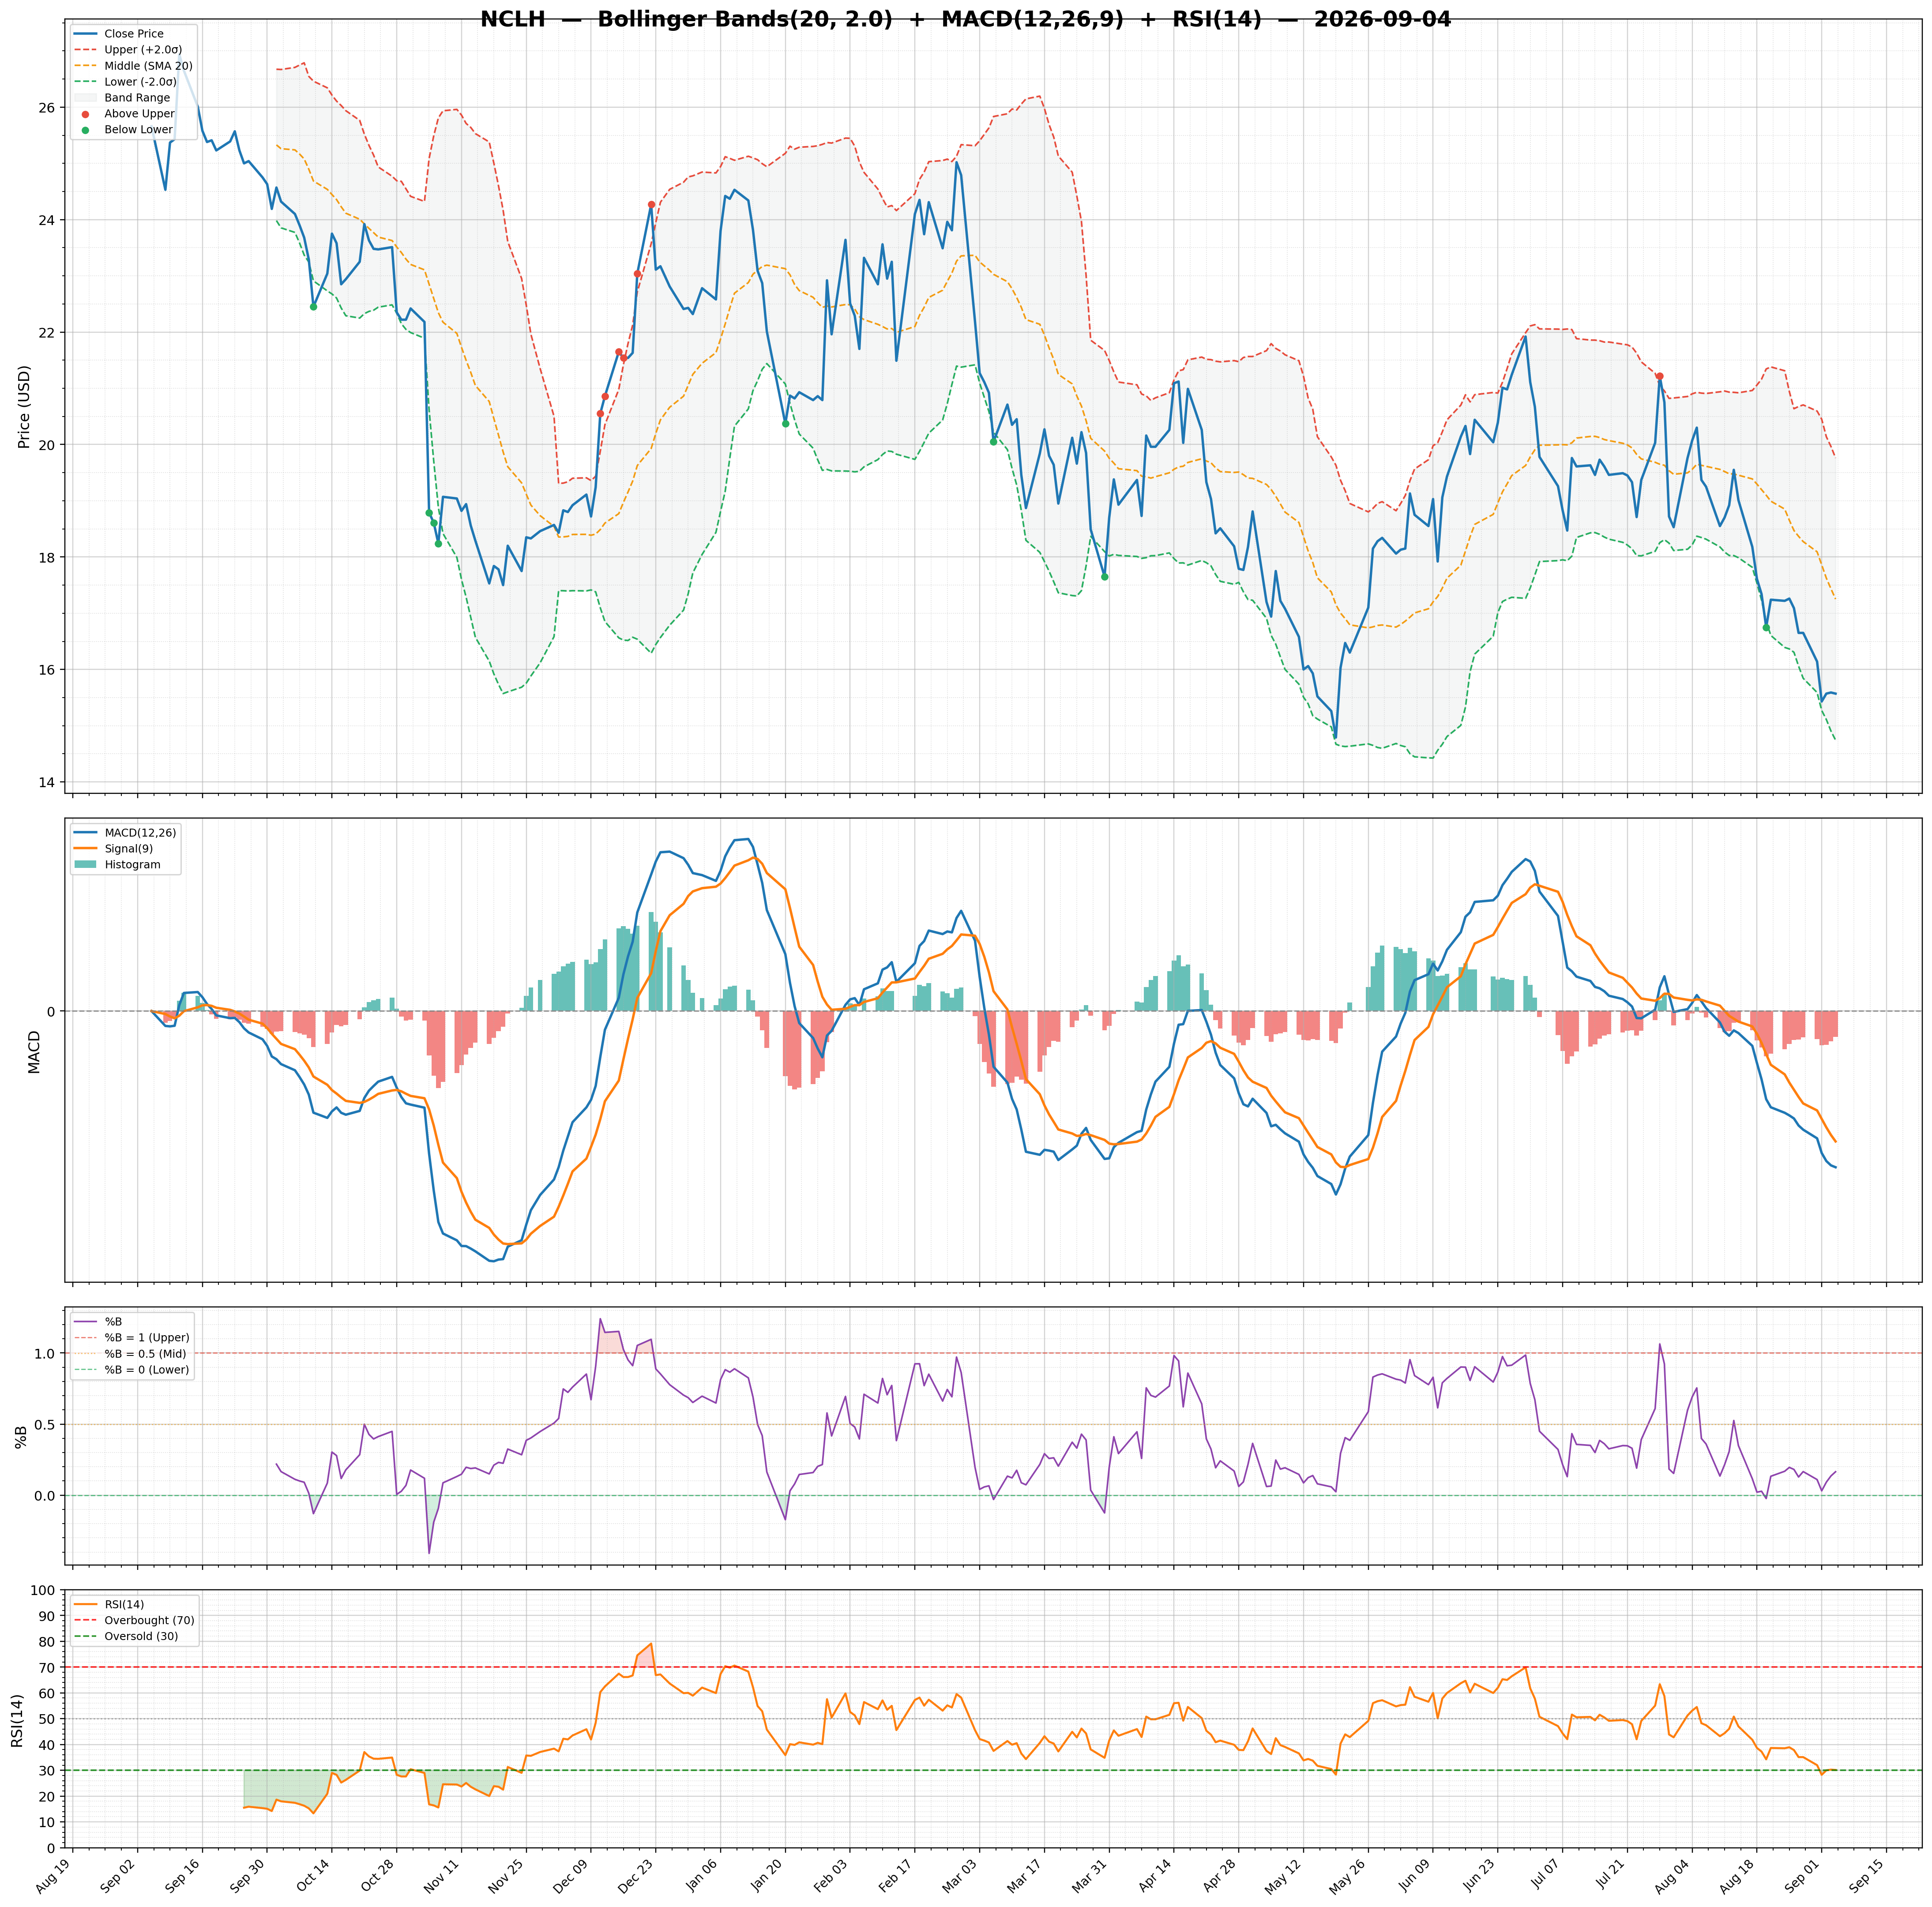
| RSI | 53.16 | Volume | 18.44M | Rating | buy |
| Previous RSI | 53.86 | Avg Volume 20D | 20.45M | Target Mean | $19.44 |
| RSI Trend | Down | Relative Volume | 0.75 | Target High | $32.00 |
| MACD | 0.02 | Lower Band | 14.34 | Target Low | $13.00 |
| MACD Signal | -0.10 | Middle Band | 15.13 | Target Median | $19.00 |
| Histogram | 0.12 | Upper Band | 15.92 | Analysts | 25 |
| Previous Histogram | 0.13 | Bandwidth | 10.400 | Upside | 29.17% |
| Histogram Trend | Decreasing | %B | 0.76 | ||