Natural Gas Services Group, Inc (NGS)
Energy • Oil & Gas Equipment & Services • $30.04 • MCap: 401,136,672
https://ngsgi.com • Natural Gas Services Group, Inc. provides natural gas compression equipment, flares and related assets; and electric compression equipment, technology and services to the energy industry in the United States. The company rents, designs, installs, service, and maintains natural gas engine and electric motor drive compressors for oil and gas production and processing facilities. It also designs and assembles compressor units for rental; and designs, engineers, and sells compressor components. In addition, the company provides aftermarket services for its compressors; and services related to the installation and start-up of new compressor units. Natural Gas Services Group, Inc. was incorporated in 1998 and is headquartered in Southlake, Texas.
AAII
NEW AAII Inv on Indicators
| Score | Price | 52 Week & Averages | Relative Strength | Risk | |||||
|---|---|---|---|---|---|---|---|---|---|
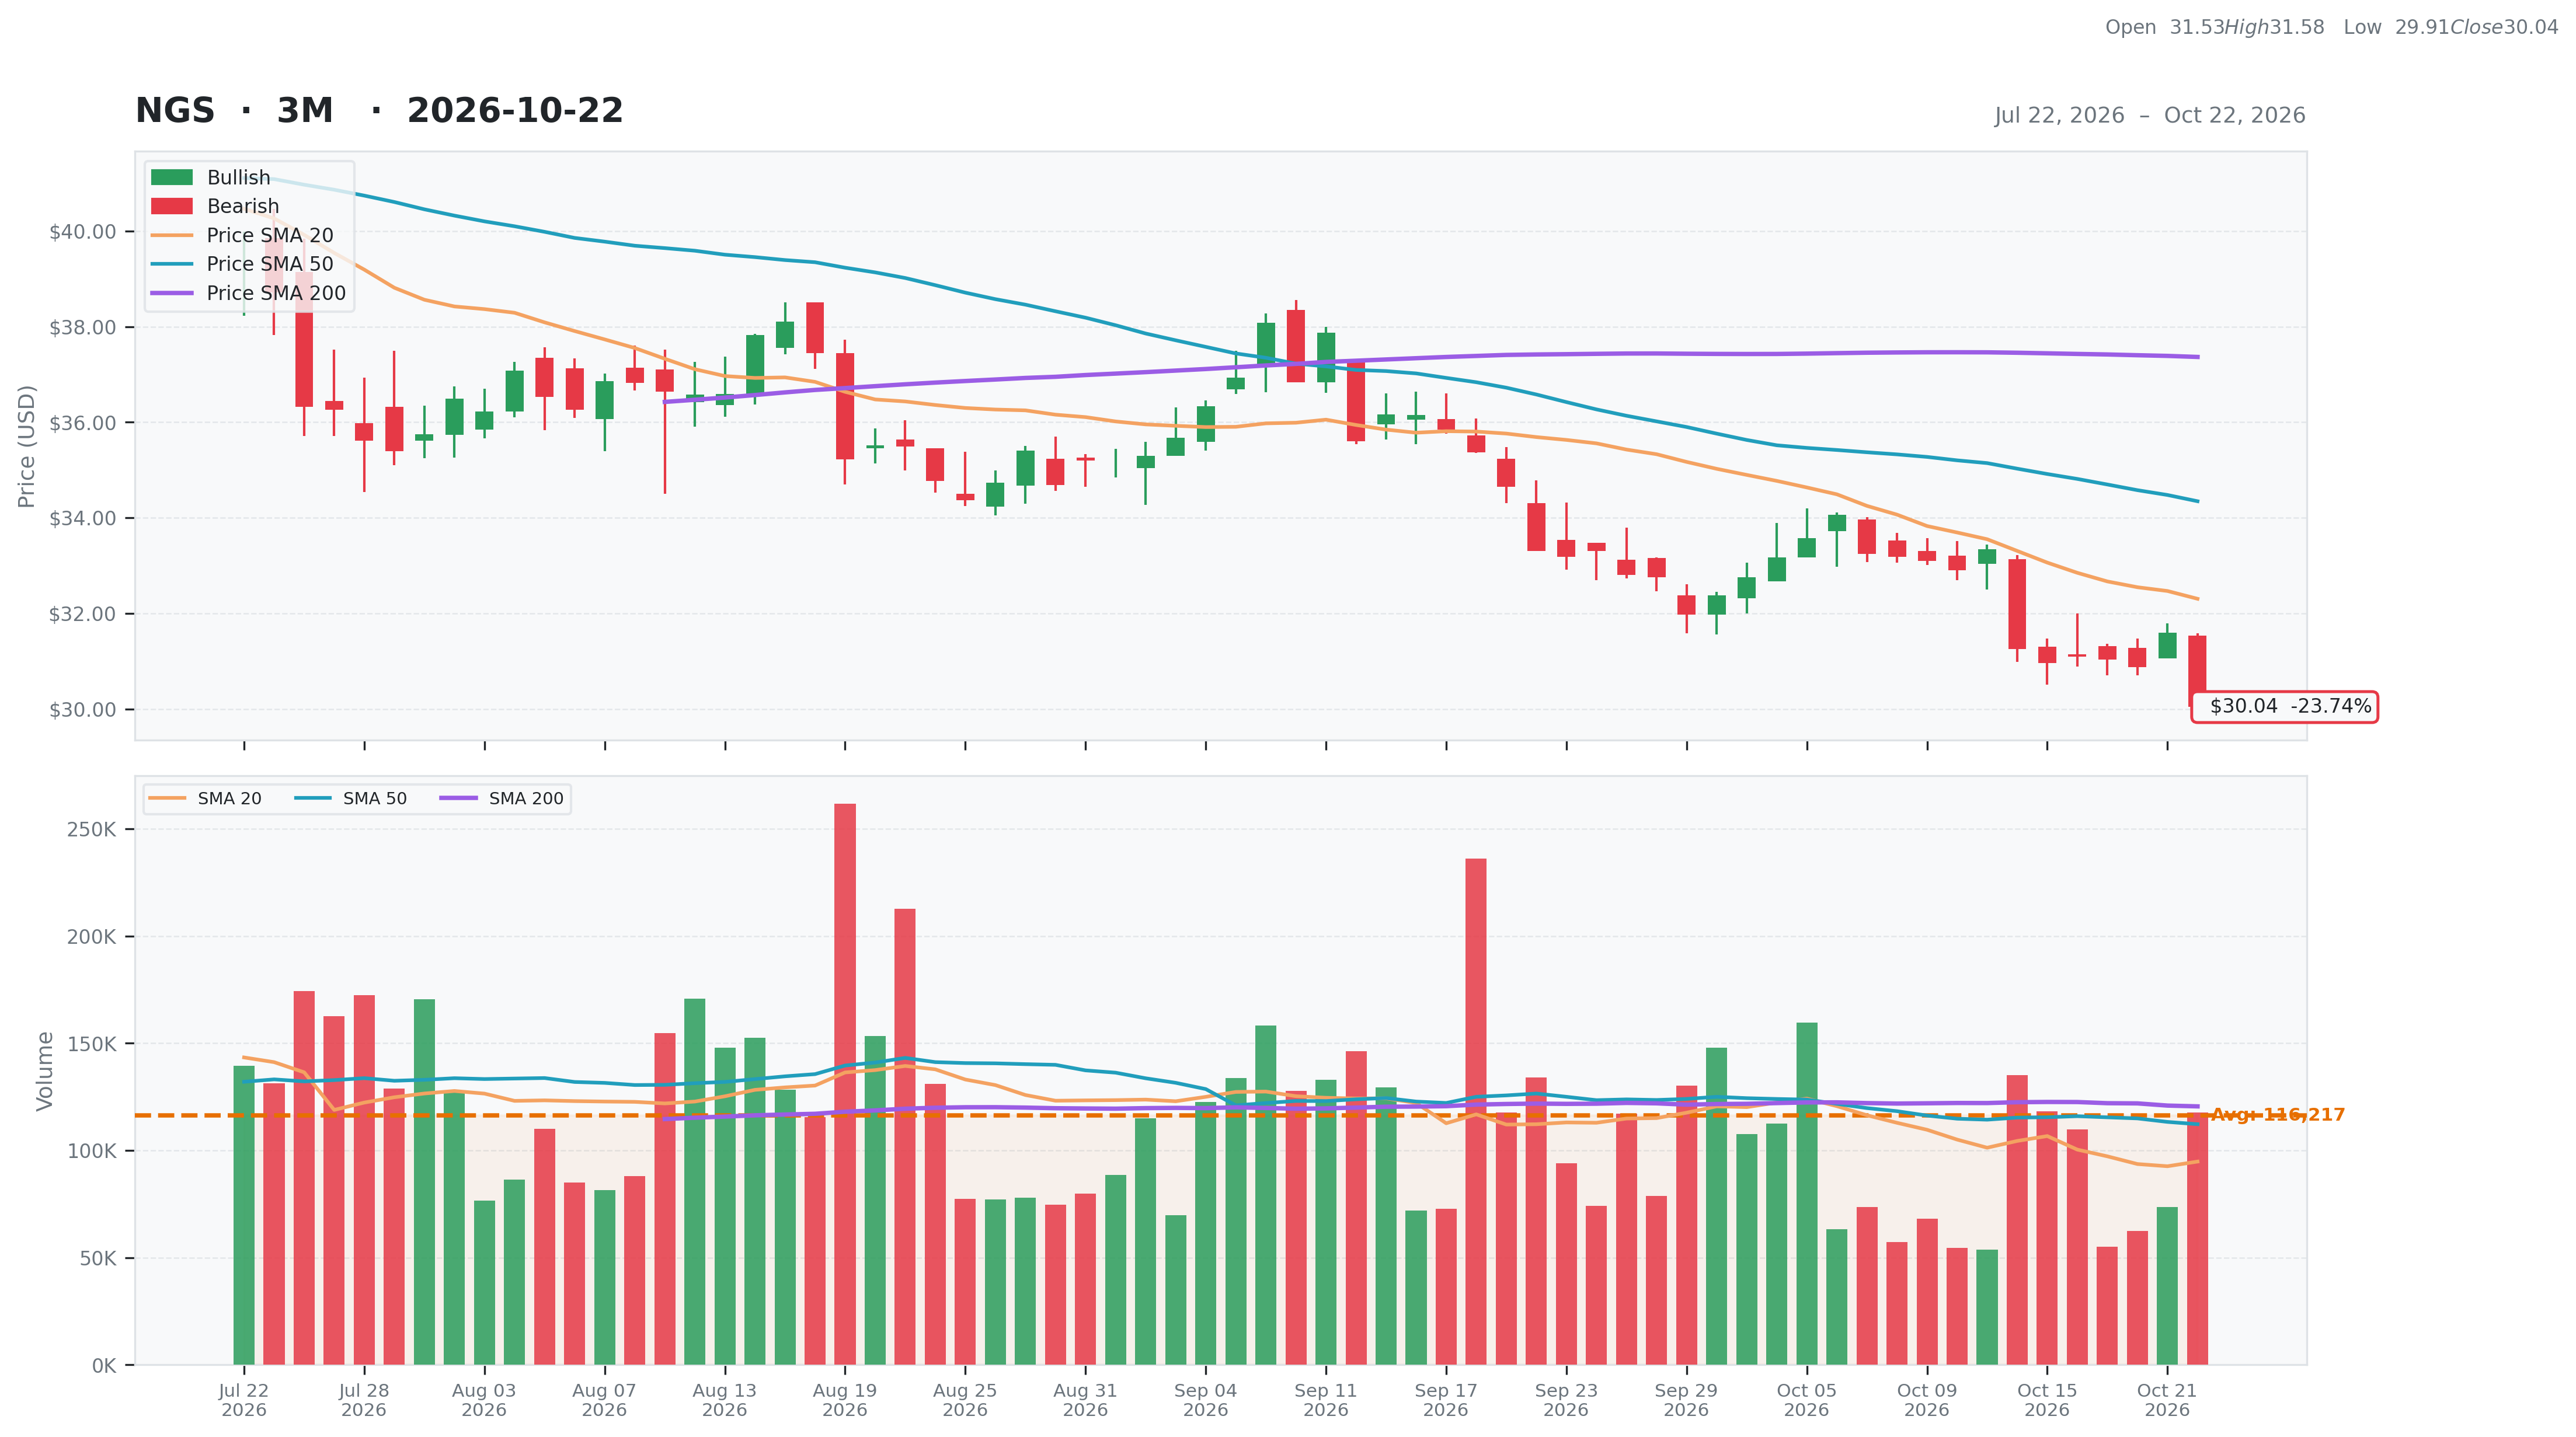
| Total | 62 | Current | $30.04 | 52W High | $43.95 -31.66% | Relative Strength | -0.12 | Beta | 0.47 |
| Business Quality | 20 | Weekly | $30.96 -2.97% | 52W Low | $27.04 11.10% | 3M | -0.17 | Short % | 0.04 |
| Financial Strength | 12 | Monthly | $33.30 -9.79% | Above 50DMA | $34.35 -12.54% | 6M | -0.21 | Risk Score | 3 |
| Growth Outlook | 4 | Quarterly | $36.32 -17.30% | Above 200DMA | $37.36 -19.60% | 9M | -0.12 | ||
| Momentum | 2 | Yearly | $27.29 10.09% | 12M | 0.10 | ||||
| Valuation | Financial Strength | Growth/Profitability | |||
|---|---|---|---|---|---|
| Trailing P/E | 19.32 | Cash | 0M | Revenue Growth | 0.24% |
| Forward P/E | 11.92 | Debt | 329M | Earnings Growth | -0.27% |
| PEG Ratio | 0.82 | Debt/Equity | 111.82 | Qtr Earnings Growth | -0.26% |
| Price/Sales | 2.12 | Current Ratio | 2.01 | Gross Margin | 0.59% |
| Price/Book | 1.36 | Quick Ratio | 0.69 | Operating Margin | 0.19% |
| EV/Revenue | 3.86 | Operating CF | 79M | Profit Margin | 0.11% |
| EV/EBITDA | 8.69 | Free CF | -59M | EBITDA Margin | 0.44% |
| Ent Value | 730M | Return on Assets | 0.04% | ||
| Return on Equity | 0.07% | ||||
| Technical | Volume & Bollinger Bands | Analyst | |||
|---|---|---|---|---|---|
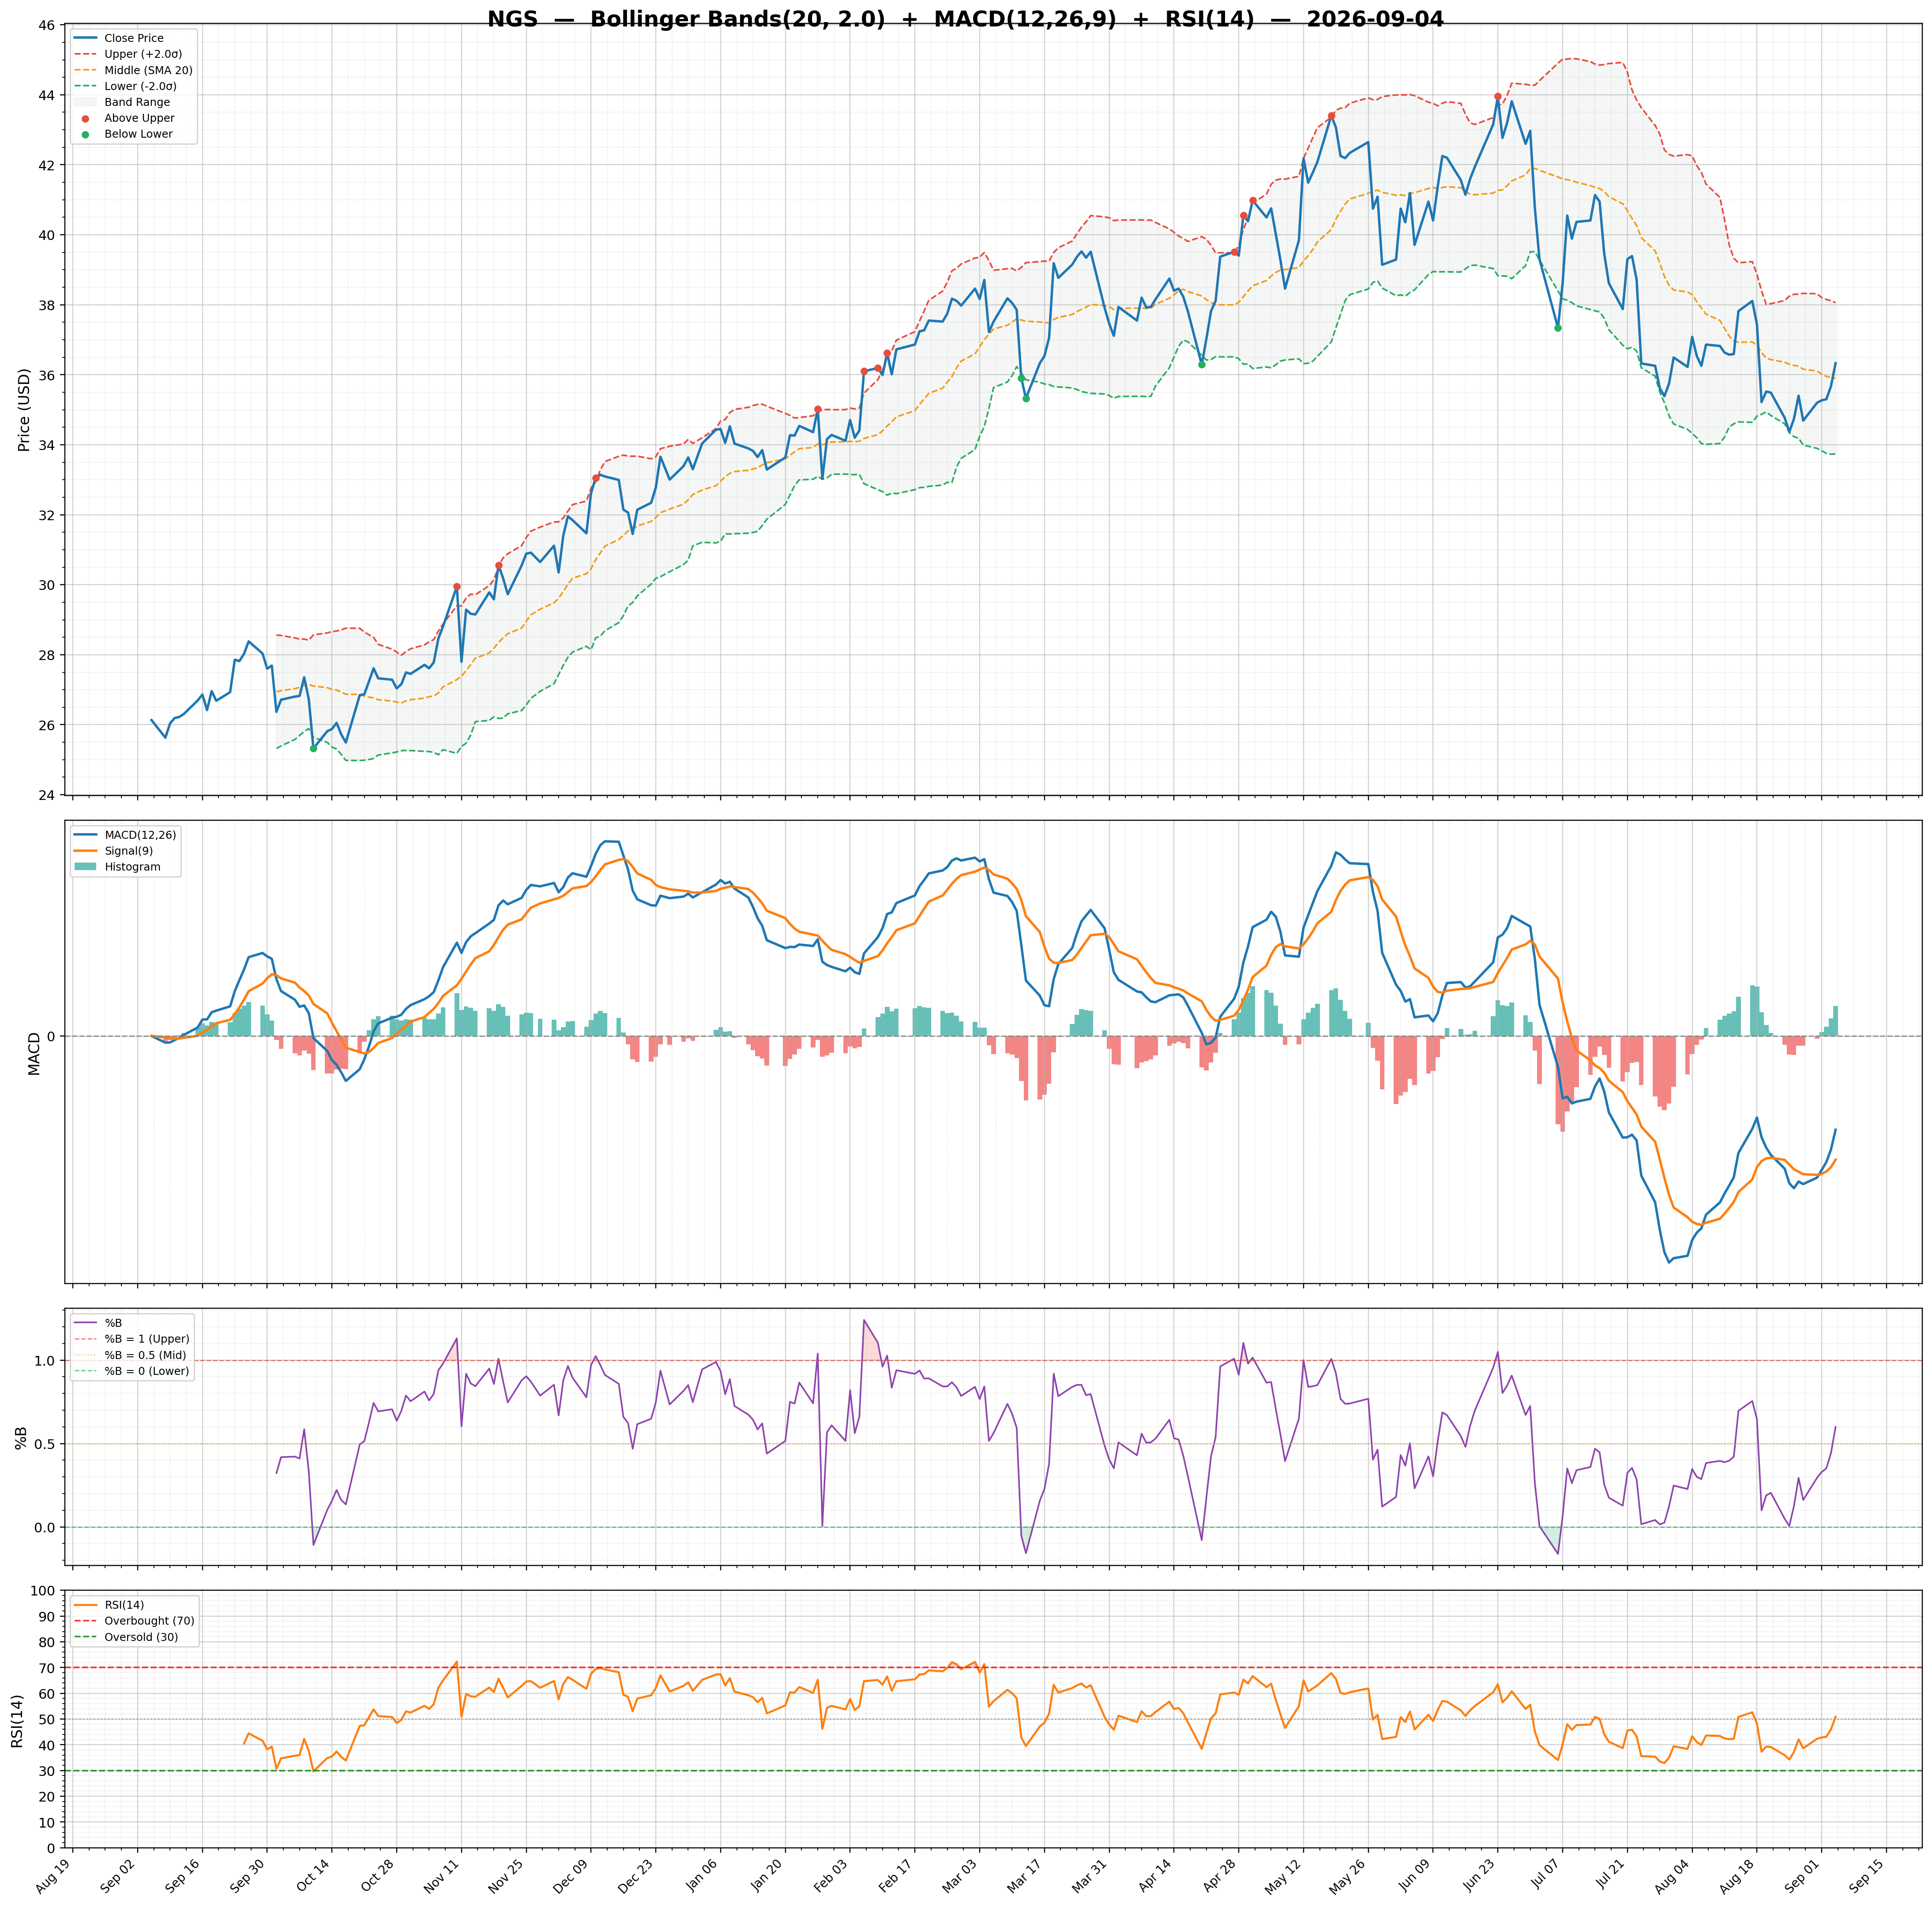
| RSI | 31.38 | Volume | 0.11M | Rating | buy |
| Previous RSI | 39.02 | Avg Volume 20D | 0.09M | Target Mean | $56.00 |
| RSI Trend | Down | Relative Volume | 1.14 | Target High | $60.00 |
| MACD | -1.06 | Lower Band | 30.08 | Target Low | $53.00 |
| MACD Signal | -0.94 | Middle Band | 32.31 | Target Median | $55.00 |
| Histogram | -0.12 | Upper Band | 34.53 | Analysts | 3 |
| Previous Histogram | -0.08 | Bandwidth | 13.770 | Upside | 80.06% |
| Histogram Trend | Decreasing | %B | -0.01 | ||