Nortech Systems Incorporated (NSYS)
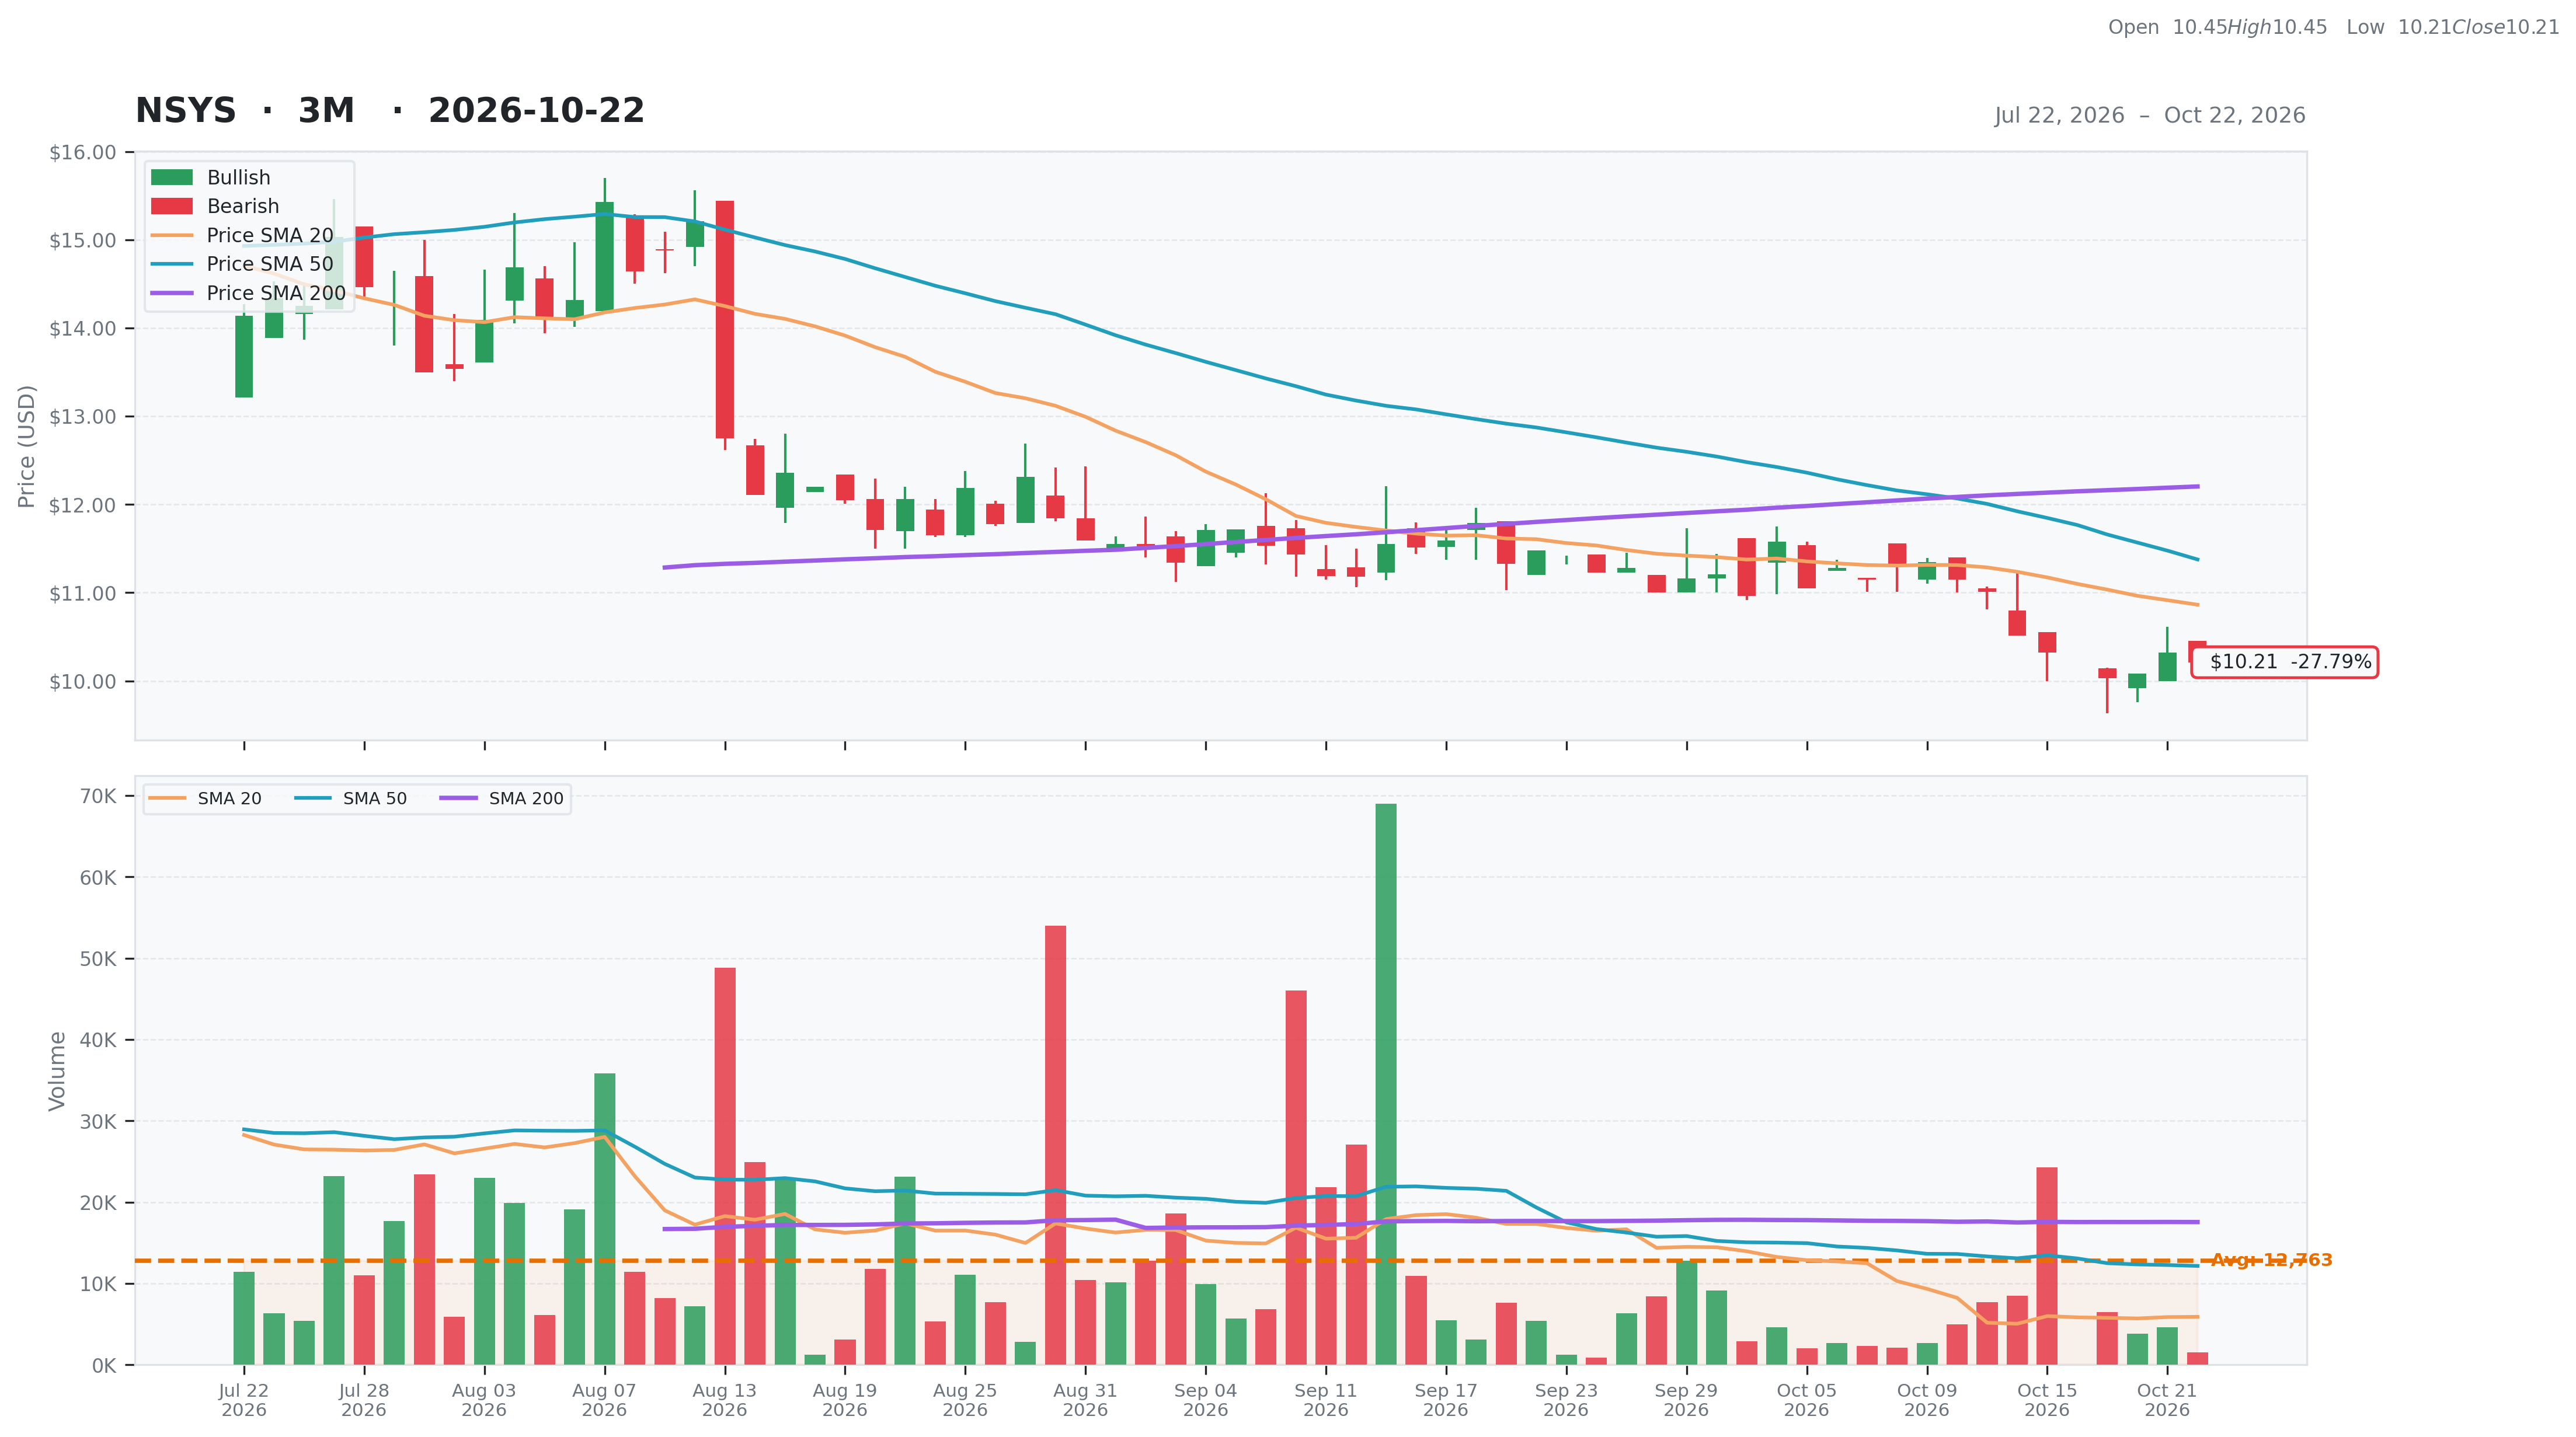
Healthcare • Medical Devices • $10.21 • MCap: 29,450,864
https://www.nortechsys.com • Nortech Systems Incorporated provides engineering design and manufacturing solutions for electromedical devices, electromechanical systems, assemblies, and components in the United States, Mexico, and China. It offers a range of value-added engineering, technical, manufacturing, and support services, including project management, designing, testing, prototyping, manufacturing, supply chain management, and post-market services. The company also manufacturing and engineering services that include complex electromedical and electromechanical product, such as medical devices, wire and cable assemblies, printed circuit board assemblies, complex higher-level assemblies, and other box builds for a range of industries. In addition, it offers engineering and repair services. The company serves original equipment manufacturers in the medical devices and imaging, aerospace and defense, and industrial markets through business development teams and independent manufacturers' representatives. Nortech Systems Incorporated was founded in 1990 and is headquartered in Maple Grove, Minnesota.
Ex-AAII
| Score | Price | 52 Week & Averages | Relative Strength | Risk | |||||
|---|---|---|---|---|---|---|---|---|---|
| Total | 36 | Current | $10.21 | 52W High | $17.66 -42.18% | Relative Strength | -0.14 | Beta | -0.12 |
| Business Quality | 1 | Weekly | $10.32 -1.06% | 52W Low | $6.80 50.16% | 3M | -0.28 | Short % | 0 |
| Financial Strength | 11 | Monthly | $11.48 -11.05% | Above 50DMA | $11.38 -10.25% | 6M | -0.34 | Risk Score | |
| Growth Outlook | 1 | Quarterly | $14.25 -28.34% | Above 200DMA | $12.20 -16.33% | 9M | 0.17 | ||
| Momentum | 0 | Yearly | $9.94 2.73% | 12M | 0.05 | ||||
| Valuation | Financial Strength | Growth/Profitability | |||
|---|---|---|---|---|---|
| Trailing P/E | 28.67 | Cash | 1M | Revenue Growth | 0.09% |
| Forward P/E | N/A | Debt | 18M | Earnings Growth | -0.02% |
| PEG Ratio | N/A | Debt/Equity | 50.43 | Qtr Earnings Growth | 0.01% |
| Price/Sales | 0.24 | Current Ratio | 1.78 | Gross Margin | 0.16% |
| Price/Book | 0.84 | Quick Ratio | 1.06 | Operating Margin | 0.02% |
| EV/Revenue | 0.37 | Operating CF | 3M | Profit Margin | 0.01% |
| EV/EBITDA | 12.34 | Free CF | 3M | EBITDA Margin | 0.03% |
| Ent Value | 46M | Return on Assets | 0.02% | ||
| Return on Equity | 0.03% | ||||
| Technical | Volume & Bollinger Bands | Analyst | |||
|---|---|---|---|---|---|
| RSI | 36.30 | Volume | 0M | Rating | none |
| Previous RSI | 37.69 | Avg Volume 20D | 0.01M | Target Mean | N/A |
| RSI Trend | Down | Relative Volume | 0.16 | Target High | N/A |
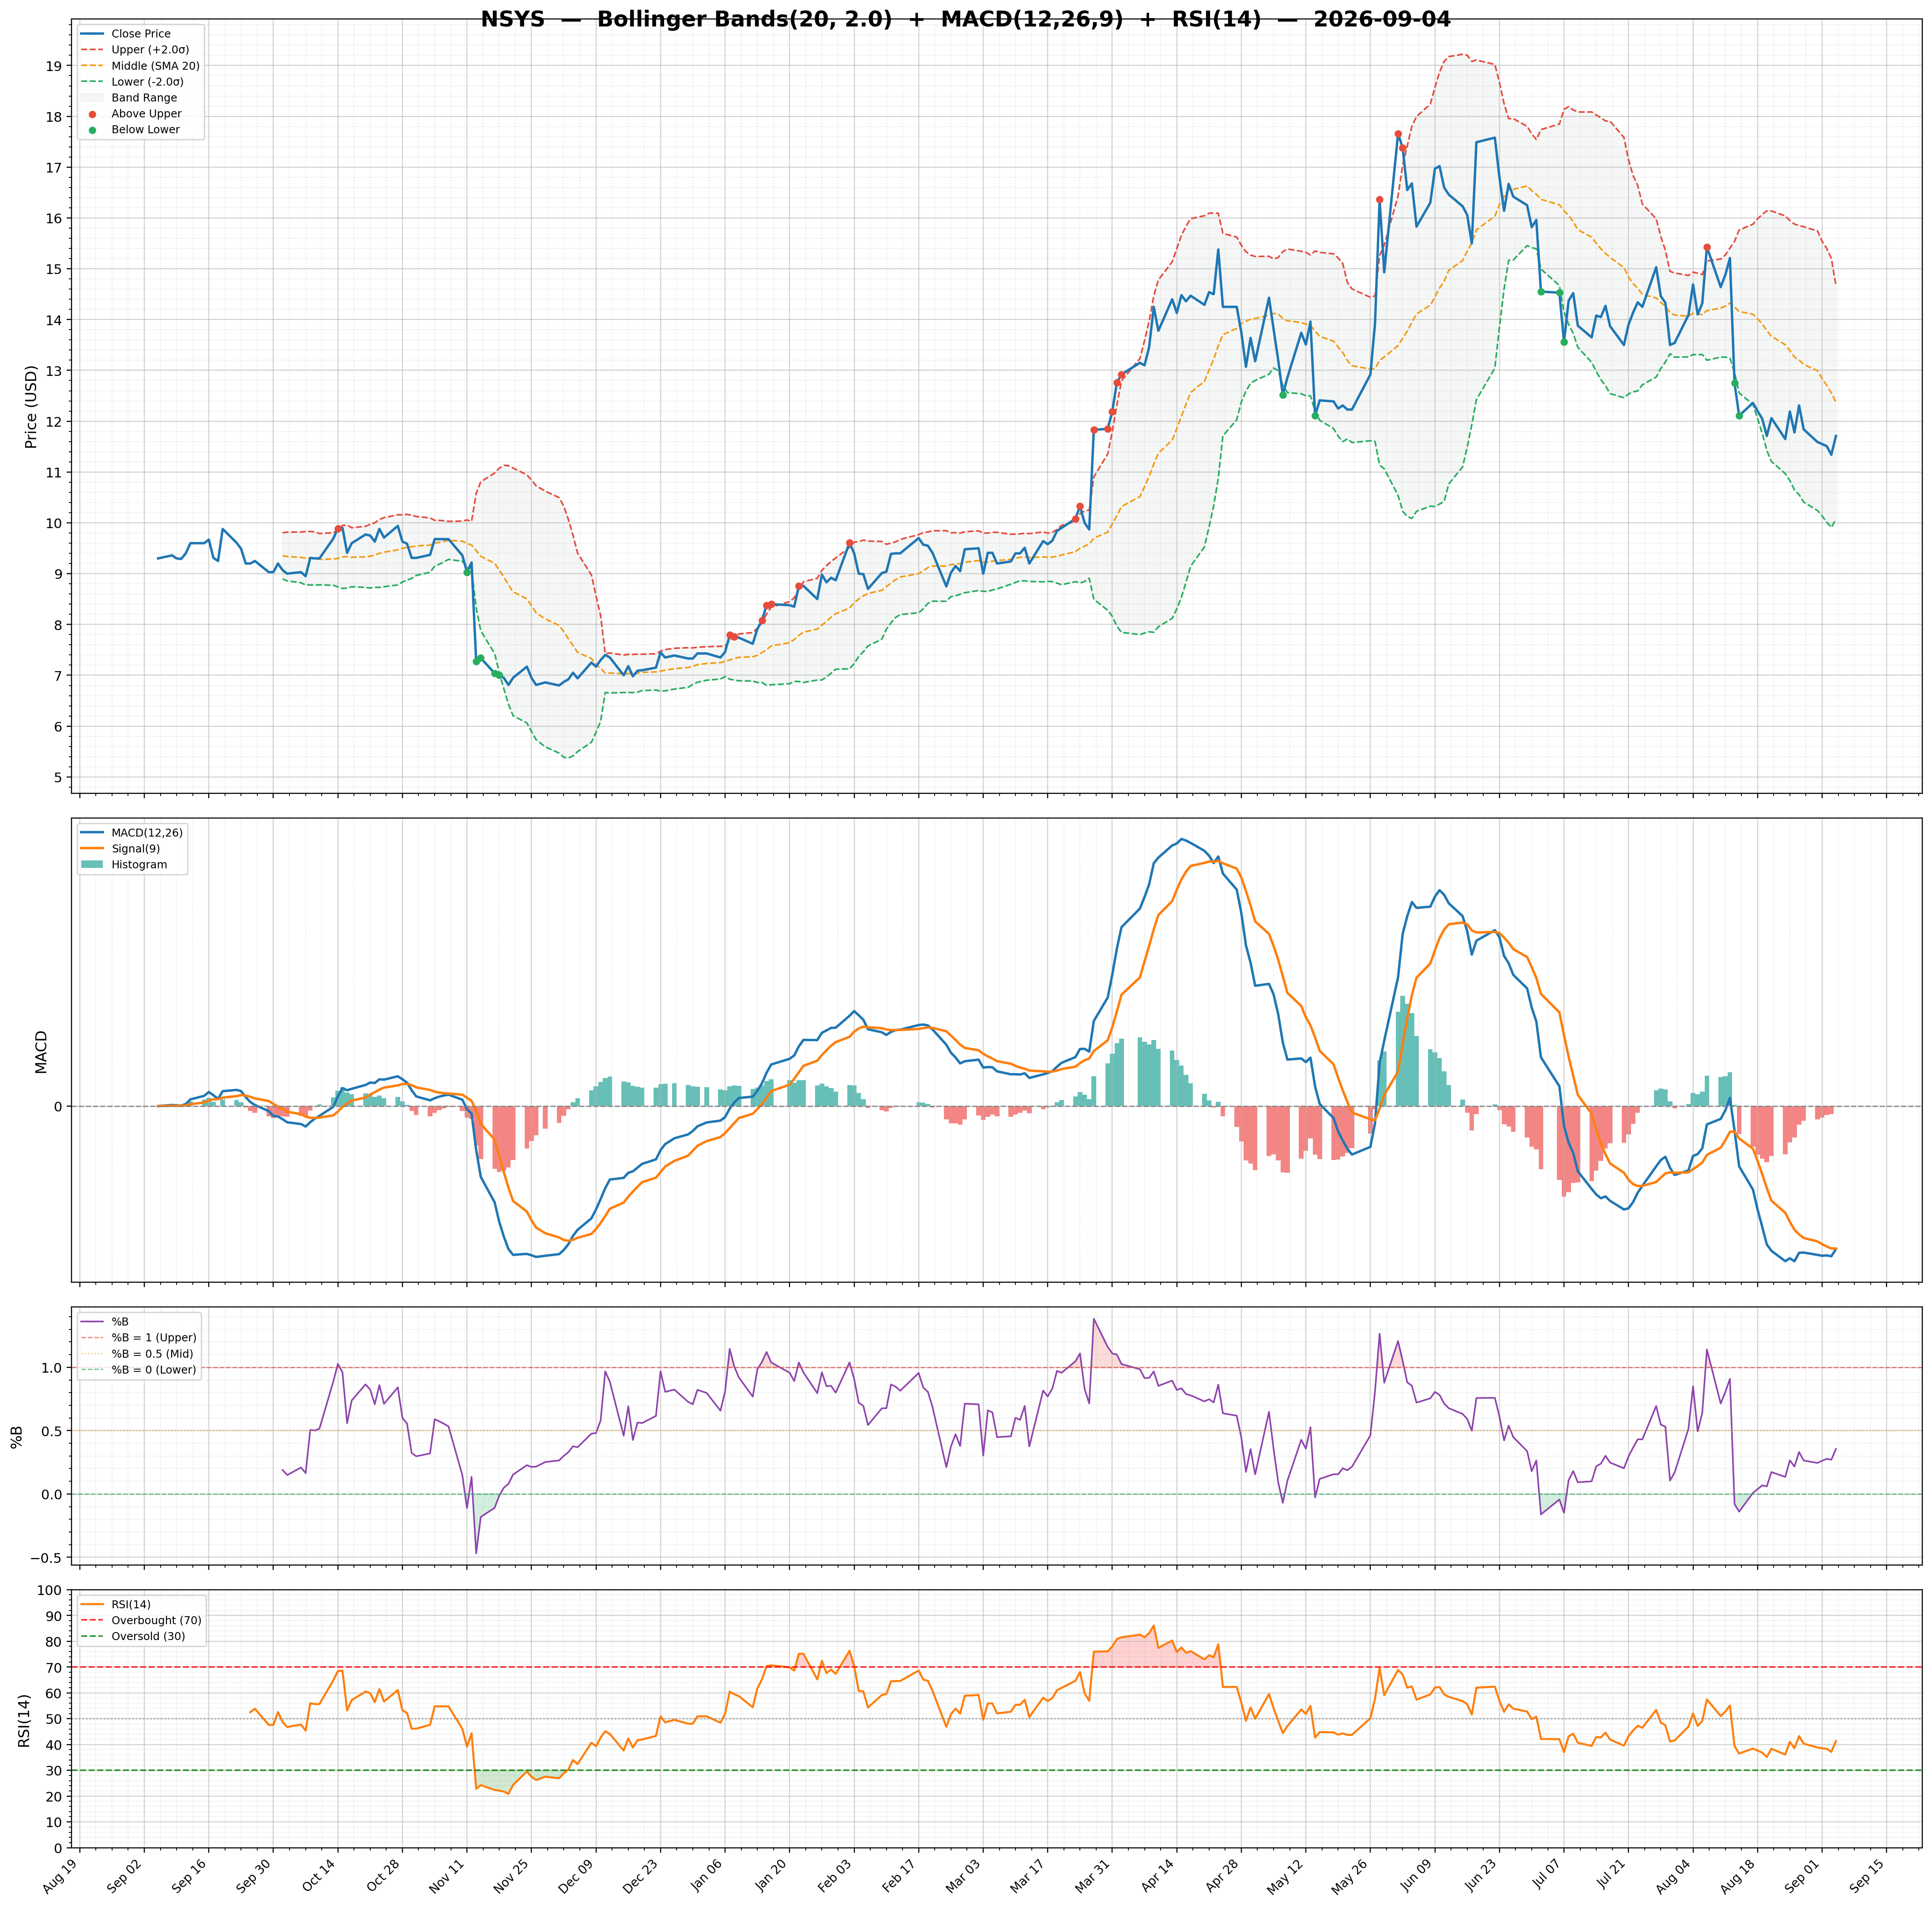
| MACD | -0.40 | Lower Band | 9.89 | Target Low | N/A |
| MACD Signal | -0.35 | Middle Band | 10.86 | Target Median | N/A |
| Histogram | -0.05 | Upper Band | 11.84 | Analysts | N/A |
| Previous Histogram | -0.06 | Bandwidth | 17.900 | Upside | N/A |
| Histogram Trend | Increasing | %B | 0.16 | ||