Orion Group Holdings, Inc. (ORN)
Industrials • Engineering & Construction • $8.41 • MCap: 345,019,872
https://www.oriongroupholdingsinc.com • Orion Group Holdings, Inc. operates as a specialty construction company for the infrastructure, industrial, and building sectors in the United States, Canada, and the Caribbean Basin. It operates through two segments, Marine and Concrete. The company engages in the building, rehabilitation, and maintenance of a range of marine transportation facilities, including terminals, cruise ship berths, private terminals, U.S. Navy facilities, marinas, and other port facilities; installation of foundations, mooring structures, and related components; provision of ongoing inspection, maintenance, and emergency repair services, as well as logistics services for directional drilling; installation and removal of underwater pipelines and transmission infrastructure, such as industrial intakes and outfalls, river crossing, and tie-ins; construction, repair, and maintenance of overwater bridges, causeways, and fendering systems; and construction of various environmental protection structures, including levees, erosion control systems, concrete mats, wetlands restoration features, and geotube installations for island and shoreline creation. It also provides maintenance and capital dredging services for ports, waterways, and channels. In addition, the company offers specialty services, such as design, salvage, demolition, surveying, towing, commercial diving, underwater inspection, excavation, and repair services. Further, it provides concrete construction services, including concrete placement and finishing, site preparation, layout, forming, and rebar placement services for data centers; industrial, warehouse, and distribution facilities; commercial, multi-family, institutional, and mixed-use structures; and retail, hospital, and recreational facilities. The company was formerly known as Orion Marine Group, Inc. and changed its name to Orion Group Holdings, Inc. in May 2016. Orion Group Holdings, Inc. was founded in 1994 and is headquartered in Houston, Texas.
Ex-AAII
| Score | Price | 52 Week & Averages | Relative Strength | Risk | |||||
|---|---|---|---|---|---|---|---|---|---|
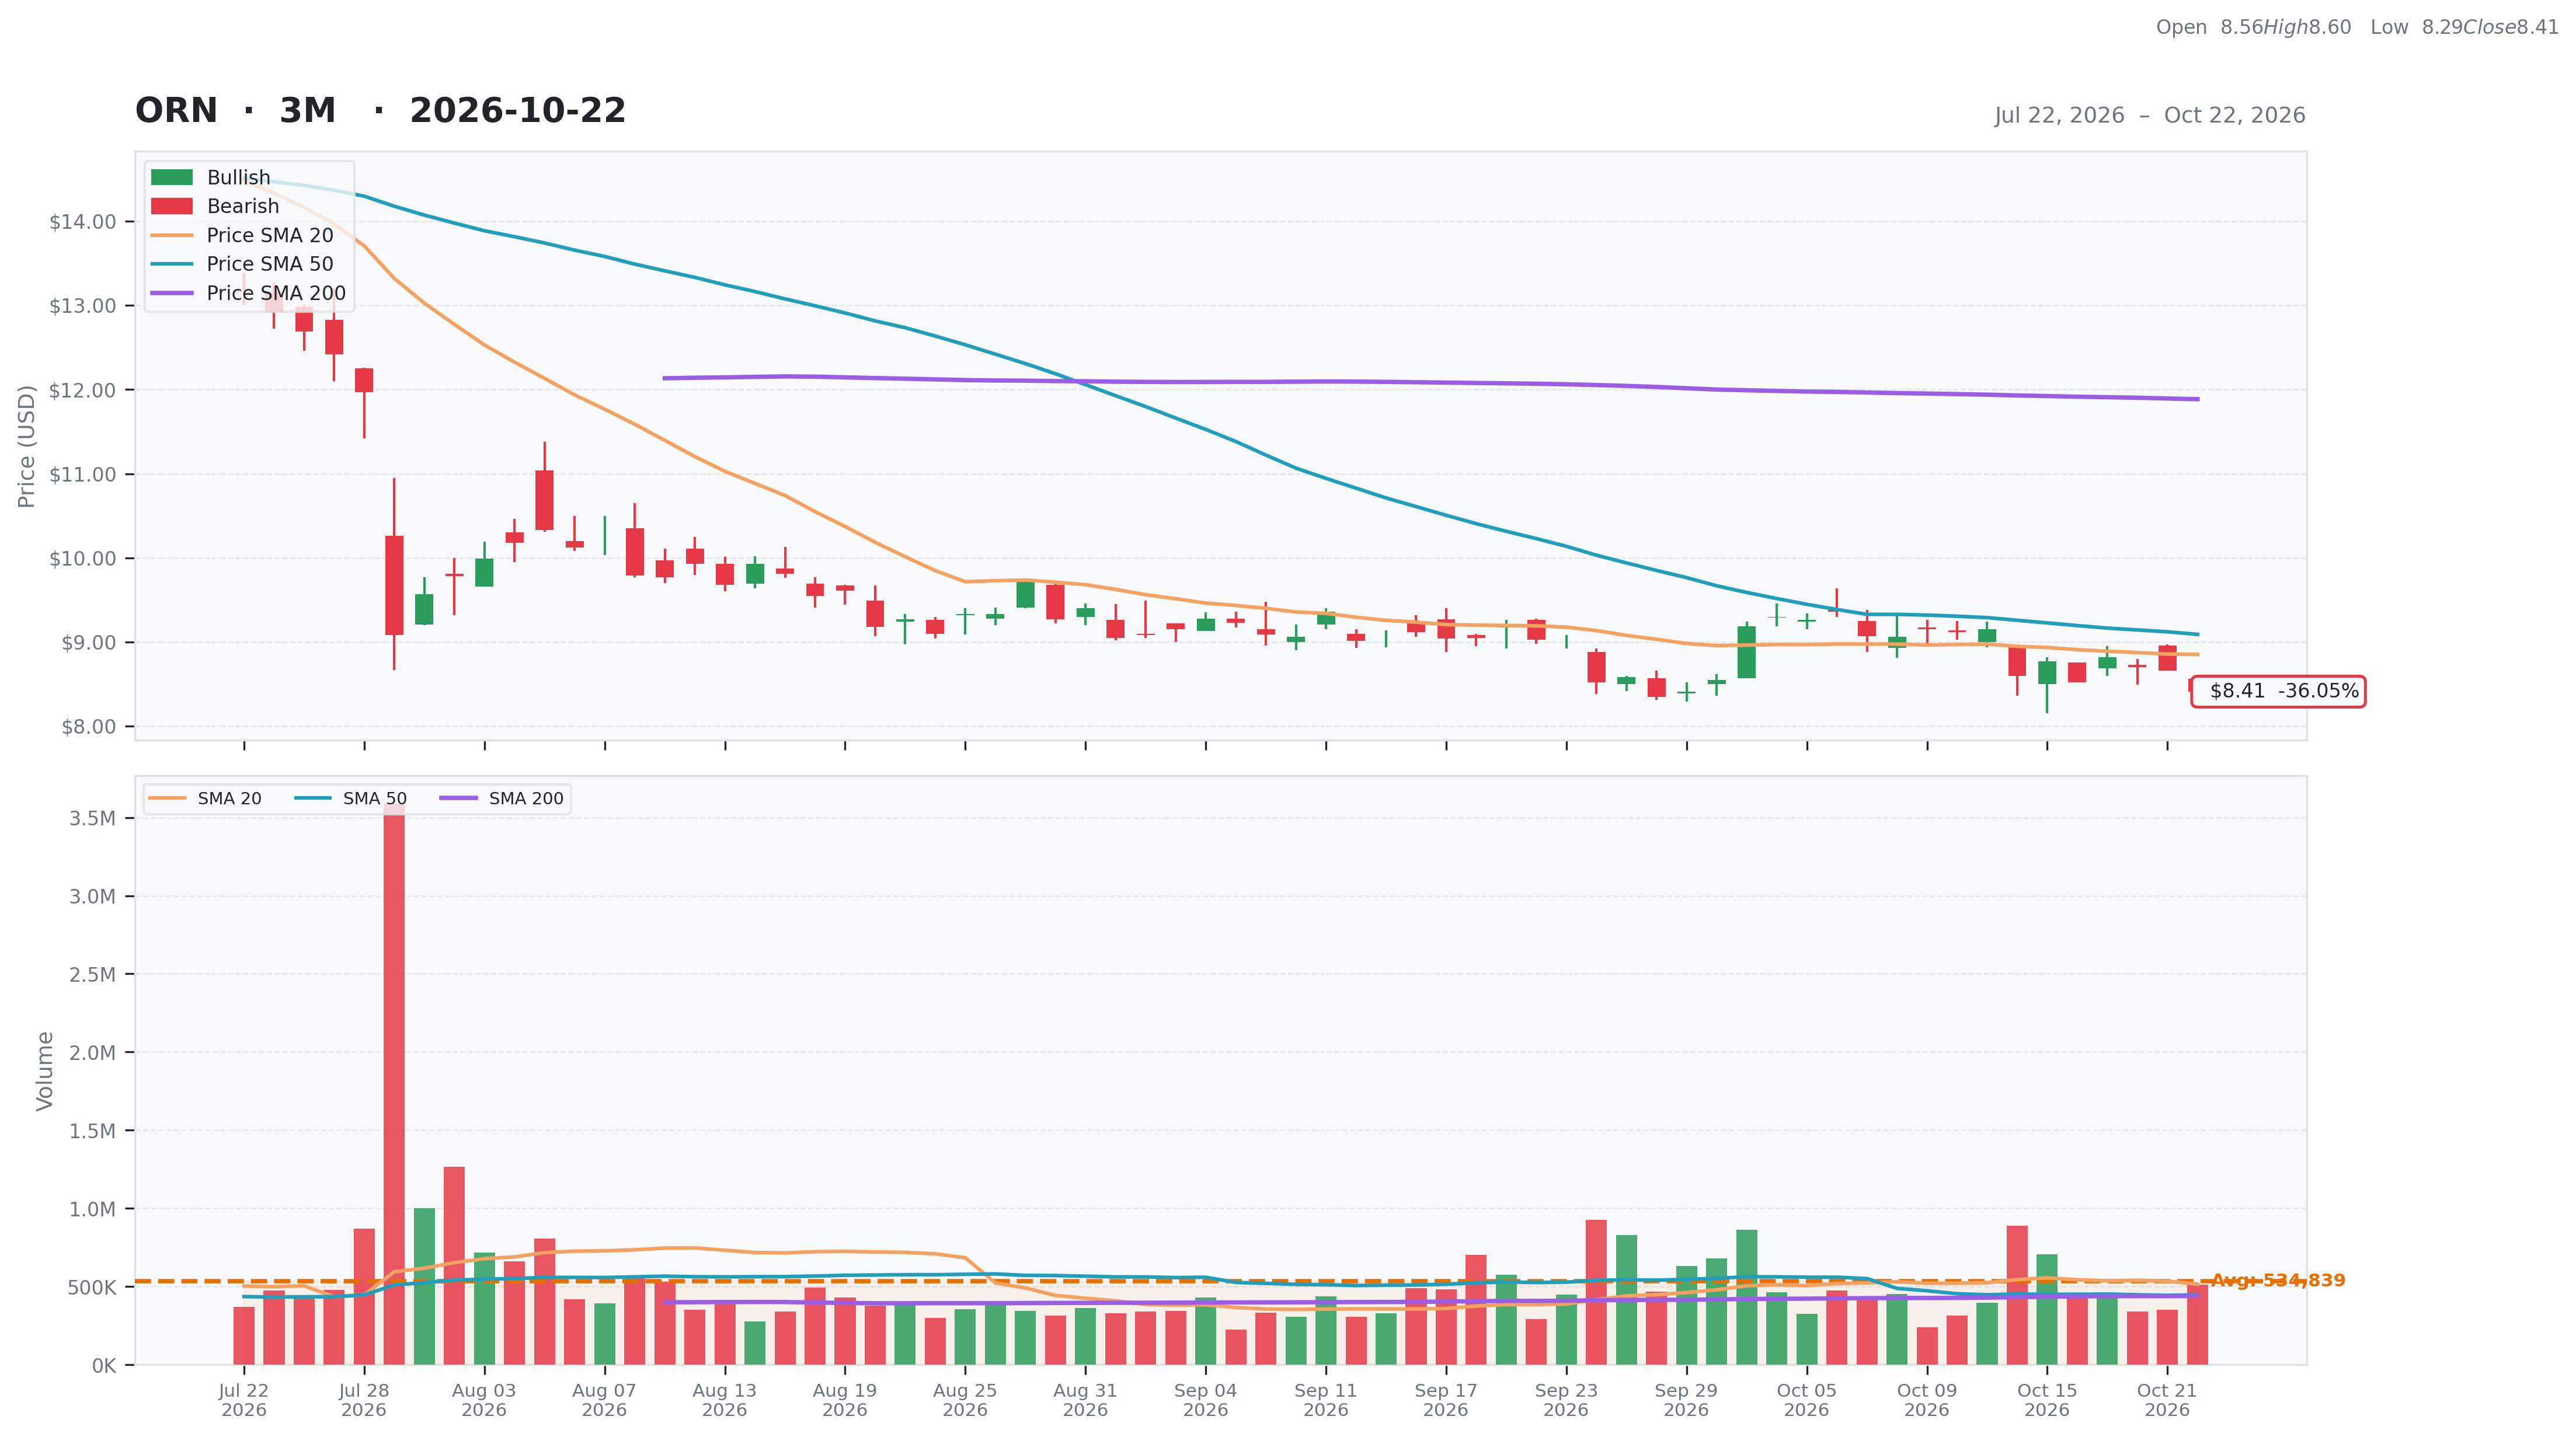
| Total | 28 | Current | $8.41 | 52W High | $17.14 -50.93% | Relative Strength | -0.28 | Beta | 1.43 |
| Business Quality | 1 | Weekly | $8.77 -4.10% | 52W Low | $8.35 0.72% | 3M | -0.34 | Short % | 0.07 |
| Financial Strength | 6 | Monthly | $9.03 -6.87% | Above 50DMA | $9.09 -7.49% | 6M | -0.33 | Risk Score | 4 |
| Growth Outlook | 5 | Quarterly | $12.69 -33.73% | Above 200DMA | $11.88 -29.23% | 9M | -0.34 | ||
| Momentum | 3 | Yearly | $8.71 -3.44% | 12M | -0.05 | ||||
| Valuation | Financial Strength | Growth/Profitability | |||
|---|---|---|---|---|---|
| Trailing P/E | 106.50 | Cash | 3M | Revenue Growth | 0.08% |
| Forward P/E | 19.38 | Debt | 163M | Earnings Growth | N/A |
| PEG Ratio | 28.96 | Debt/Equity | 98.93 | Qtr Earnings Growth | N/A |
| Price/Sales | 0.38 | Current Ratio | 1.52 | Gross Margin | 0.12% |
| Price/Book | 2.10 | Quick Ratio | 1.45 | Operating Margin | -0.01% |
| EV/Revenue | 0.56 | Operating CF | 24M | Profit Margin | 0.00% |
| EV/EBITDA | 15.32 | Free CF | -21M | EBITDA Margin | 0.04% |
| Ent Value | 505M | Return on Assets | 0.01% | ||
| Return on Equity | 0.02% | ||||
| Technical | Volume & Bollinger Bands | Analyst | |||
|---|---|---|---|---|---|
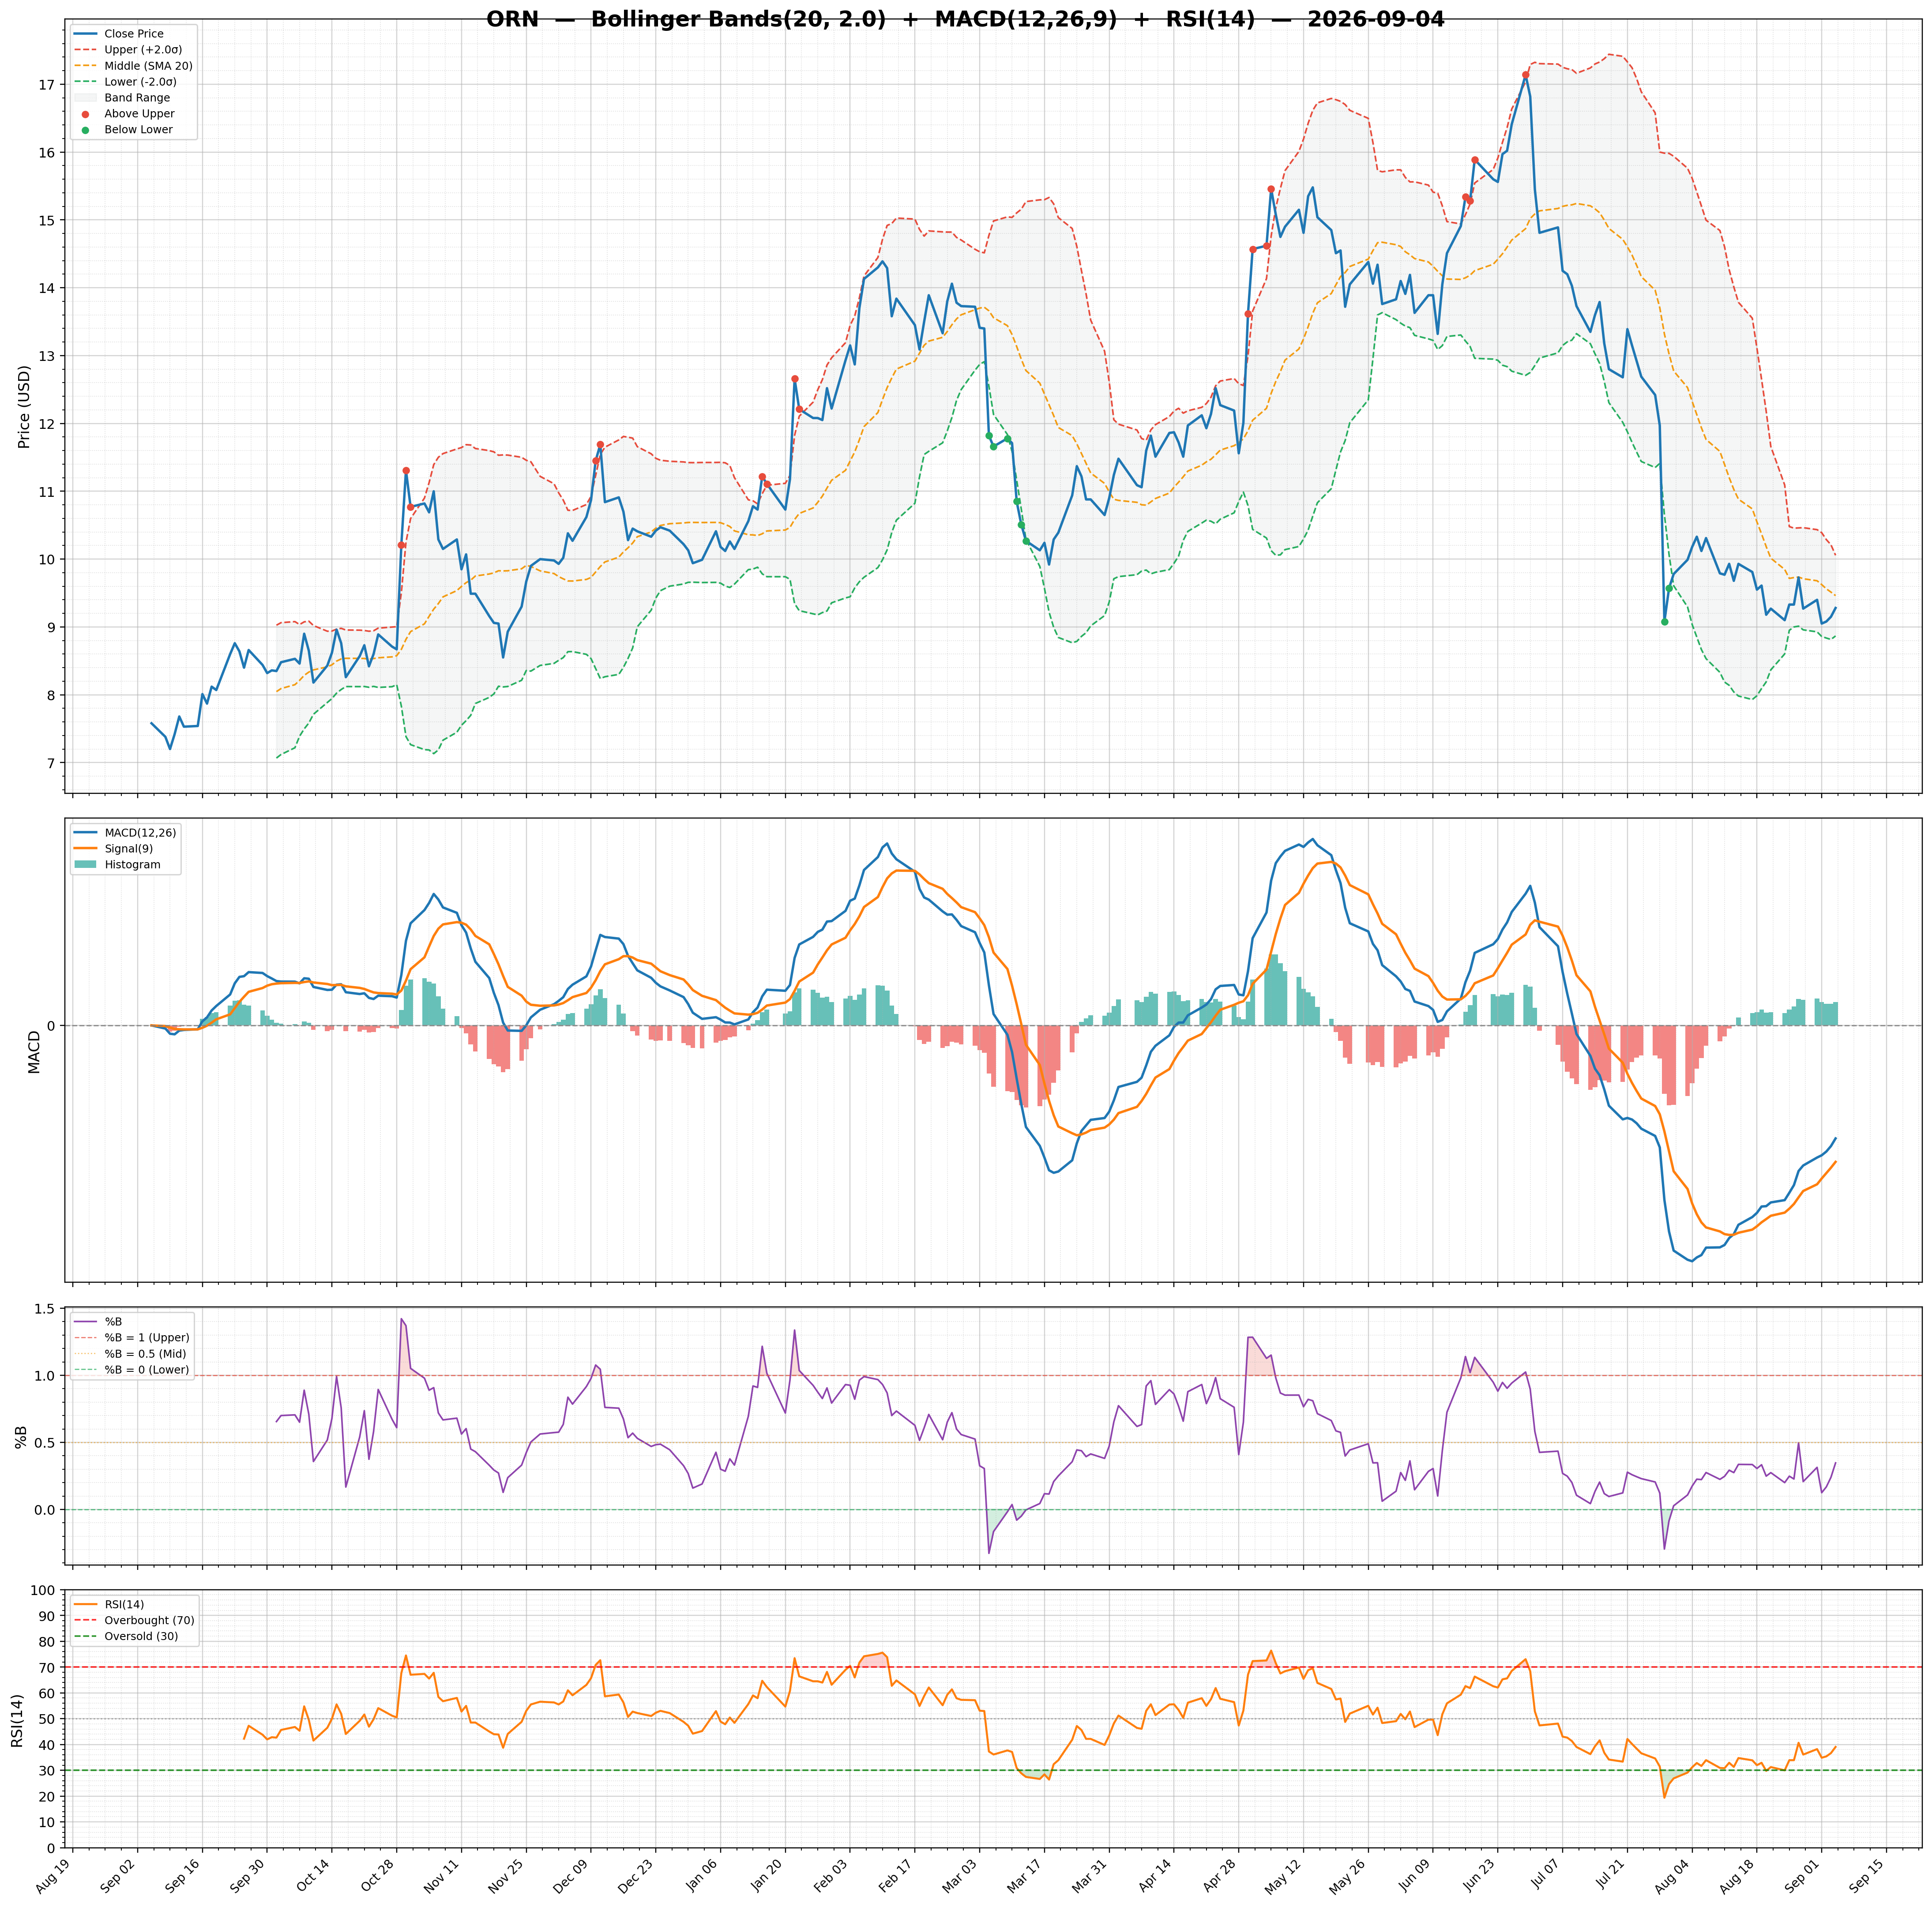
| RSI | 38.57 | Volume | 0.45M | Rating | strong_buy |
| Previous RSI | 42.78 | Avg Volume 20D | 0.51M | Target Mean | $14.98 |
| RSI Trend | Down | Relative Volume | 1.01 | Target High | $15.90 |
| MACD | -0.17 | Lower Band | 8.18 | Target Low | $14.00 |
| MACD Signal | -0.15 | Middle Band | 8.85 | Target Median | $15.00 |
| Histogram | -0.02 | Upper Band | 9.52 | Analysts | 6 |
| Previous Histogram | -0.01 | Bandwidth | 15.130 | Upside | 75.86% |
| Histogram Trend | Decreasing | %B | 0.17 | ||