Pangaea Logistics Solutions Ltd (PANL)
Industrials • Marine Shipping • $7.78 • MCap: 498,255,424
https://www.pangaeals.com • Pangaea Logistics Solutions Ltd., together with its subsidiaries, provides seaborne dry bulk logistics and transportation services to industrial customers worldwide. It offers transportation services for various dry bulk cargoes, such as grains, coal, iron ore, pig iron, hot briquetted iron, bauxite, alumina, cement clinker, dolomite, and limestone; and terminal and stevedoring services. The company also provides cargo loading, cargo discharge, port and terminal operations, vessel chartering, voyage planning, and technical vessel management. It owns and operates a fleet of 7 vessels. The company was founded in 1996 and is headquartered in Newport, Rhode Island.
AAII
| Score | Price | 52 Week & Averages | Relative Strength | Risk | |||||
|---|---|---|---|---|---|---|---|---|---|
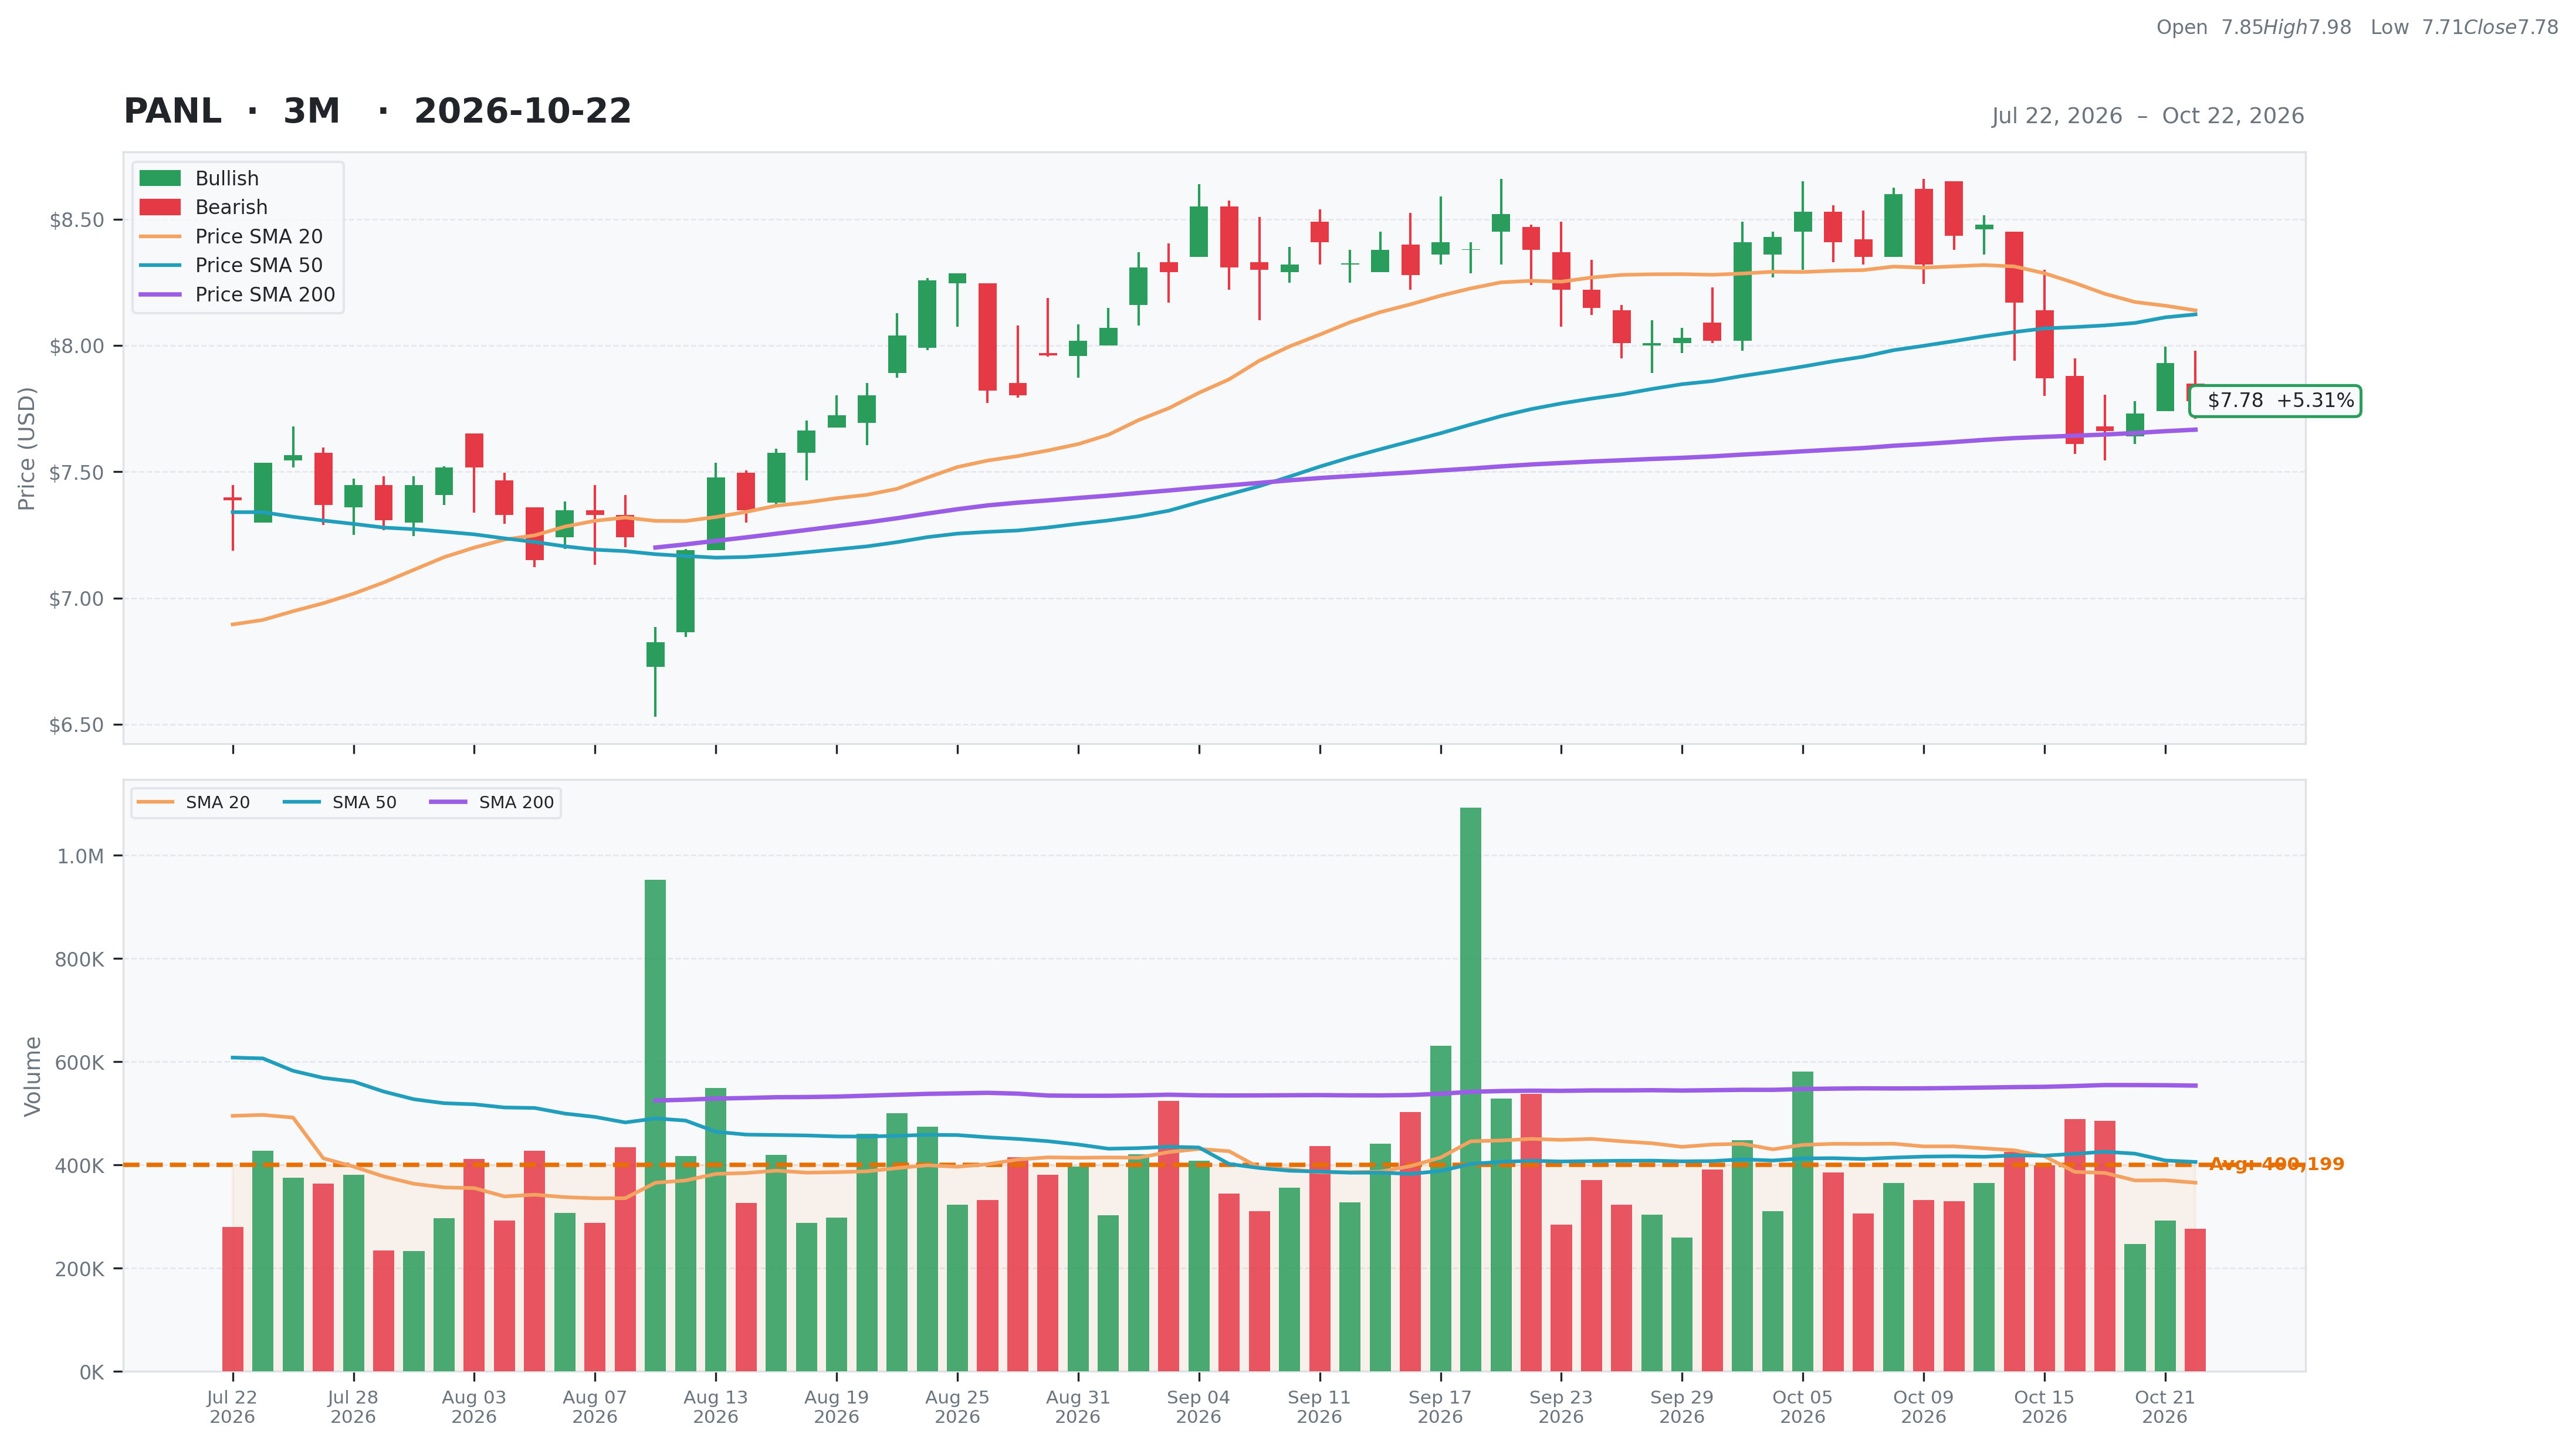
| Total | 57 | Current | $7.78 | 52W High | $9.17 -15.19% | Relative Strength | 0.15 | Beta | 0.81 |
| Business Quality | 11 | Weekly | $7.87 -1.14% | 52W Low | $4.58 69.76% | 3M | 0.03 | Short % | 0.03 |
| Financial Strength | 12 | Monthly | $8.38 -7.16% | Above 50DMA | $8.12 -4.23% | 6M | 0.09 | Risk Score | 6 |
| Growth Outlook | 5 | Quarterly | $7.57 2.83% | Above 200DMA | $7.67 1.48% | 9M | -0.04 | ||
| Momentum | 4 | Yearly | $4.63 67.98% | 12M | 0.66 | ||||
| Valuation | Financial Strength | Growth/Profitability | |||
|---|---|---|---|---|---|
| Trailing P/E | 10.42 | Cash | 106M | Revenue Growth | 0.19% |
| Forward P/E | 6.92 | Debt | 349M | Earnings Growth | N/A |
| PEG Ratio | N/A | Debt/Equity | 70.65 | Qtr Earnings Growth | N/A |
| Price/Sales | 0.70 | Current Ratio | 1.38 | Gross Margin | 0.20% |
| Price/Book | 1.11 | Quick Ratio | 0.95 | Operating Margin | 0.11% |
| EV/Revenue | 1.11 | Operating CF | 70M | Profit Margin | 0.07% |
| EV/EBITDA | 7.18 | Free CF | 63M | EBITDA Margin | 0.15% |
| Ent Value | 789M | Return on Assets | 0.04% | ||
| Return on Equity | 0.10% | ||||
| Technical | Volume & Bollinger Bands | Analyst | |||
|---|---|---|---|---|---|
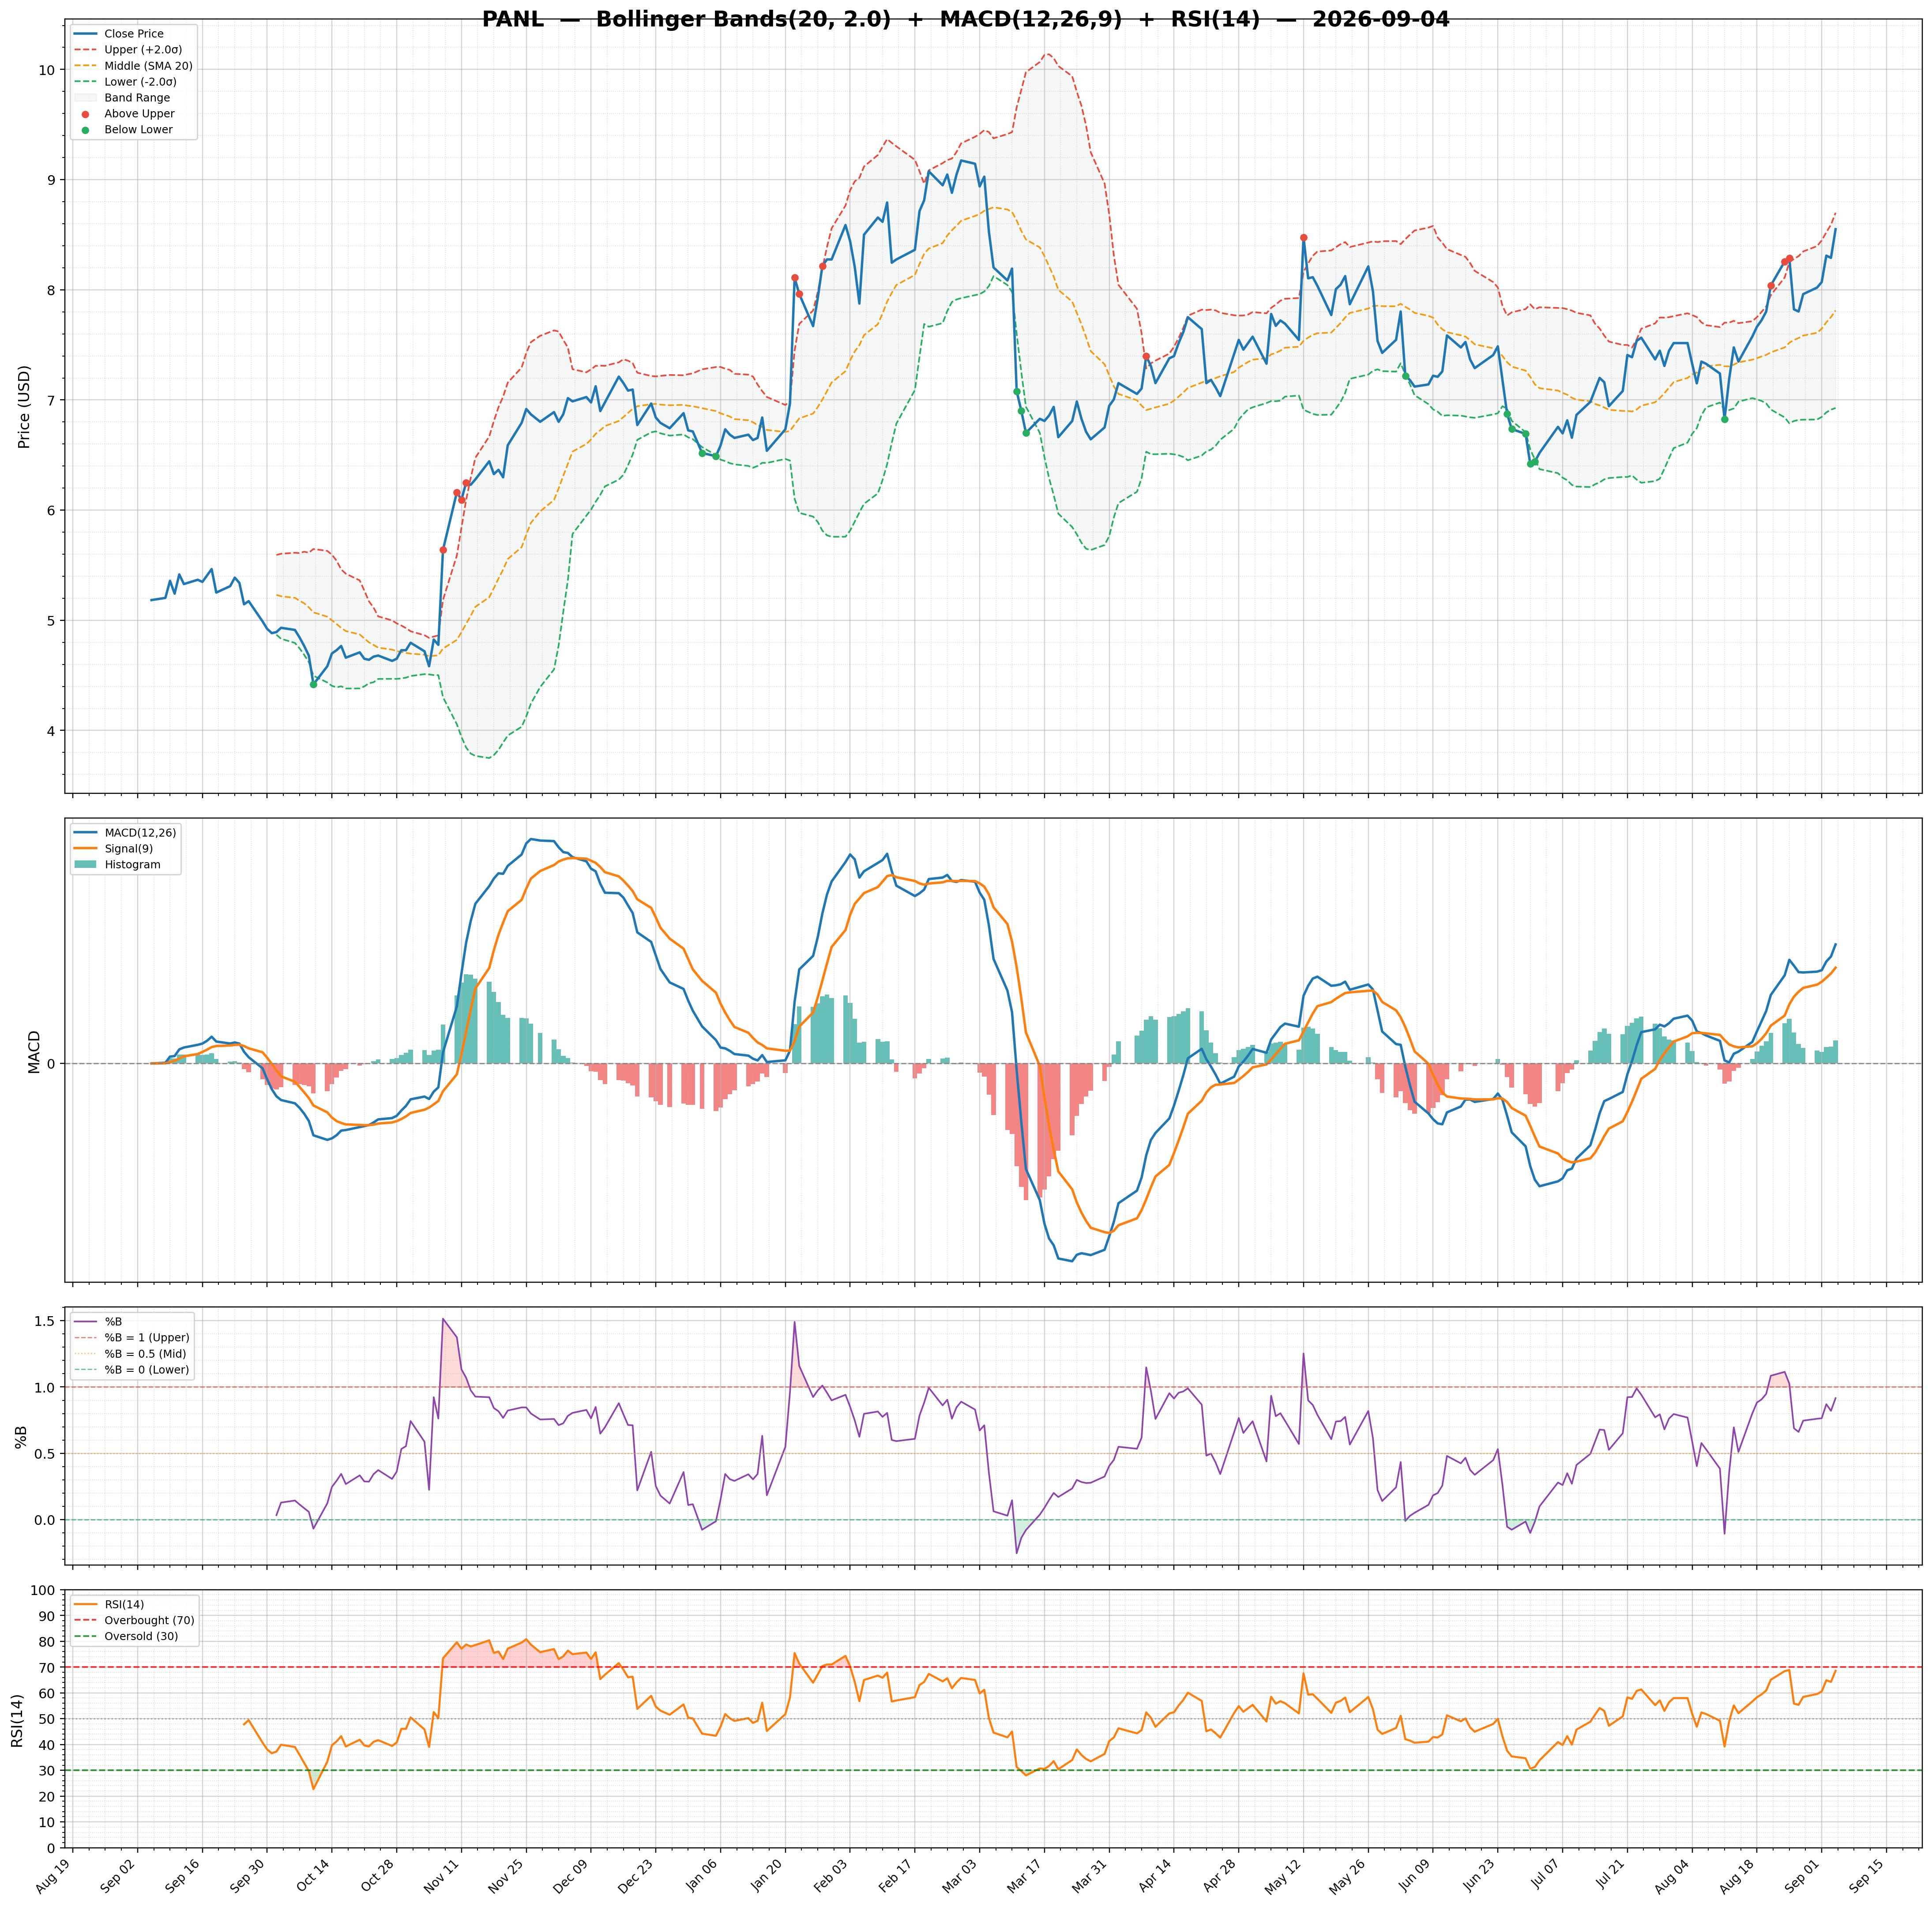
| RSI | 42.09 | Volume | 0.49M | Rating | none |
| Previous RSI | 45.38 | Avg Volume 20D | 0.37M | Target Mean | $10.85 |
| RSI Trend | Down | Relative Volume | 0.66 | Target High | $11.50 |
| MACD | -0.10 | Lower Band | 7.51 | Target Low | $10.25 |
| MACD Signal | -0.02 | Middle Band | 8.14 | Target Median | $10.80 |
| Histogram | -0.08 | Upper Band | 8.76 | Analysts | 3 |
| Previous Histogram | -0.08 | Bandwidth | 15.380 | Upside | 42.58% |
| Histogram Trend | Increasing | %B | 0.21 | ||