PAR Technology Corporation (PAR)
Technology • Software - Application • $18.17 • MCap: 716,815,744
https://www.partech.com • PAR Technology Corporation, together with its subsidiaries, provides omnichannel cloud-based software and hardware solutions for the restaurant and retail industries worldwide. The company offers Punchh and PAR Ordering products and services for customer loyalty, engagement, and omnichannel digital ordering and delivery; PAR RETAIL, a digital engagement software solution; and PLEXURE, an international customer engagement and loyalty platform under the ENGAGEMENT CLOUD. It also provides PAR POS, a point-of-sale solution; TASK, an enterprise-grade technology solution; PAR OPS, which includes Data Central and Delaget; and PAR PAY, such as PAR payment services, and merchant services under the OPERATOR CLOUD. In addition, the company offers point-of-sale terminals and tablets, wireless headsets, drive-thru systems, kitchen display systems, kiosks, printers, payment devices, and other in-store peripherals. Further it provides services, such as hardware repair, installation and implementation, training, and on-site and technical support services. It serves enterprise restaurants, franchisees, and other restaurant outlets and to C-Stores; and other retail customers, including amusement parks, cinemas, cruise lines, spas, casinos, and other ticketing and entertainment venues. The company was founded in 1968 and is headquartered in New Hartford, New York.
ET
| Score | Price | 52 Week & Averages | Relative Strength | Risk | |||||
|---|---|---|---|---|---|---|---|---|---|
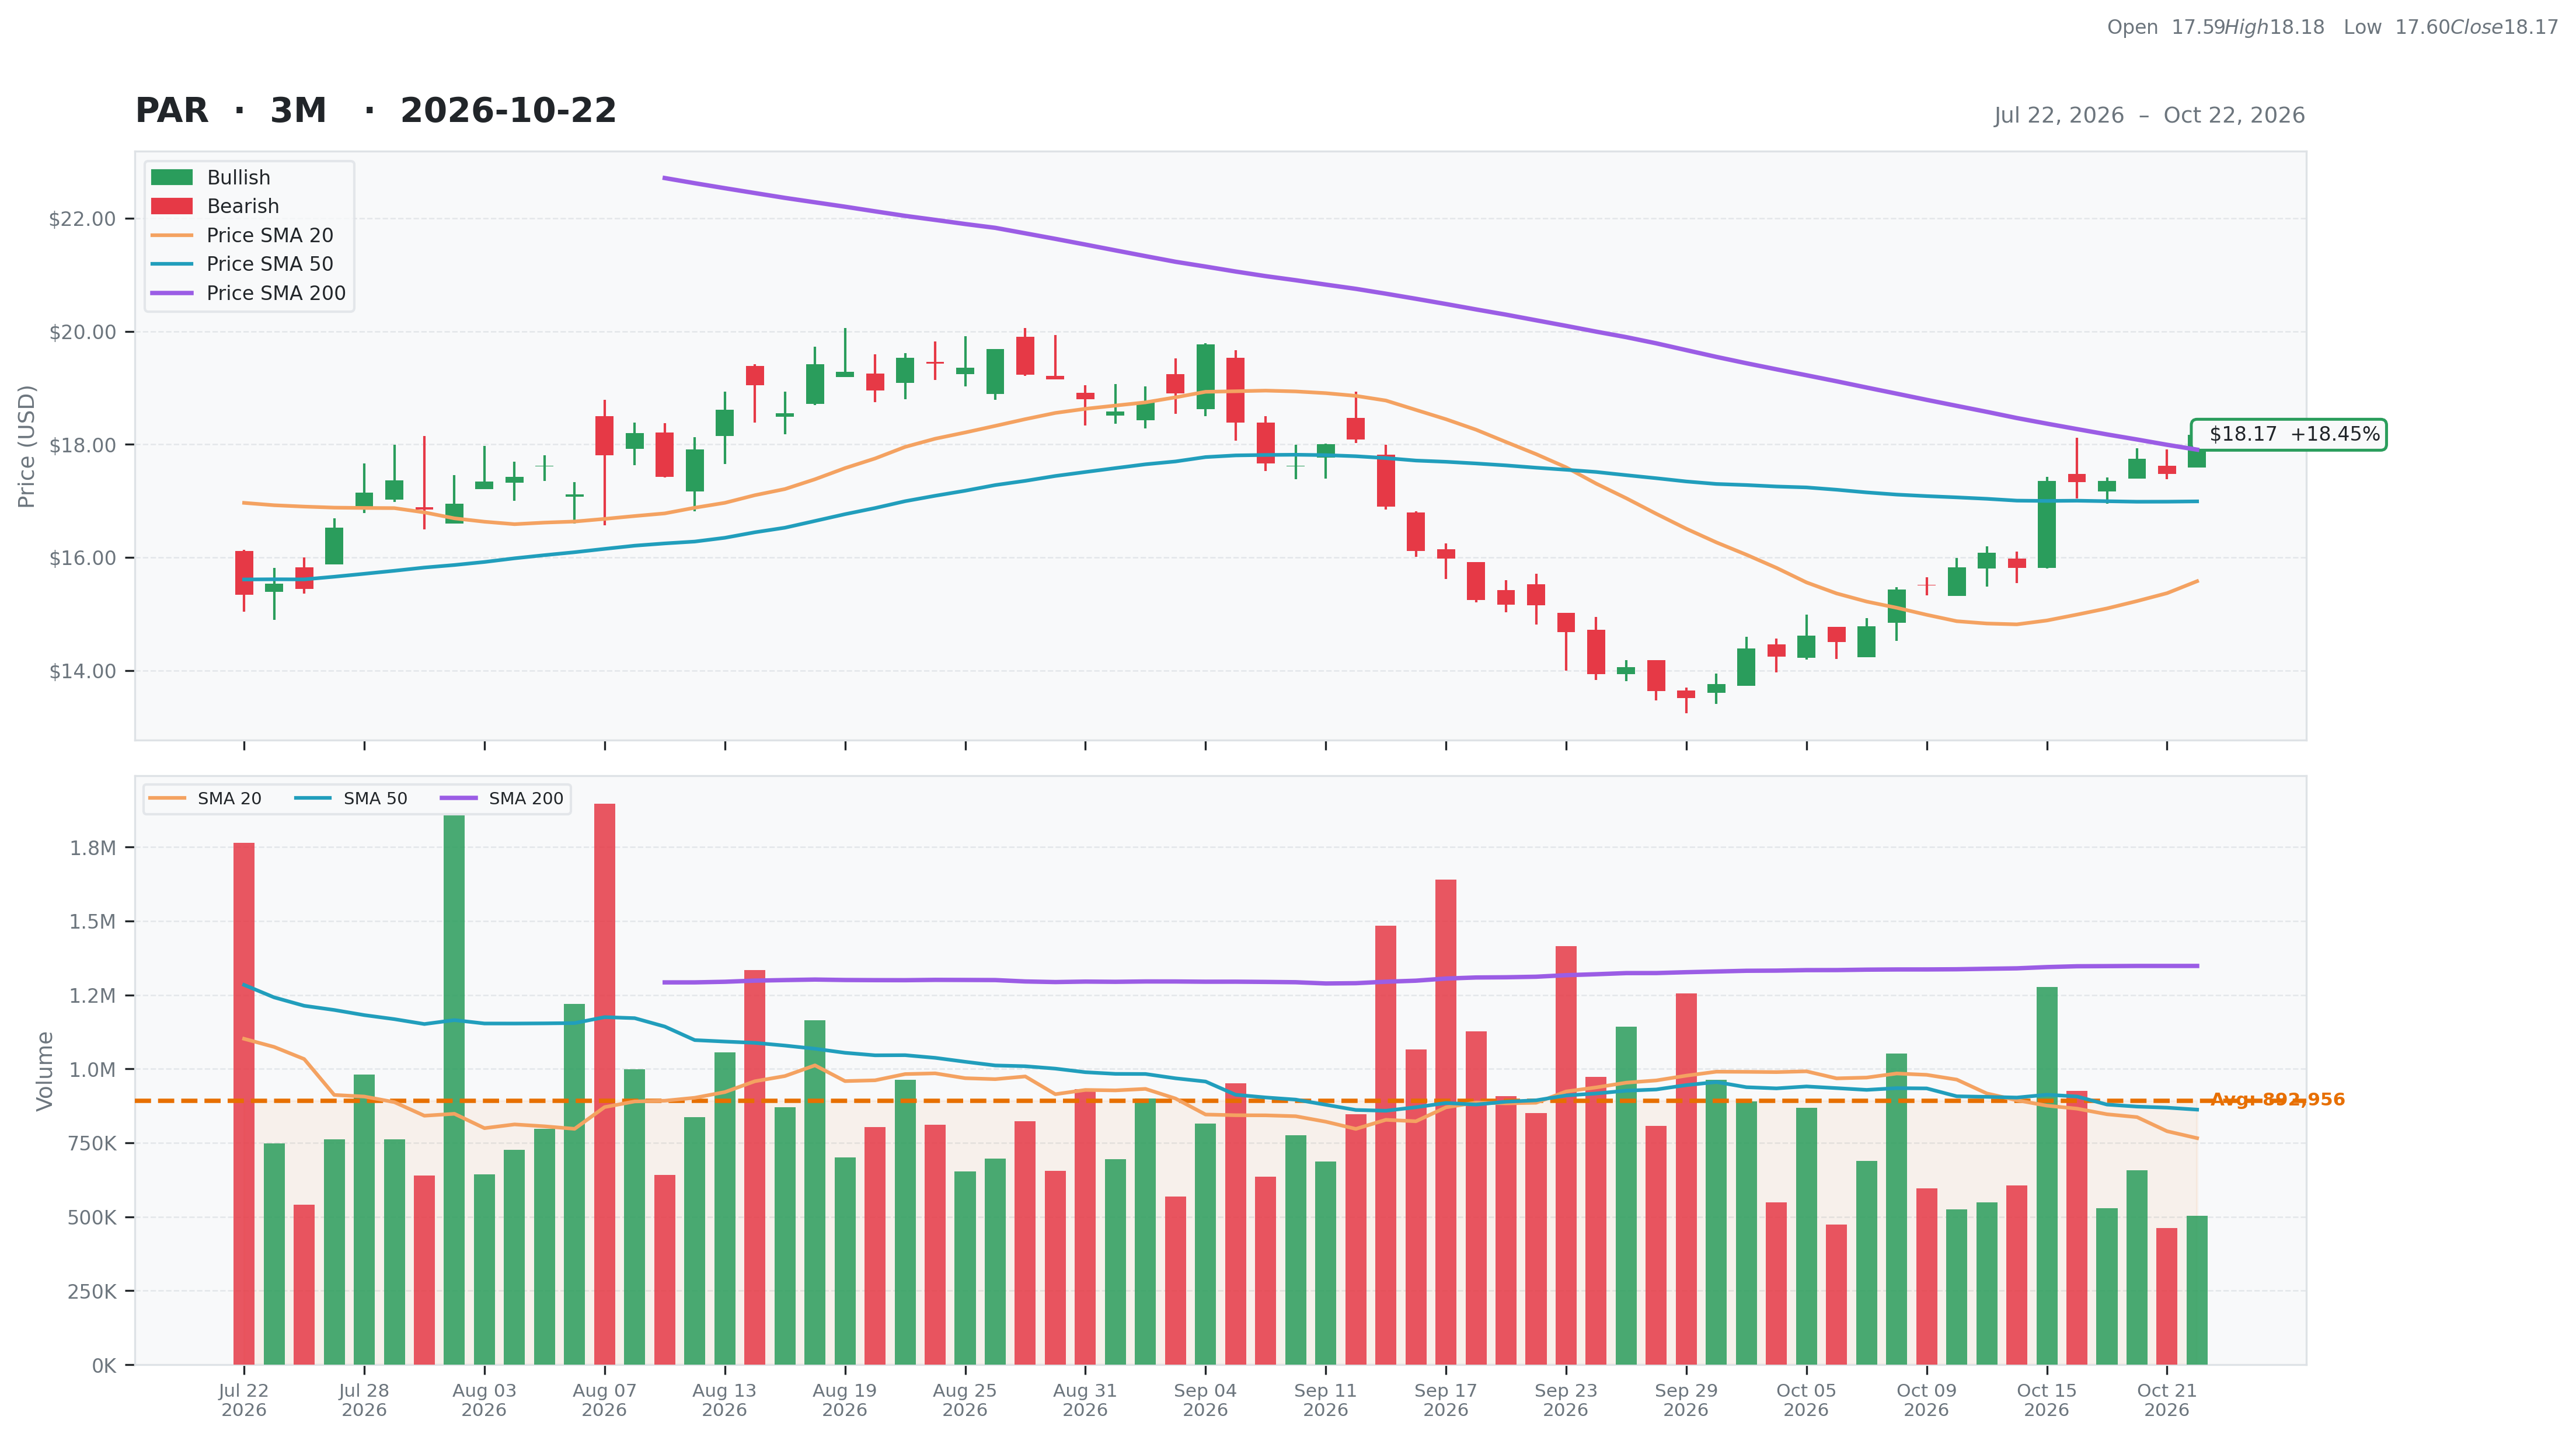
| Total | 49 | Current | $18.17 | 52W High | $39.72 -54.25% | Relative Strength | -0.05 | Beta | 1.35 |
| Business Quality | 7 | Weekly | $17.35 4.73% | 52W Low | $11.82 53.72% | 3M | 0.18 | Short % | 0.23 |
| Financial Strength | 14 | Monthly | $15.15 19.93% | Above 50DMA | $16.99 6.93% | 6M | 0.35 | Risk Score | 4 |
| Growth Outlook | 1 | Quarterly | $15.44 17.68% | Above 200DMA | $17.91 1.47% | 9M | -0.46 | ||
| Momentum | 5 | Yearly | $36.24 -49.86% | 12M | -0.50 | ||||
| Valuation | Financial Strength | Growth/Profitability | |||
|---|---|---|---|---|---|
| Trailing P/E | N/A | Cash | 78M | Revenue Growth | 0.19% |
| Forward P/E | 12.13 | Debt | 432M | Earnings Growth | N/A |
| PEG Ratio | 0.77 | Debt/Equity | 53.03 | Qtr Earnings Growth | N/A |
| Price/Sales | 1.44 | Current Ratio | 2.21 | Gross Margin | 0.43% |
| Price/Book | 0.88 | Quick Ratio | 1.51 | Operating Margin | -0.06% |
| EV/Revenue | 2.15 | Operating CF | -13M | Profit Margin | -0.15% |
| EV/EBITDA | -37.45 | Free CF | 10M | EBITDA Margin | -0.06% |
| Ent Value | 1,070M | Return on Assets | -0.02% | ||
| Return on Equity | -0.09% | ||||
| Technical | Volume & Bollinger Bands | Analyst | |||
|---|---|---|---|---|---|
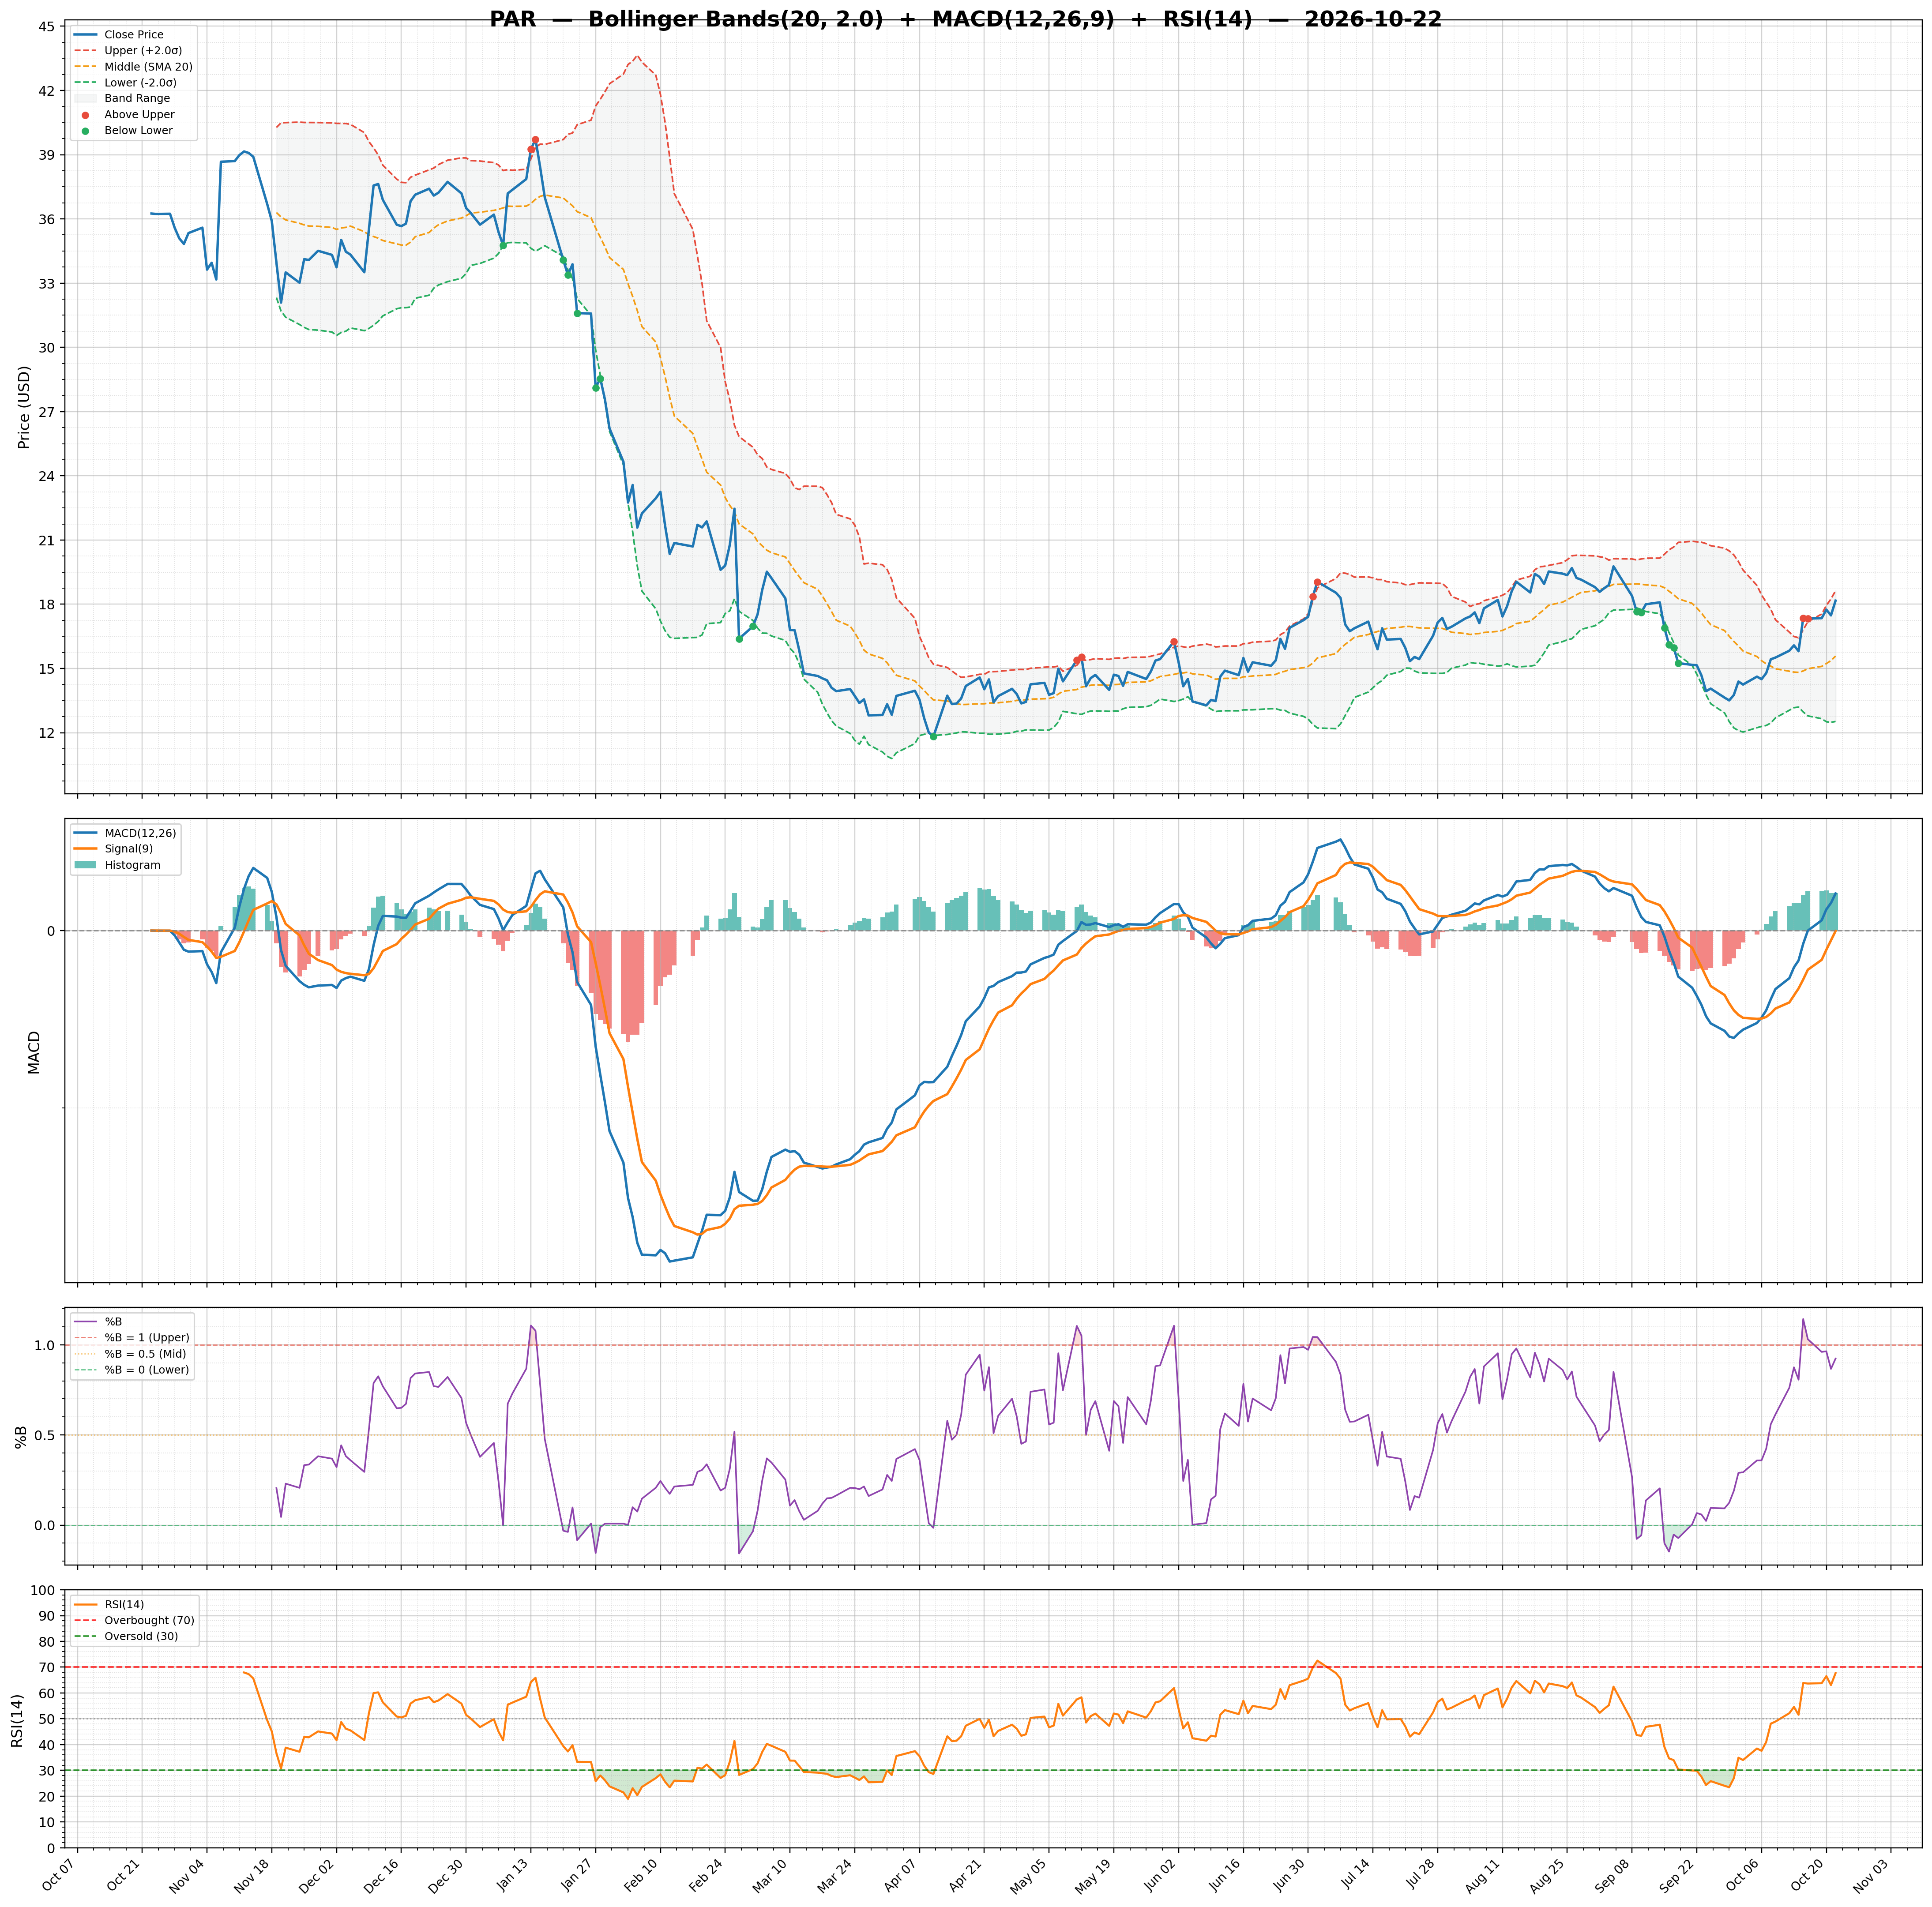
| RSI | 67.70 | Volume | 0.93M | Rating | buy |
| Previous RSI | 63.06 | Avg Volume 20D | 0.77M | Target Mean | $24.94 |
| RSI Trend | Up | Relative Volume | 0.57 | Target High | $33.00 |
| MACD | 0.42 | Lower Band | 12.52 | Target Low | $17.50 |
| MACD Signal | -0.00 | Middle Band | 15.58 | Target Median | $26.50 |
| Histogram | 0.42 | Upper Band | 18.64 | Analysts | 8 |
| Previous Histogram | 0.42 | Bandwidth | 39.220 | Upside | 43.90% |
| Histogram Trend | Increasing | %B | 0.92 | ||