PEG
Public Service Enterprise Group (PEG)
Utilities • Utilities - Regulated Electric • $73.70 • MCap: 36,733,554,688
🌐
https://investor.pseg.com • Public Service Enterprise Group Incorporated, through its subsidiaries, operates in electric and gas utility, and nuclear generation businesses in the United States. It operates through PSE&G and PSEG Power segments. The PSE&G segment transmits electricity; distributes electricity and natural gas to residential, commercial, and industrial customers; and appliance services and repairs to customers through its service territory, as well as invests in solar generation projects, and energy efficiency and related programs. The PSEG Power segment engages in nuclear generation businesses; and supplies power and natural gas to nuclear power plants. As of December 31, 2025, it had electric transmission and distribution system of 25,000 circuit miles and 871,000 poles; 58 switching stations with an installed capacity of 40,000 megavolt-amperes (MVA), and 238 substations with an installed capacity of 10,890 MVA; four electric distribution headquarters and five electric sub-headquarters; 18,000 miles of gas mains, 12 gas distribution headquarters, two sub-headquarters, and two meter shop, as well as 54 natural gas metering and regulating stations; and 158 MegaWatts defined conditions of installed PV solar capacity. The company was founded in 1903 and is based in Newark, New Jersey.
Buy Decision Core
Total Score
37
Business Quality
14
Financial Strength
5
Growth Outlook
4
Momentum
1
Price Action
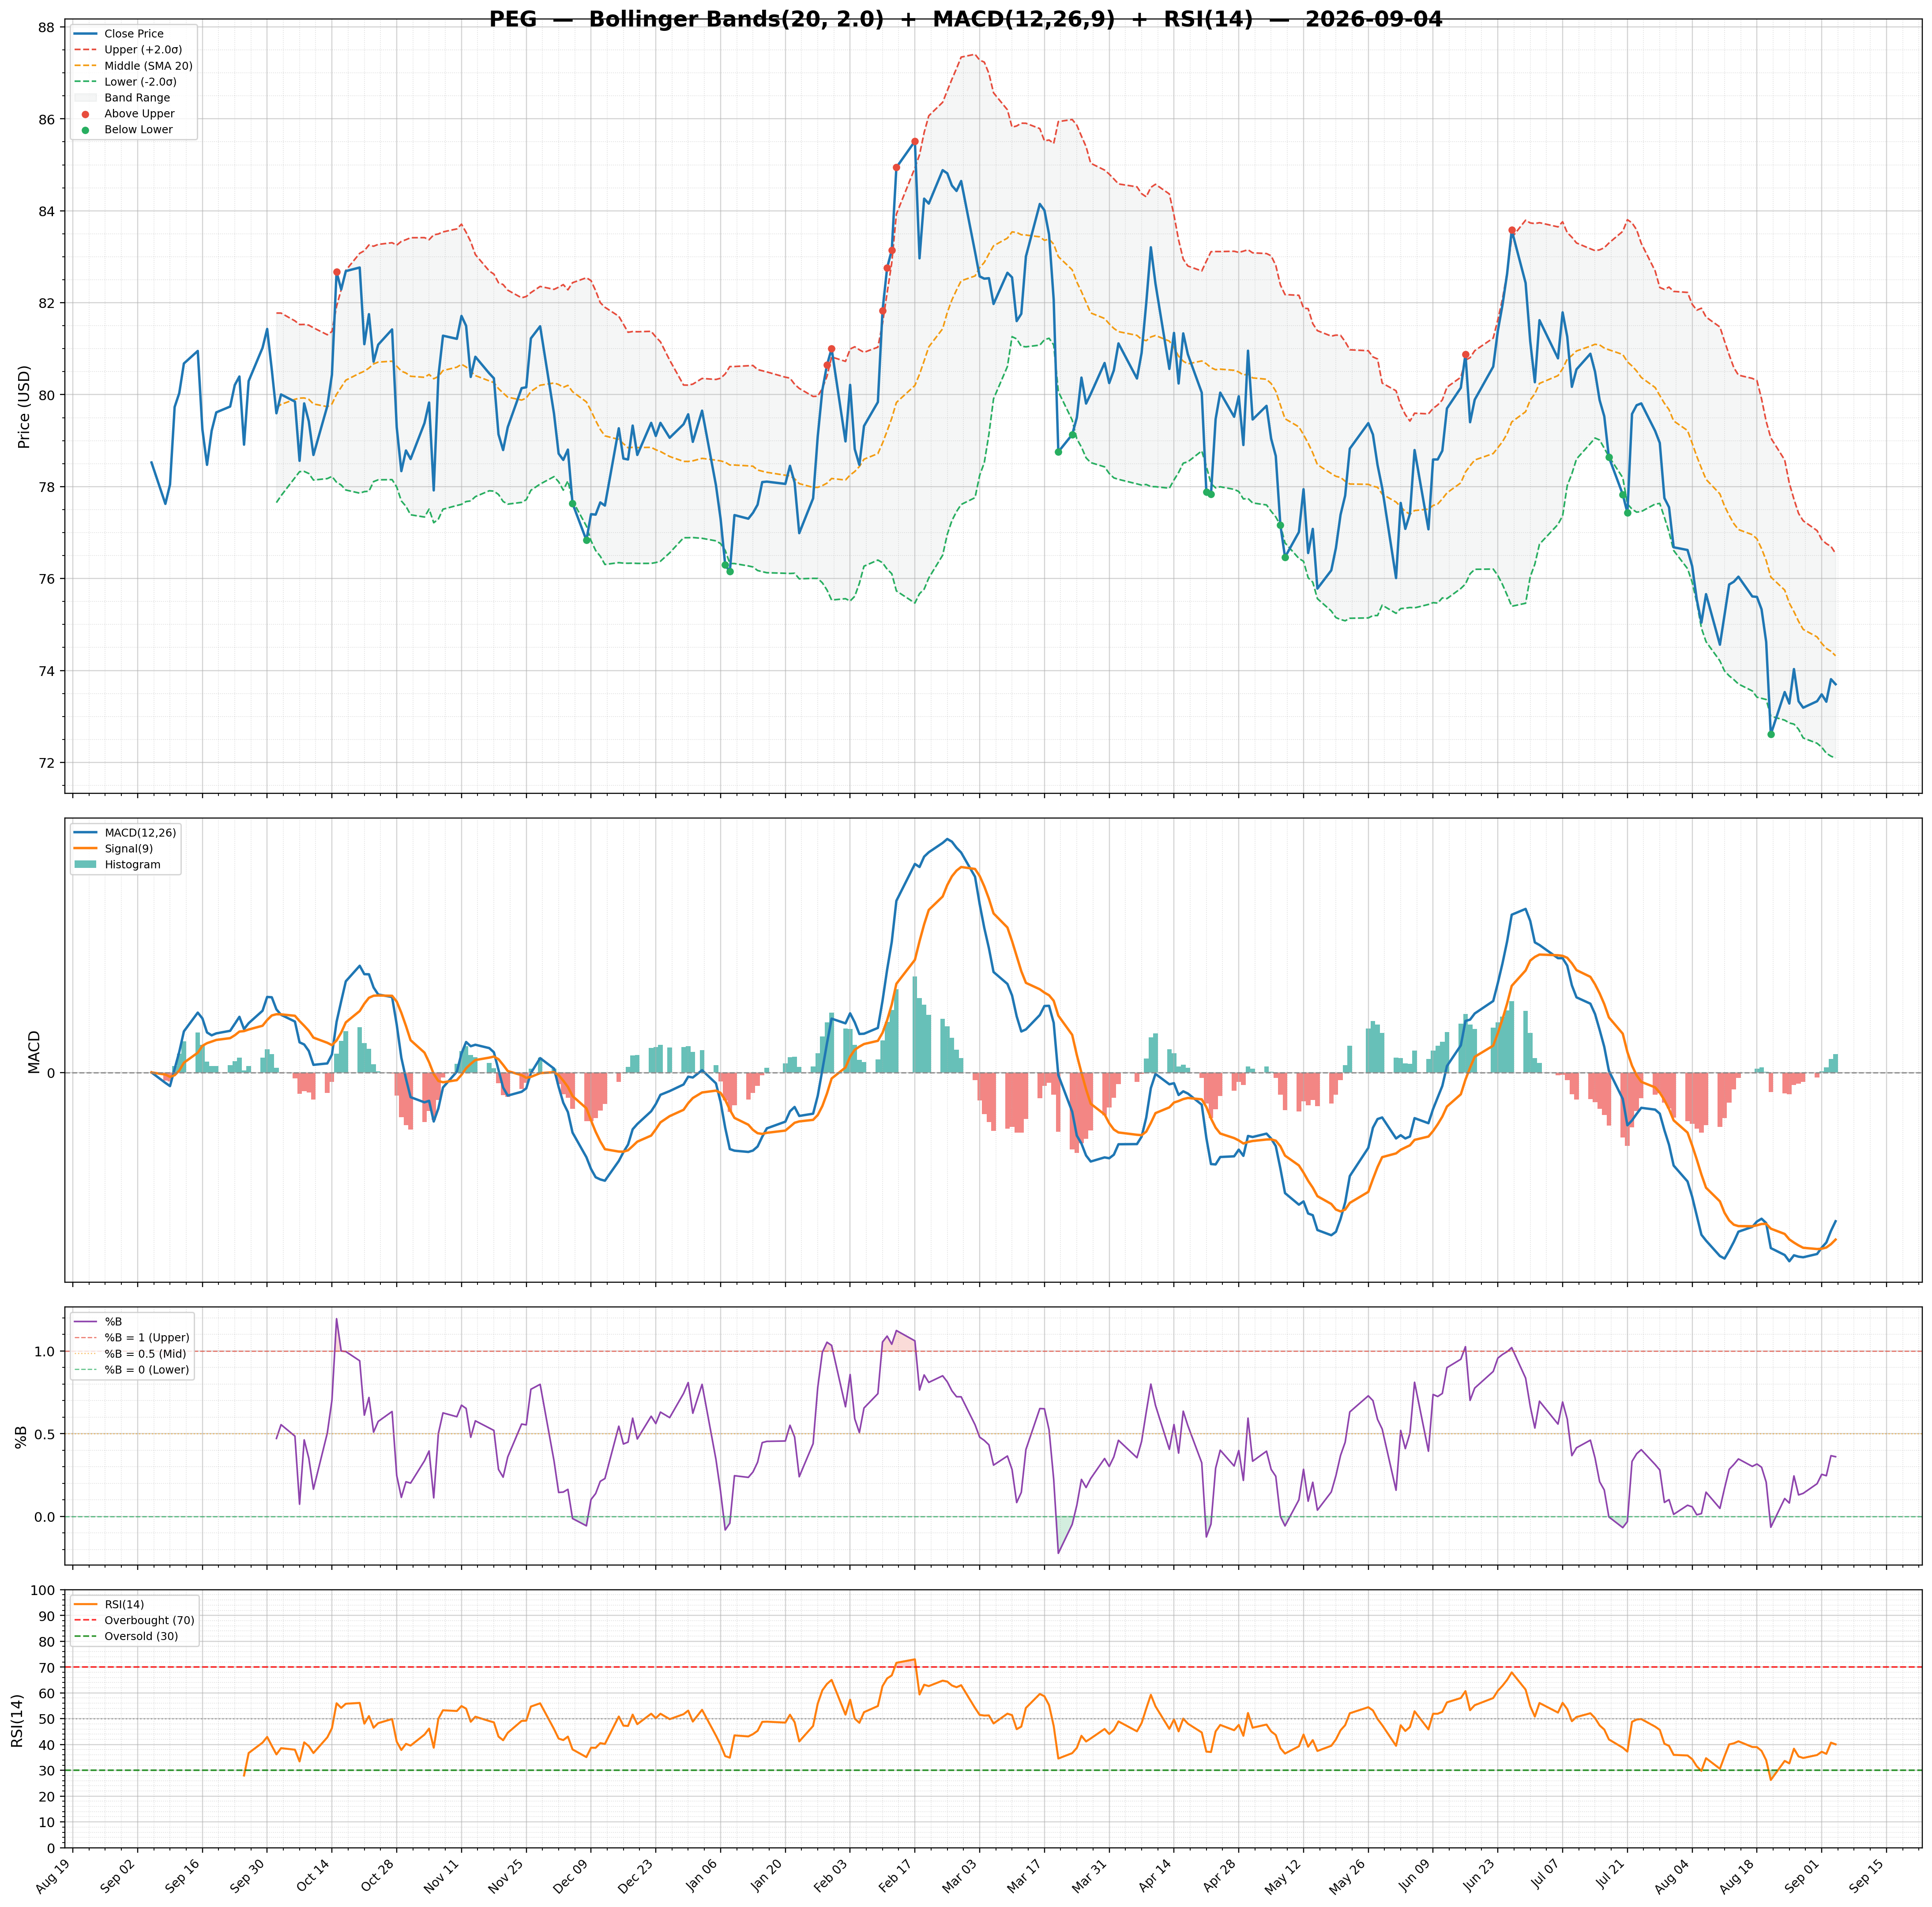
Current
73.70
52W High
85.51
52W Low
72.61
Above 50DMA
77.26 (-4.61%)
Above 200DMA
79.17 (-6.91%)
Relative Strength
Relative Strength
-0.07
RS 3M
-0.06
RS 6M
-0.1
RS 9M
-0.06
RS 12M
-0.06
Fundamentals
Revenue Growth
-0.09%
Earnings Growth
-0.43%
ROE
0.12%
ROA
0.03%
Valuation
PE (Fwd)
15.77
PEG
3.45
P/B
2.12
Upside
15.97%
Risk
Beta
0.52
Short %
0.02
Risk Score
2.00
Analyst
Rating
buy
Target
85.47
Beta
0.52
Analysts
0
Total Score
37
Upside
15.97%
Relative Strength
-0.07
Beta
0.52
Why Buy?
- Analyst upside exceeds 15%
Key Risks
- Revenue growth is negative
- Earnings growth is negative
- Weak long-term relative strength
Score Breakdown
Business
14
14
Financial
5
5
Growth
4
4
Valuation
7
7
Risk
4
4
Momentum
1
1
Technical
52W High: 85.51
52W Low: 72.61
Above 50DMA: -4.61%
Above 200DMA: -6.91%
Valuation
Forward PE: 15.77
PEG: 3.45
P/B: 2.12
Upside: 15.97%
Risk
Beta: 0.52
Short Float: 0.02%
ROE: 0.12%
ROA: 0.03%