Perion Network Ltd (PERI)
Communication Services • Advertising Agencies • $8.75 • MCap: 360,987,232
https://www.perion.com • Perion Network Ltd. provides digital advertising solutions to brands, agencies, and retailers in the United States and internationally. It offers Perion One, a platform that offers seamless, streamlined experience for supply and demand side customers; Outmax AI Agent, an production-grade AI execution agent; Buying Technologies, designed to assist advertisers with campaign planning, design, activation, and optimization by providing data-driven recommendations and automations; Creative Platform, a technology platform enables the automation of high impact ad unit production across all formats; Supply Technology & SODA, Supply Management set of technologies designed to facilitate relationships with publishers by treating impressions in an optimal manner; Supply Optimization & Demand Amplification, an AI solution that helps publishers improve the monetization of inventory; Search Advertising Technology, a publisher management system that provides publishers access to online dashboard; and Agentic Development. Further, the company provides a publisher management system that provides analytics and performance optimization tools, as well as reports; search-demand management systems; monetization products that deliver algorithmic search results concurrently with sponsored listings; and AI systems. In addition, it operates as a in-store retail media company. The company was formerly known as IncrediMail Ltd. and changed its name to Perion Network Ltd. in November 2011. Perion Network Ltd. was incorporated in 1999 and is headquartered in Tel Aviv-Yafo, Israel.
Ex-AAII
| Score | Price | 52 Week & Averages | Relative Strength | Risk | |||||
|---|---|---|---|---|---|---|---|---|---|
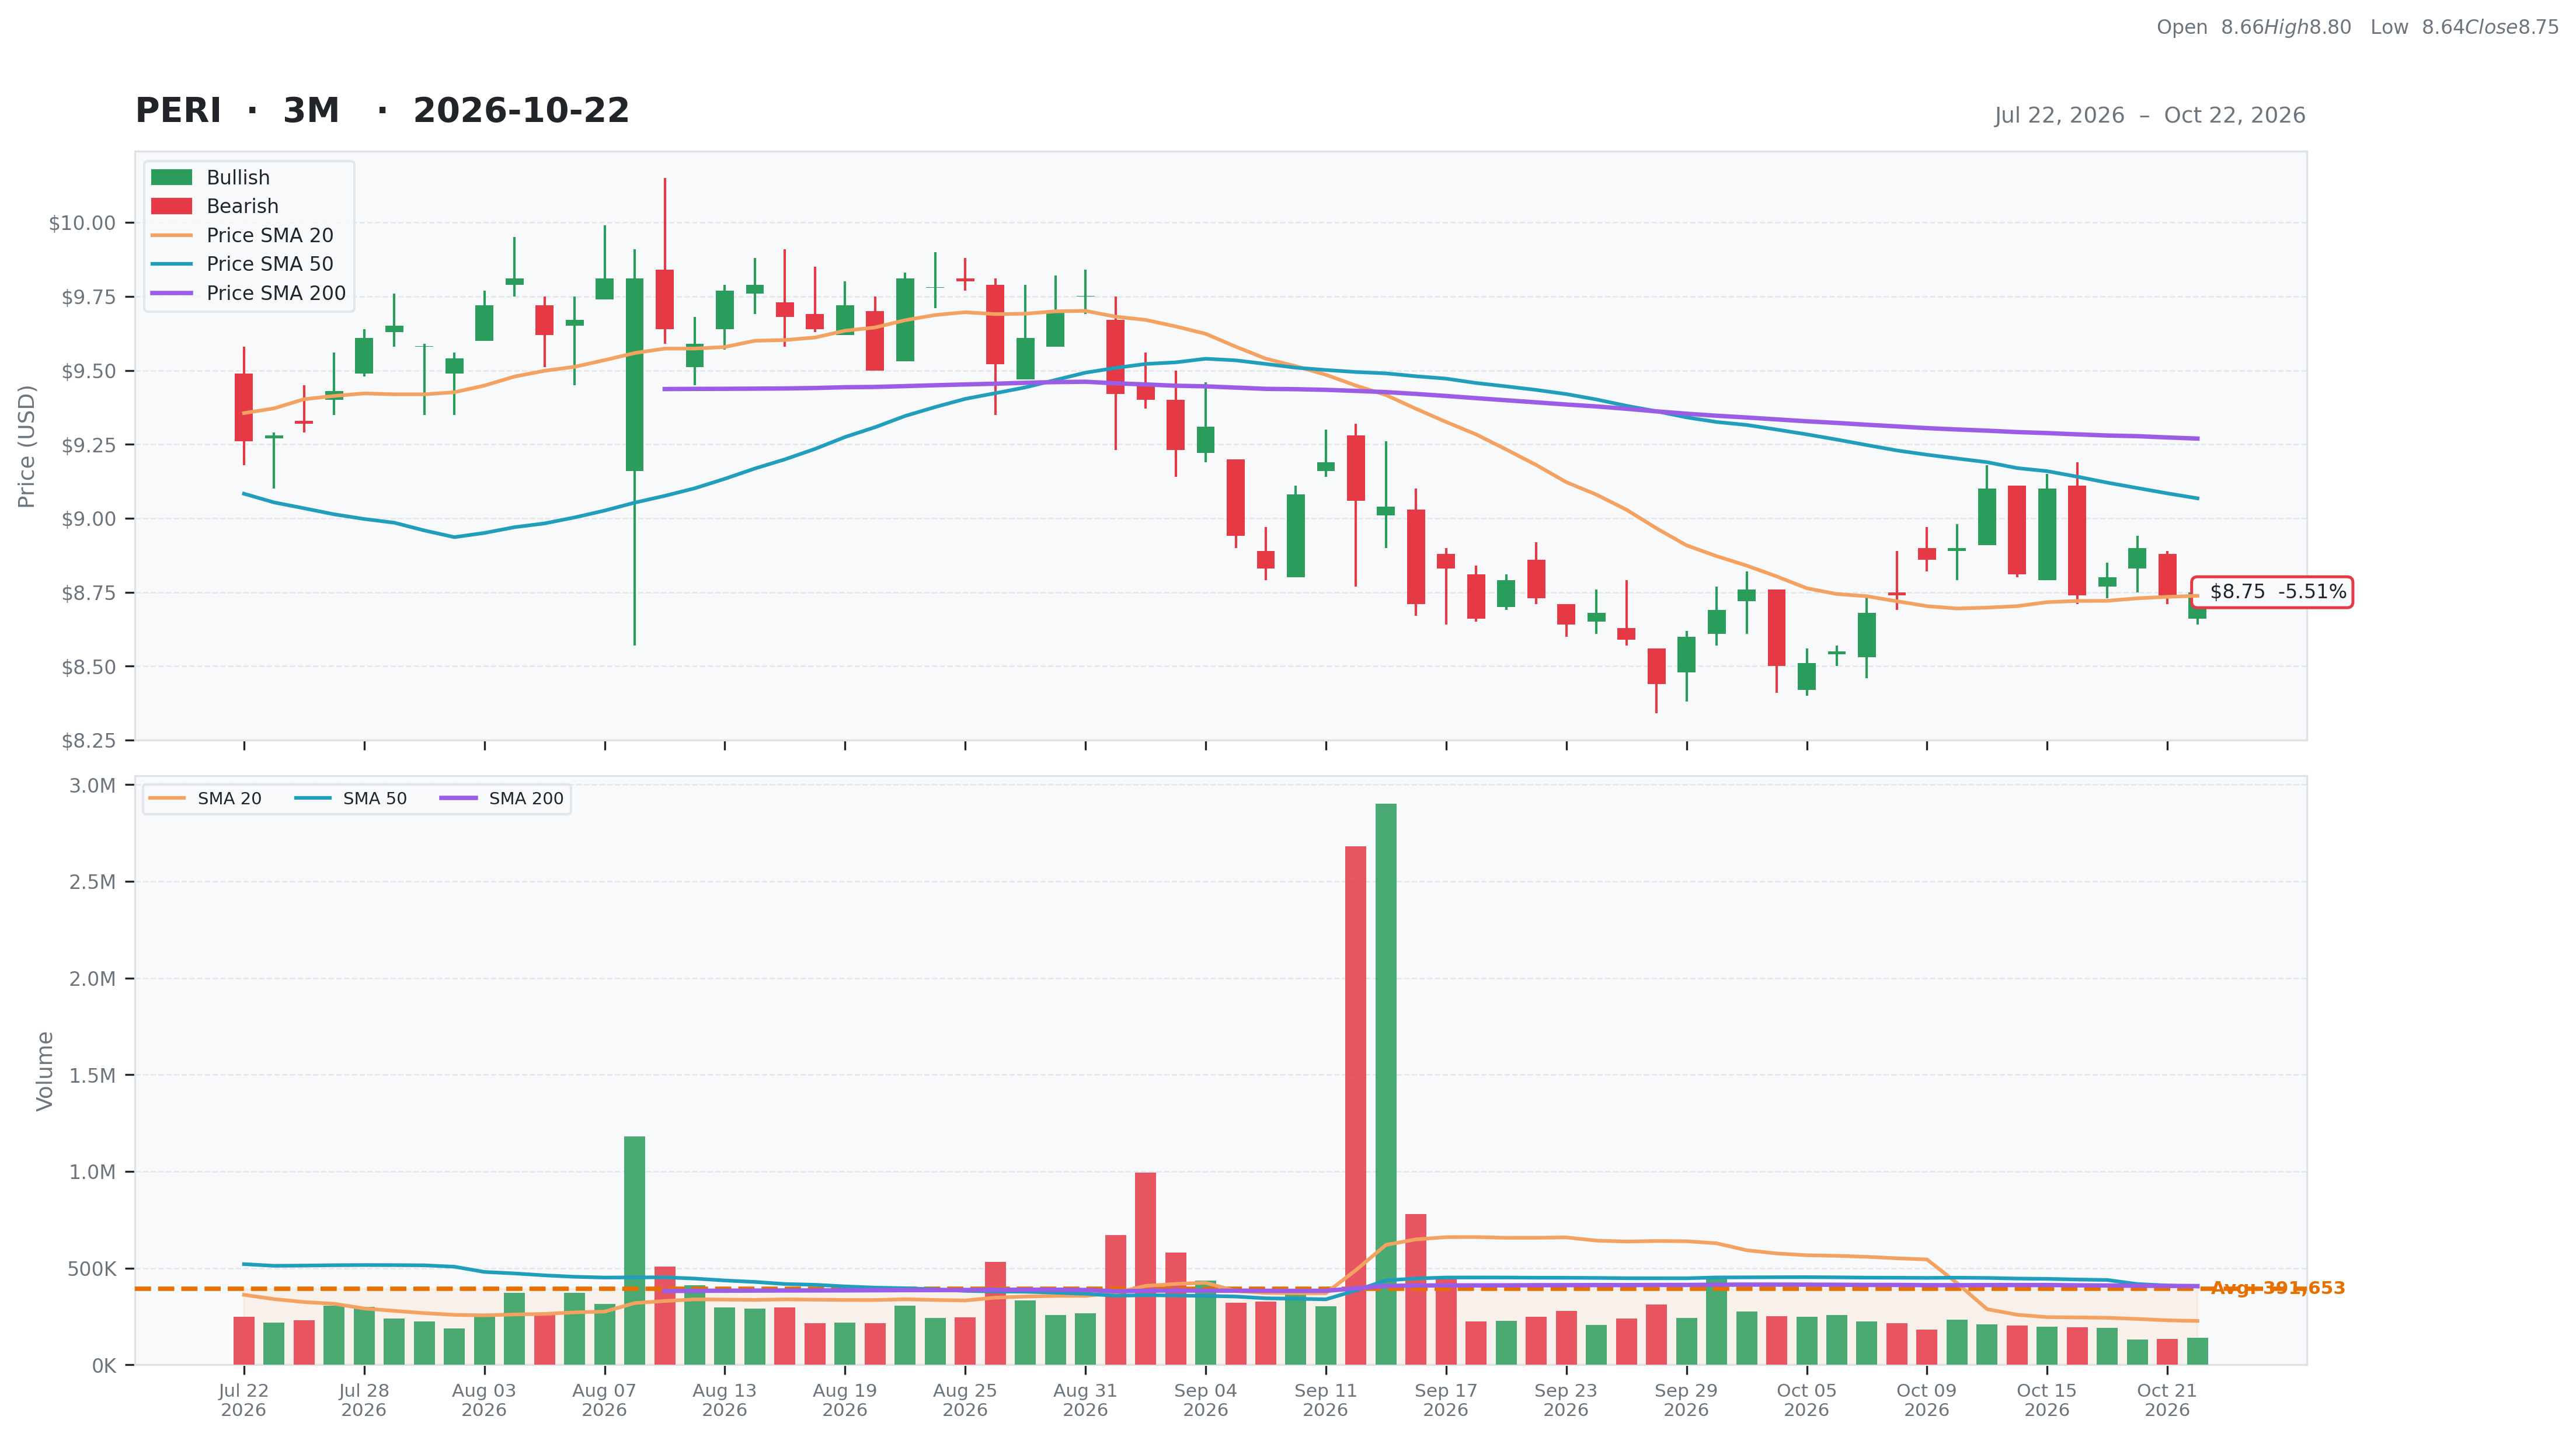
| Total | 42 | Current | $8.75 | 52W High | $11.06 -20.89% | Relative Strength | -0.08 | Beta | 1.13 |
| Business Quality | 4 | Weekly | $9.10 -3.85% | 52W Low | $7.71 13.49% | 3M | -0.06 | Short % | 0.03 |
| Financial Strength | 12 | Monthly | $8.73 0.23% | Above 50DMA | $9.07 -3.50% | 6M | -0.14 | Risk Score | |
| Growth Outlook | 1 | Quarterly | $9.32 -6.12% | Above 200DMA | $9.27 -5.60% | 9M | -0.06 | ||
| Momentum | 2 | Yearly | $9.68 -9.61% | 12M | -0.10 | ||||
| Valuation | Financial Strength | Growth/Profitability | |||
|---|---|---|---|---|---|
| Trailing P/E | N/A | Cash | 268M | Revenue Growth | -0.05% |
| Forward P/E | 6.18 | Debt | 22M | Earnings Growth | N/A |
| PEG Ratio | 0.72 | Debt/Equity | 3.55 | Qtr Earnings Growth | N/A |
| Price/Sales | 0.83 | Current Ratio | 2.53 | Gross Margin | 0.34% |
| Price/Book | 0.52 | Quick Ratio | 2.38 | Operating Margin | -0.08% |
| EV/Revenue | 0.18 | Operating CF | 37M | Profit Margin | -0.03% |
| EV/EBITDA | -7.87 | Free CF | 55M | EBITDA Margin | -0.02% |
| Ent Value | 78M | Return on Assets | -0.01% | ||
| Return on Equity | -0.02% | ||||
| Technical | Volume & Bollinger Bands | Analyst | |||
|---|---|---|---|---|---|
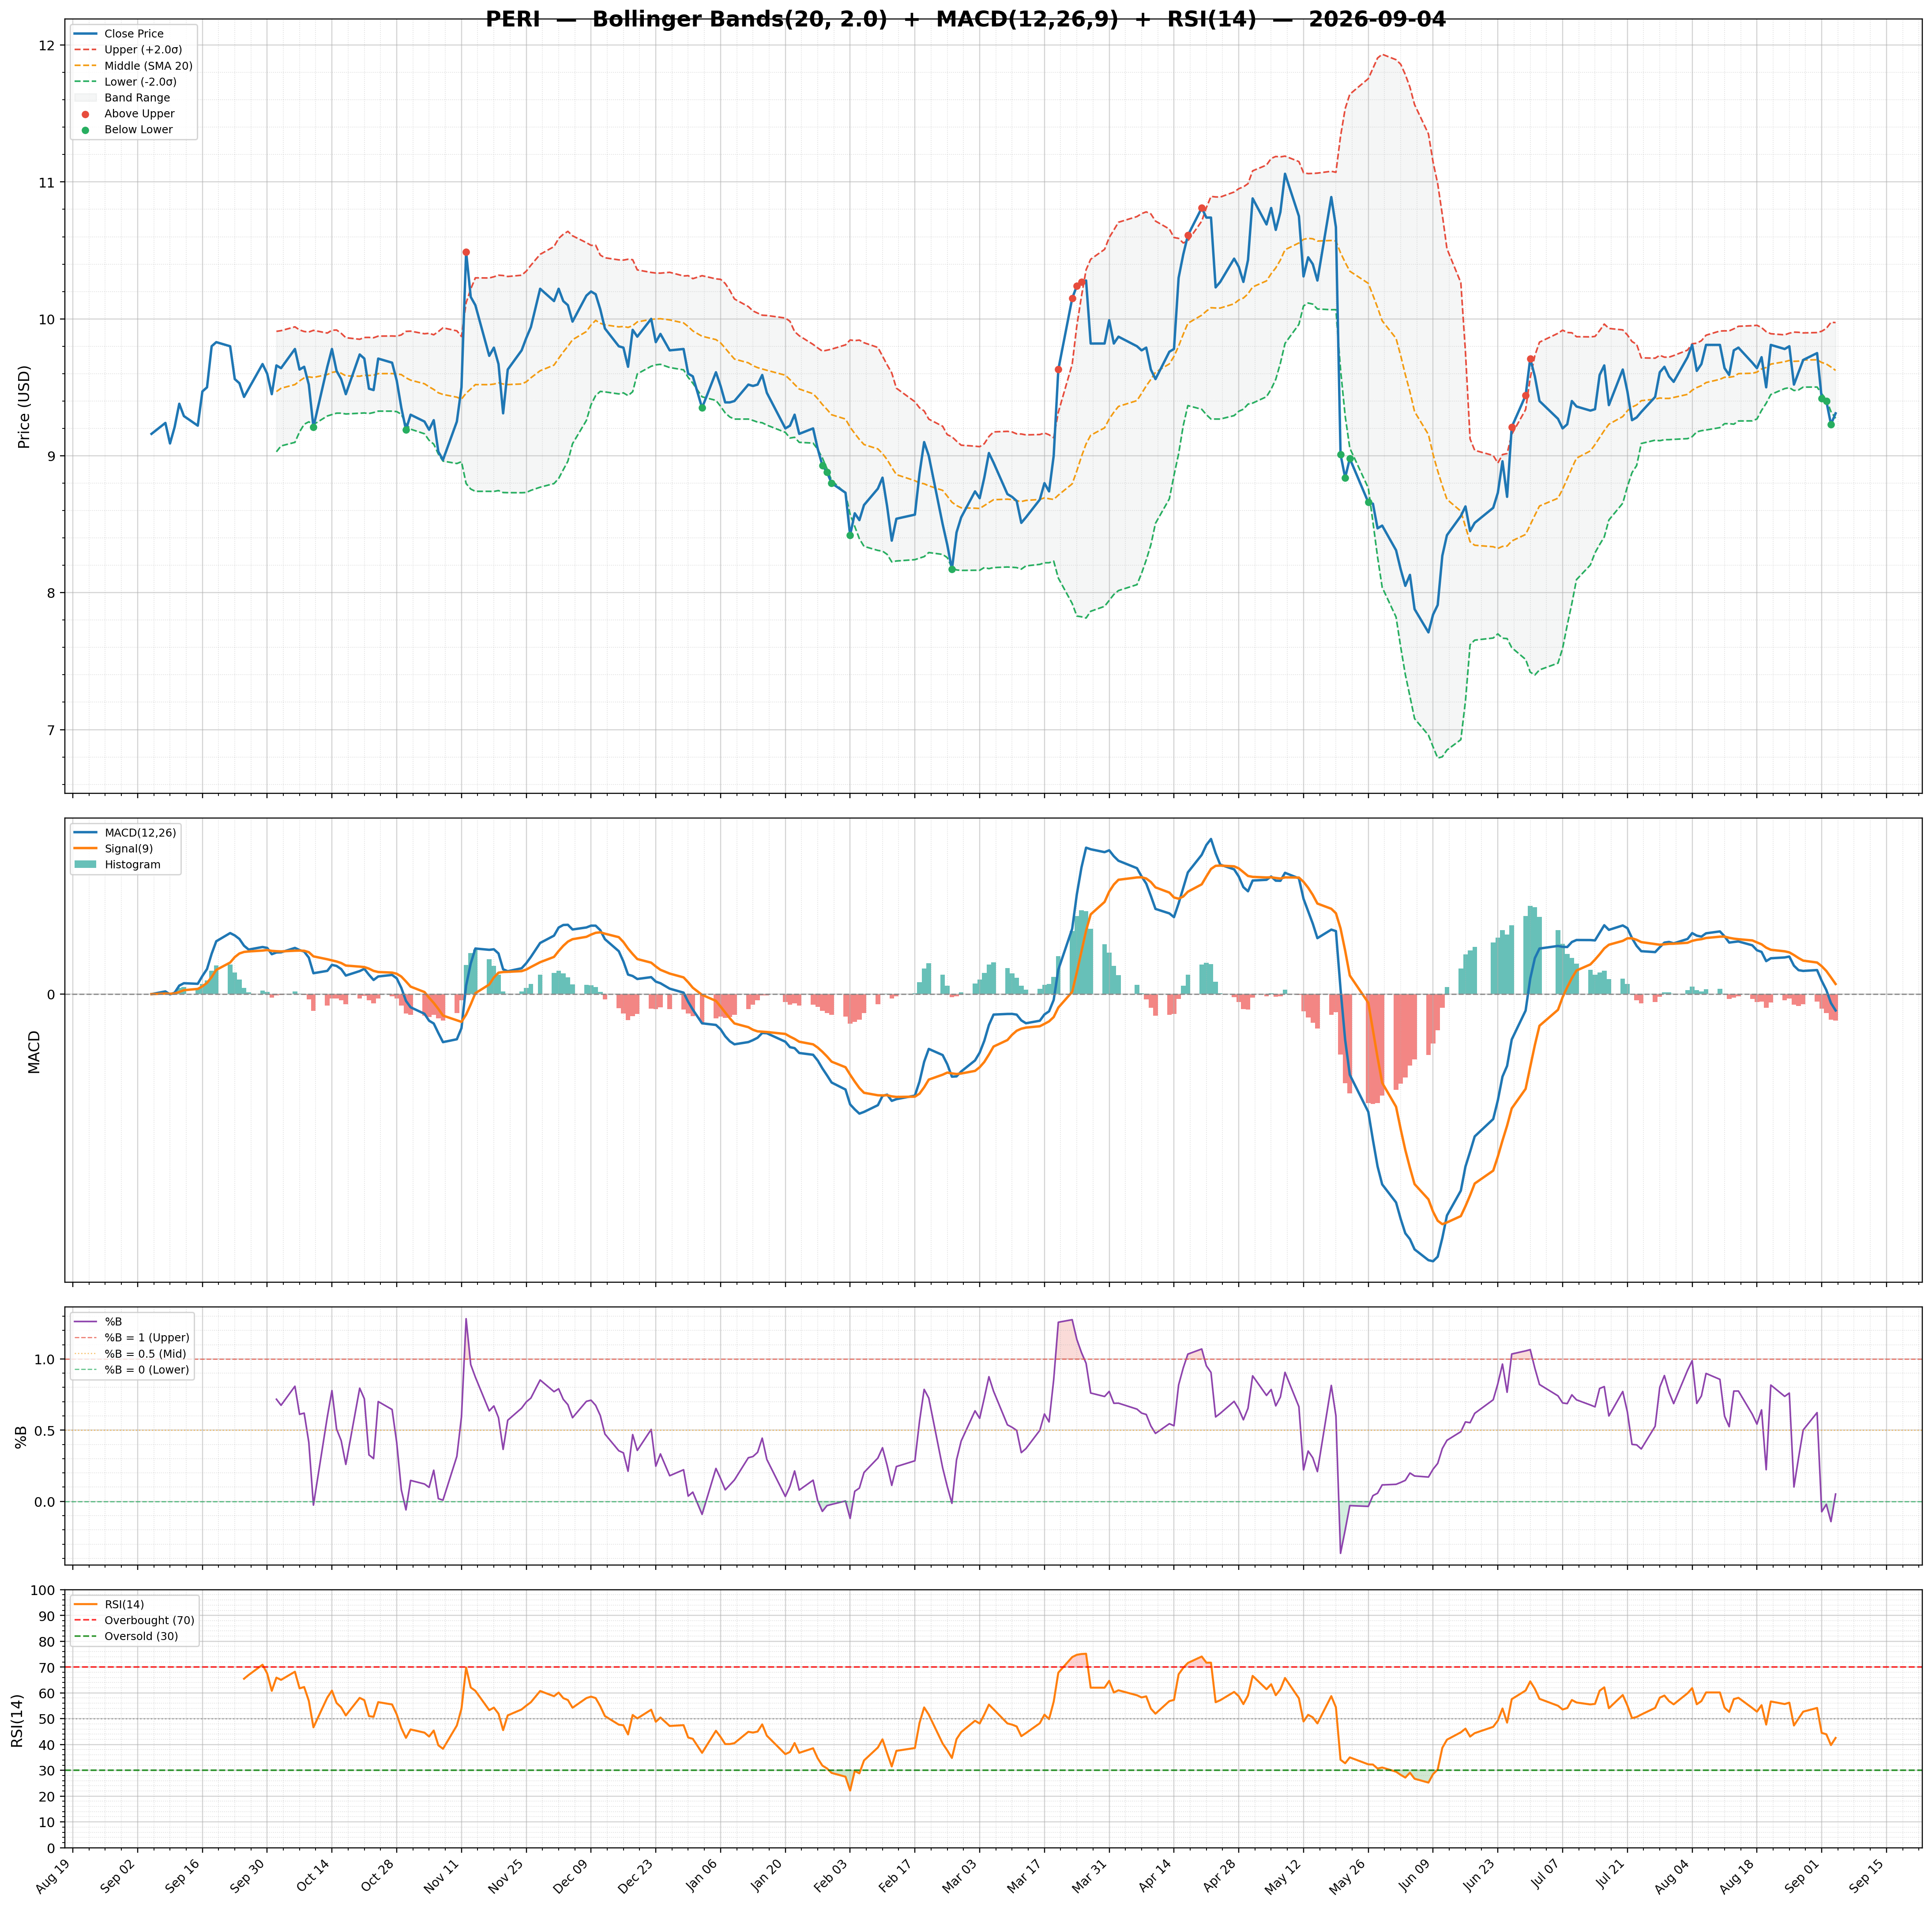
| RSI | 47.15 | Volume | 0.19M | Rating | buy |
| Previous RSI | 46.88 | Avg Volume 20D | 0.23M | Target Mean | $13.00 |
| RSI Trend | Up | Relative Volume | 0.33 | Target High | $14.00 |
| MACD | -0.04 | Lower Band | 8.38 | Target Low | $12.00 |
| MACD Signal | -0.06 | Middle Band | 8.74 | Target Median | $13.00 |
| Histogram | 0.02 | Upper Band | 9.10 | Analysts | 3 |
| Previous Histogram | 0.03 | Bandwidth | 8.260 | Upside | 48.74% |
| Histogram Trend | Decreasing | %B | 0.52 | ||