Progyny, Inc. (PGNY)
Healthcare • Healthcare Plans • $29.12 • MCap: 2,060,881,920
https://www.progyny.com • Progyny, Inc., a benefits management company, provides fertility, family building, and women's health benefits solutions in the United States. It offers fertility benefits solutions, such as differentiated benefits plan design that includes smart cycle treatment bundle; personalized concierge-style member support services; and a selective network of fertility specialists. The company also offers Progyny Rx, an integrated pharmacy benefits solution that provides access to the medications needed during their treatment and offers care management services, as well as pregnancy and postpartum, menopause and midlife, benefit and leave navigation, and parent and child wellbeing solutions. In addition, it provides assistance service program where various services can be offered through a reimbursement program, including adoption, surrogacy, doula, and travel reimbursement when travel is required to receive medical services. The company was formerly known as Auxogyn, Inc. and changed its name to Progyny, Inc. in 2015. Progyny, Inc. was incorporated in 2008 and is headquartered in New York, New York.
ET
| Score | Price | 52 Week & Averages | Relative Strength | Risk | |||||
|---|---|---|---|---|---|---|---|---|---|
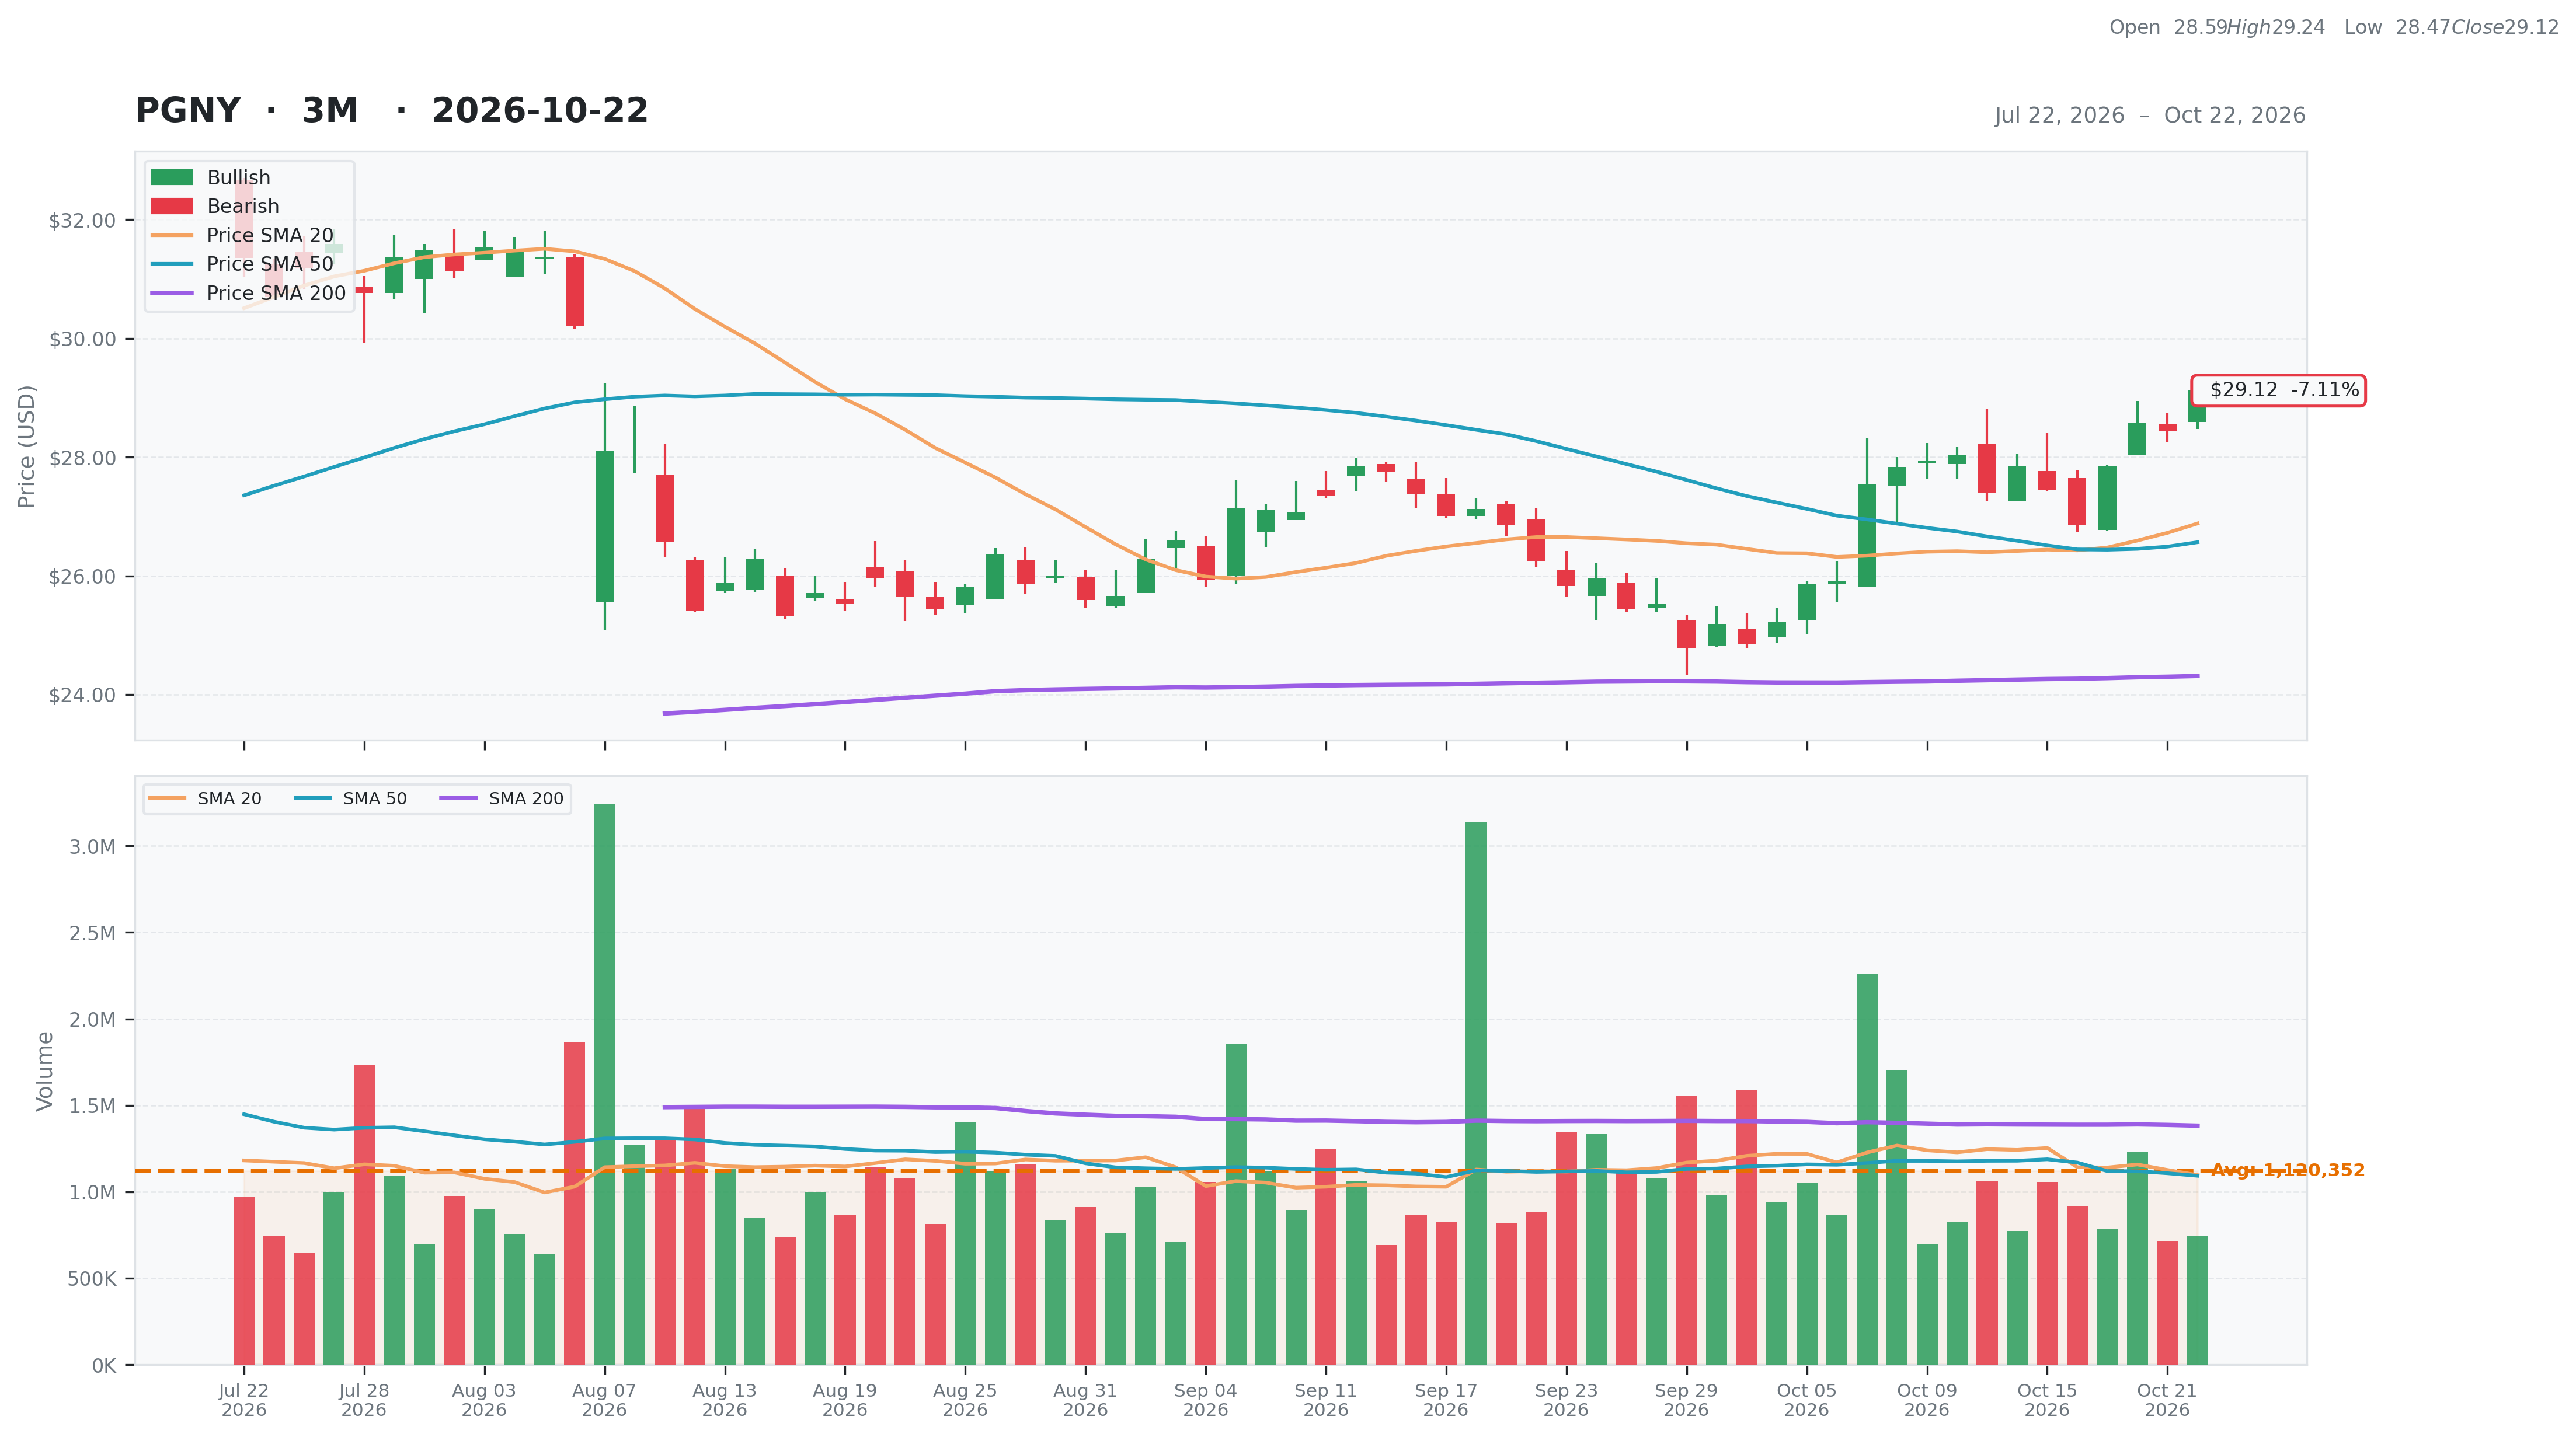
| Total | 70 | Current | $29.12 | 52W High | $32.36 -10.01% | Relative Strength | 0.23 | Beta | 1.02 |
| Business Quality | 11 | Weekly | $27.45 6.06% | 52W Low | $16.30 78.65% | 3M | -0.07 | Short % | 0.09 |
| Financial Strength | 16 | Monthly | $26.24 10.98% | Above 50DMA | $26.57 9.61% | 6M | 0.65 | Risk Score | 6 |
| Growth Outlook | 15 | Quarterly | $31.19 -6.64% | Above 200DMA | $24.31 19.77% | 9M | 0.16 | ||
| Momentum | 6 | Yearly | $19.53 49.10% | 12M | 0.49 | ||||
| Valuation | Financial Strength | Growth/Profitability | |||
|---|---|---|---|---|---|
| Trailing P/E | 29.20 | Cash | 237M | Revenue Growth | 0.05% |
| Forward P/E | 11.62 | Debt | 27M | Earnings Growth | 0.79% |
| PEG Ratio | N/A | Debt/Equity | 5.95 | Qtr Earnings Growth | 0.64% |
| Price/Sales | 1.57 | Current Ratio | 2.14 | Gross Margin | 0.25% |
| Price/Book | 4.55 | Quick Ratio | 2.06 | Operating Margin | 0.11% |
| EV/Revenue | 1.41 | Operating CF | 201M | Profit Margin | 0.06% |
| EV/EBITDA | 14.74 | Free CF | 196M | EBITDA Margin | 0.10% |
| Ent Value | 1,851M | Return on Assets | 0.10% | ||
| Return on Equity | 0.16% | ||||
| Technical | Volume & Bollinger Bands | Analyst | |||
|---|---|---|---|---|---|
| RSI | 64.75 | Volume | 0.92M | Rating | strong_buy |
| Previous RSI | 60.82 | Avg Volume 20D | 1.1M | Target Mean | $34.42 |
| RSI Trend | Up | Relative Volume | 0.65 | Target High | $40.00 |
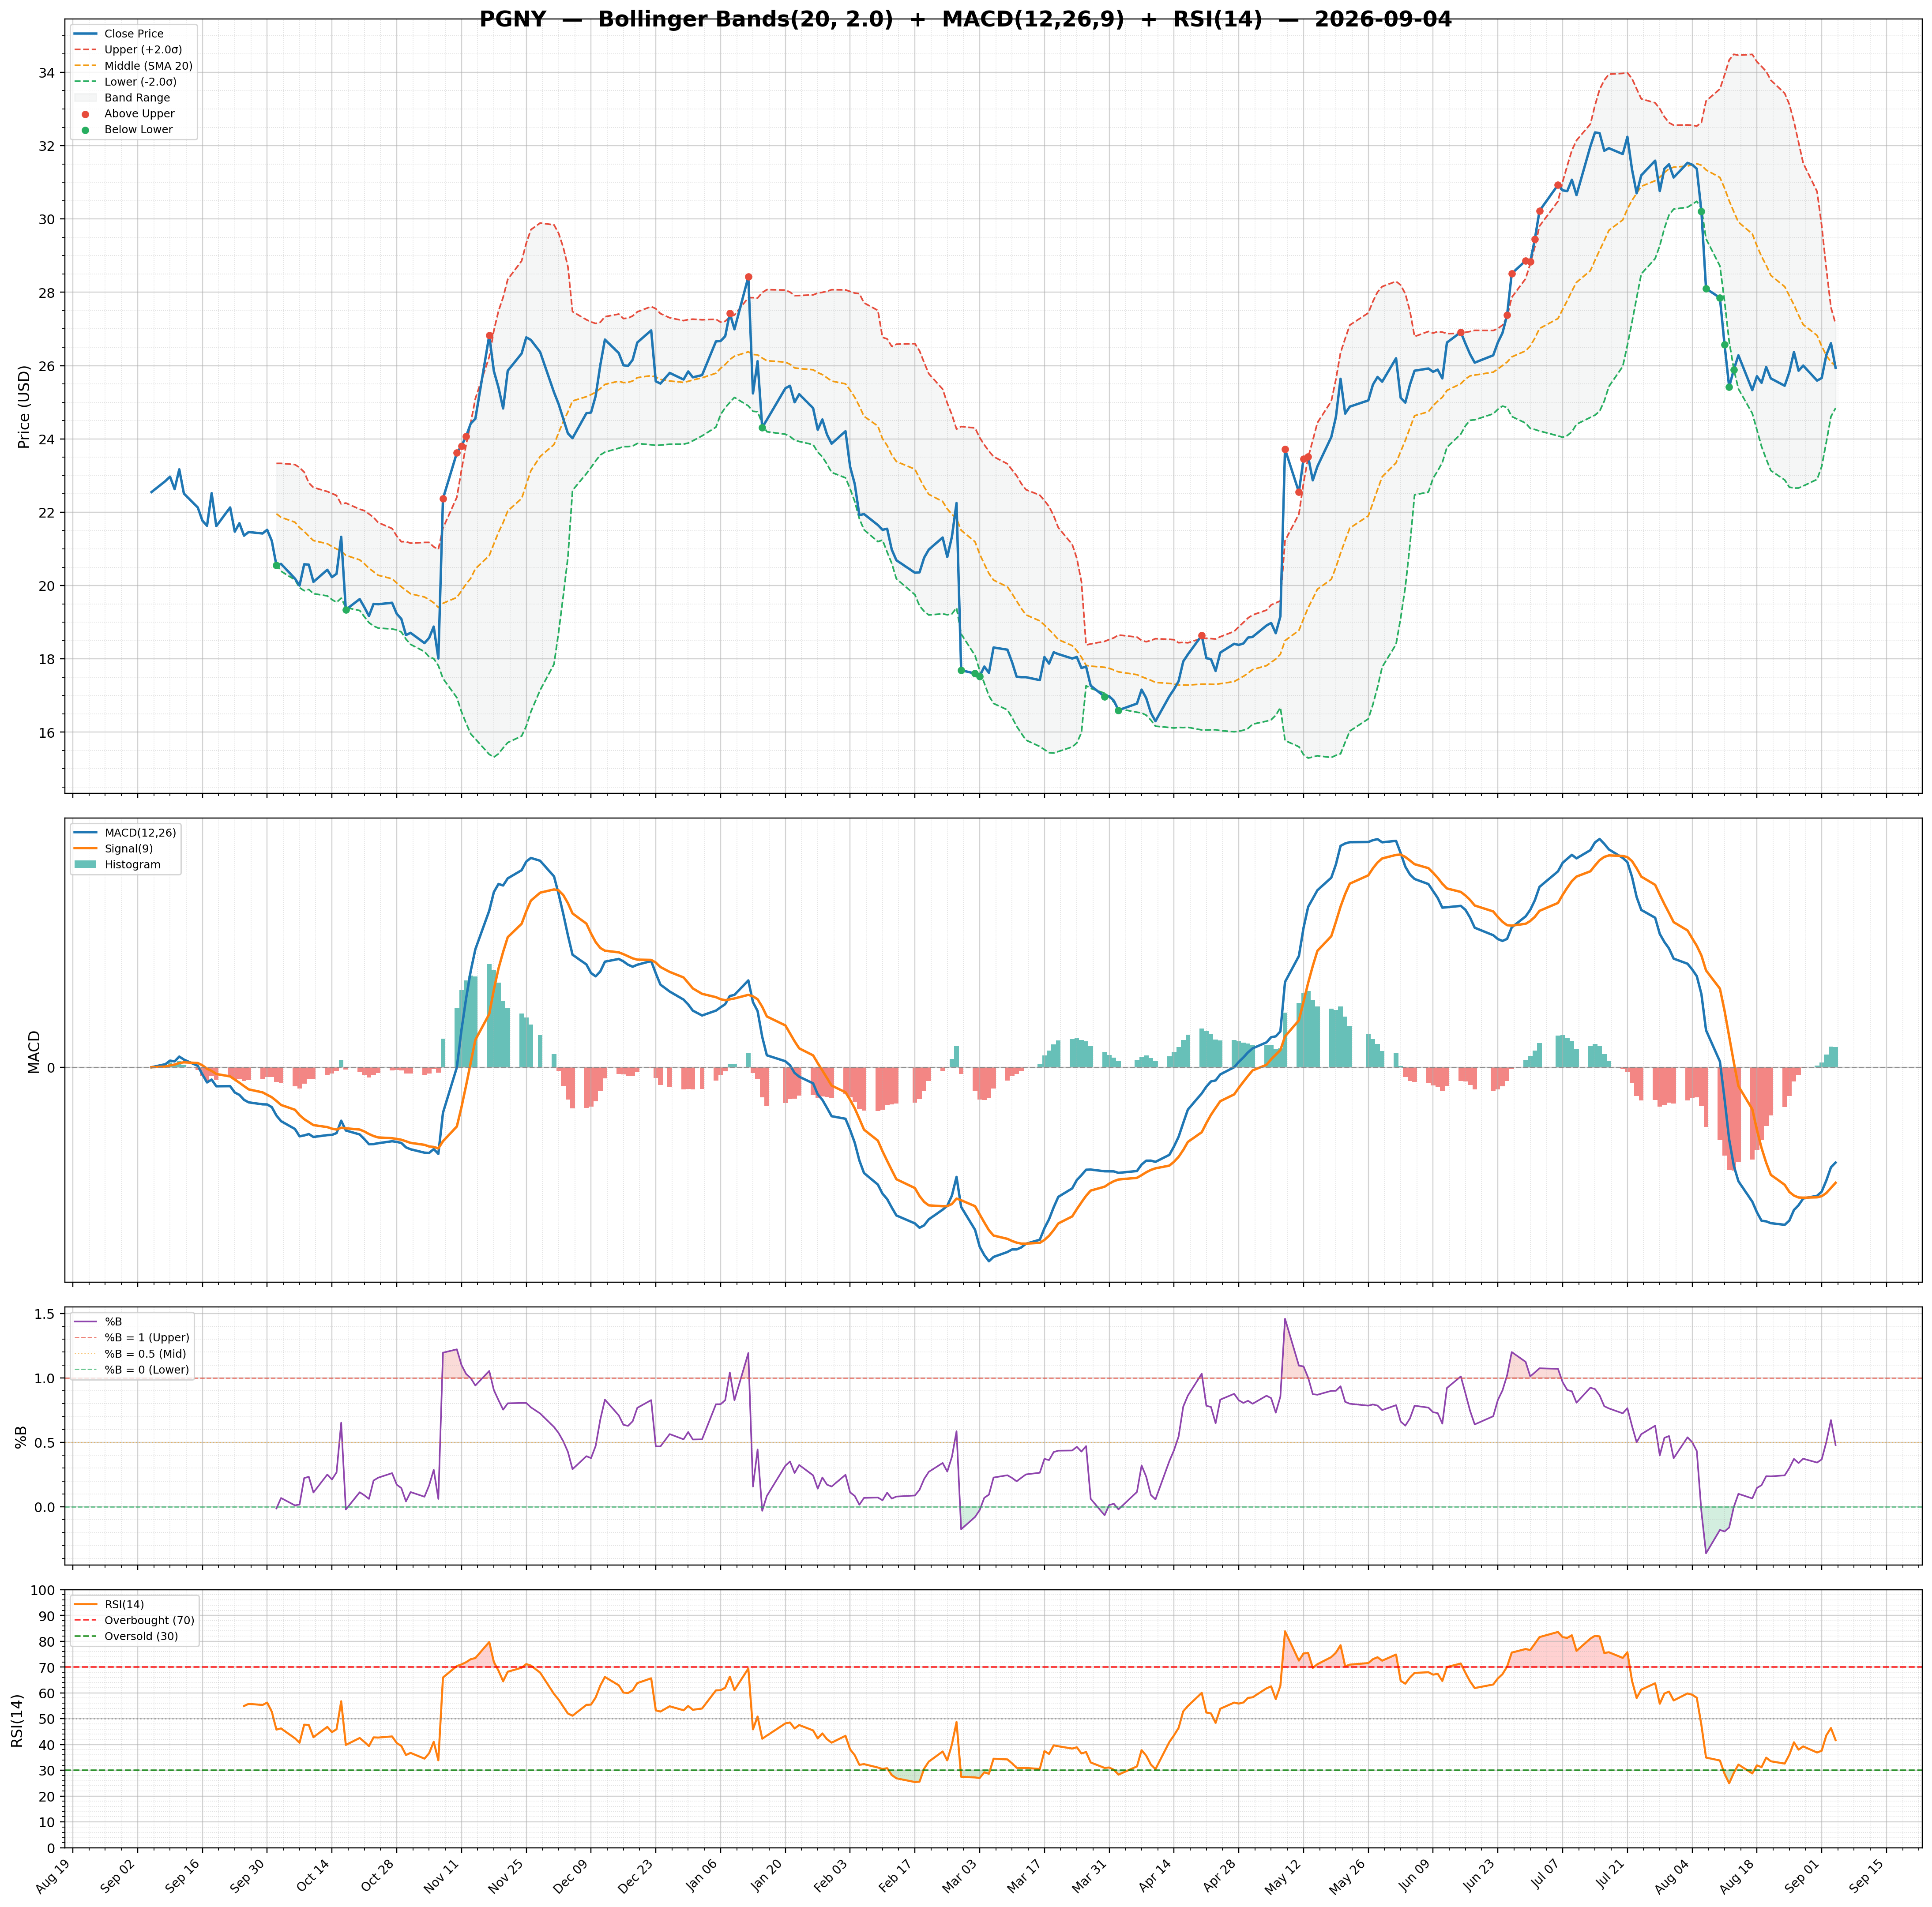
| MACD | 0.52 | Lower Band | 24.11 | Target Low | $30.00 |
| MACD Signal | 0.27 | Middle Band | 26.88 | Target Median | $35.00 |
| Histogram | 0.24 | Upper Band | 29.66 | Analysts | 12 |
| Previous Histogram | 0.21 | Bandwidth | 20.630 | Upside | 28.13% |
| Histogram Trend | Increasing | %B | 0.90 | ||