Piper Sandler Companies (PIPR)
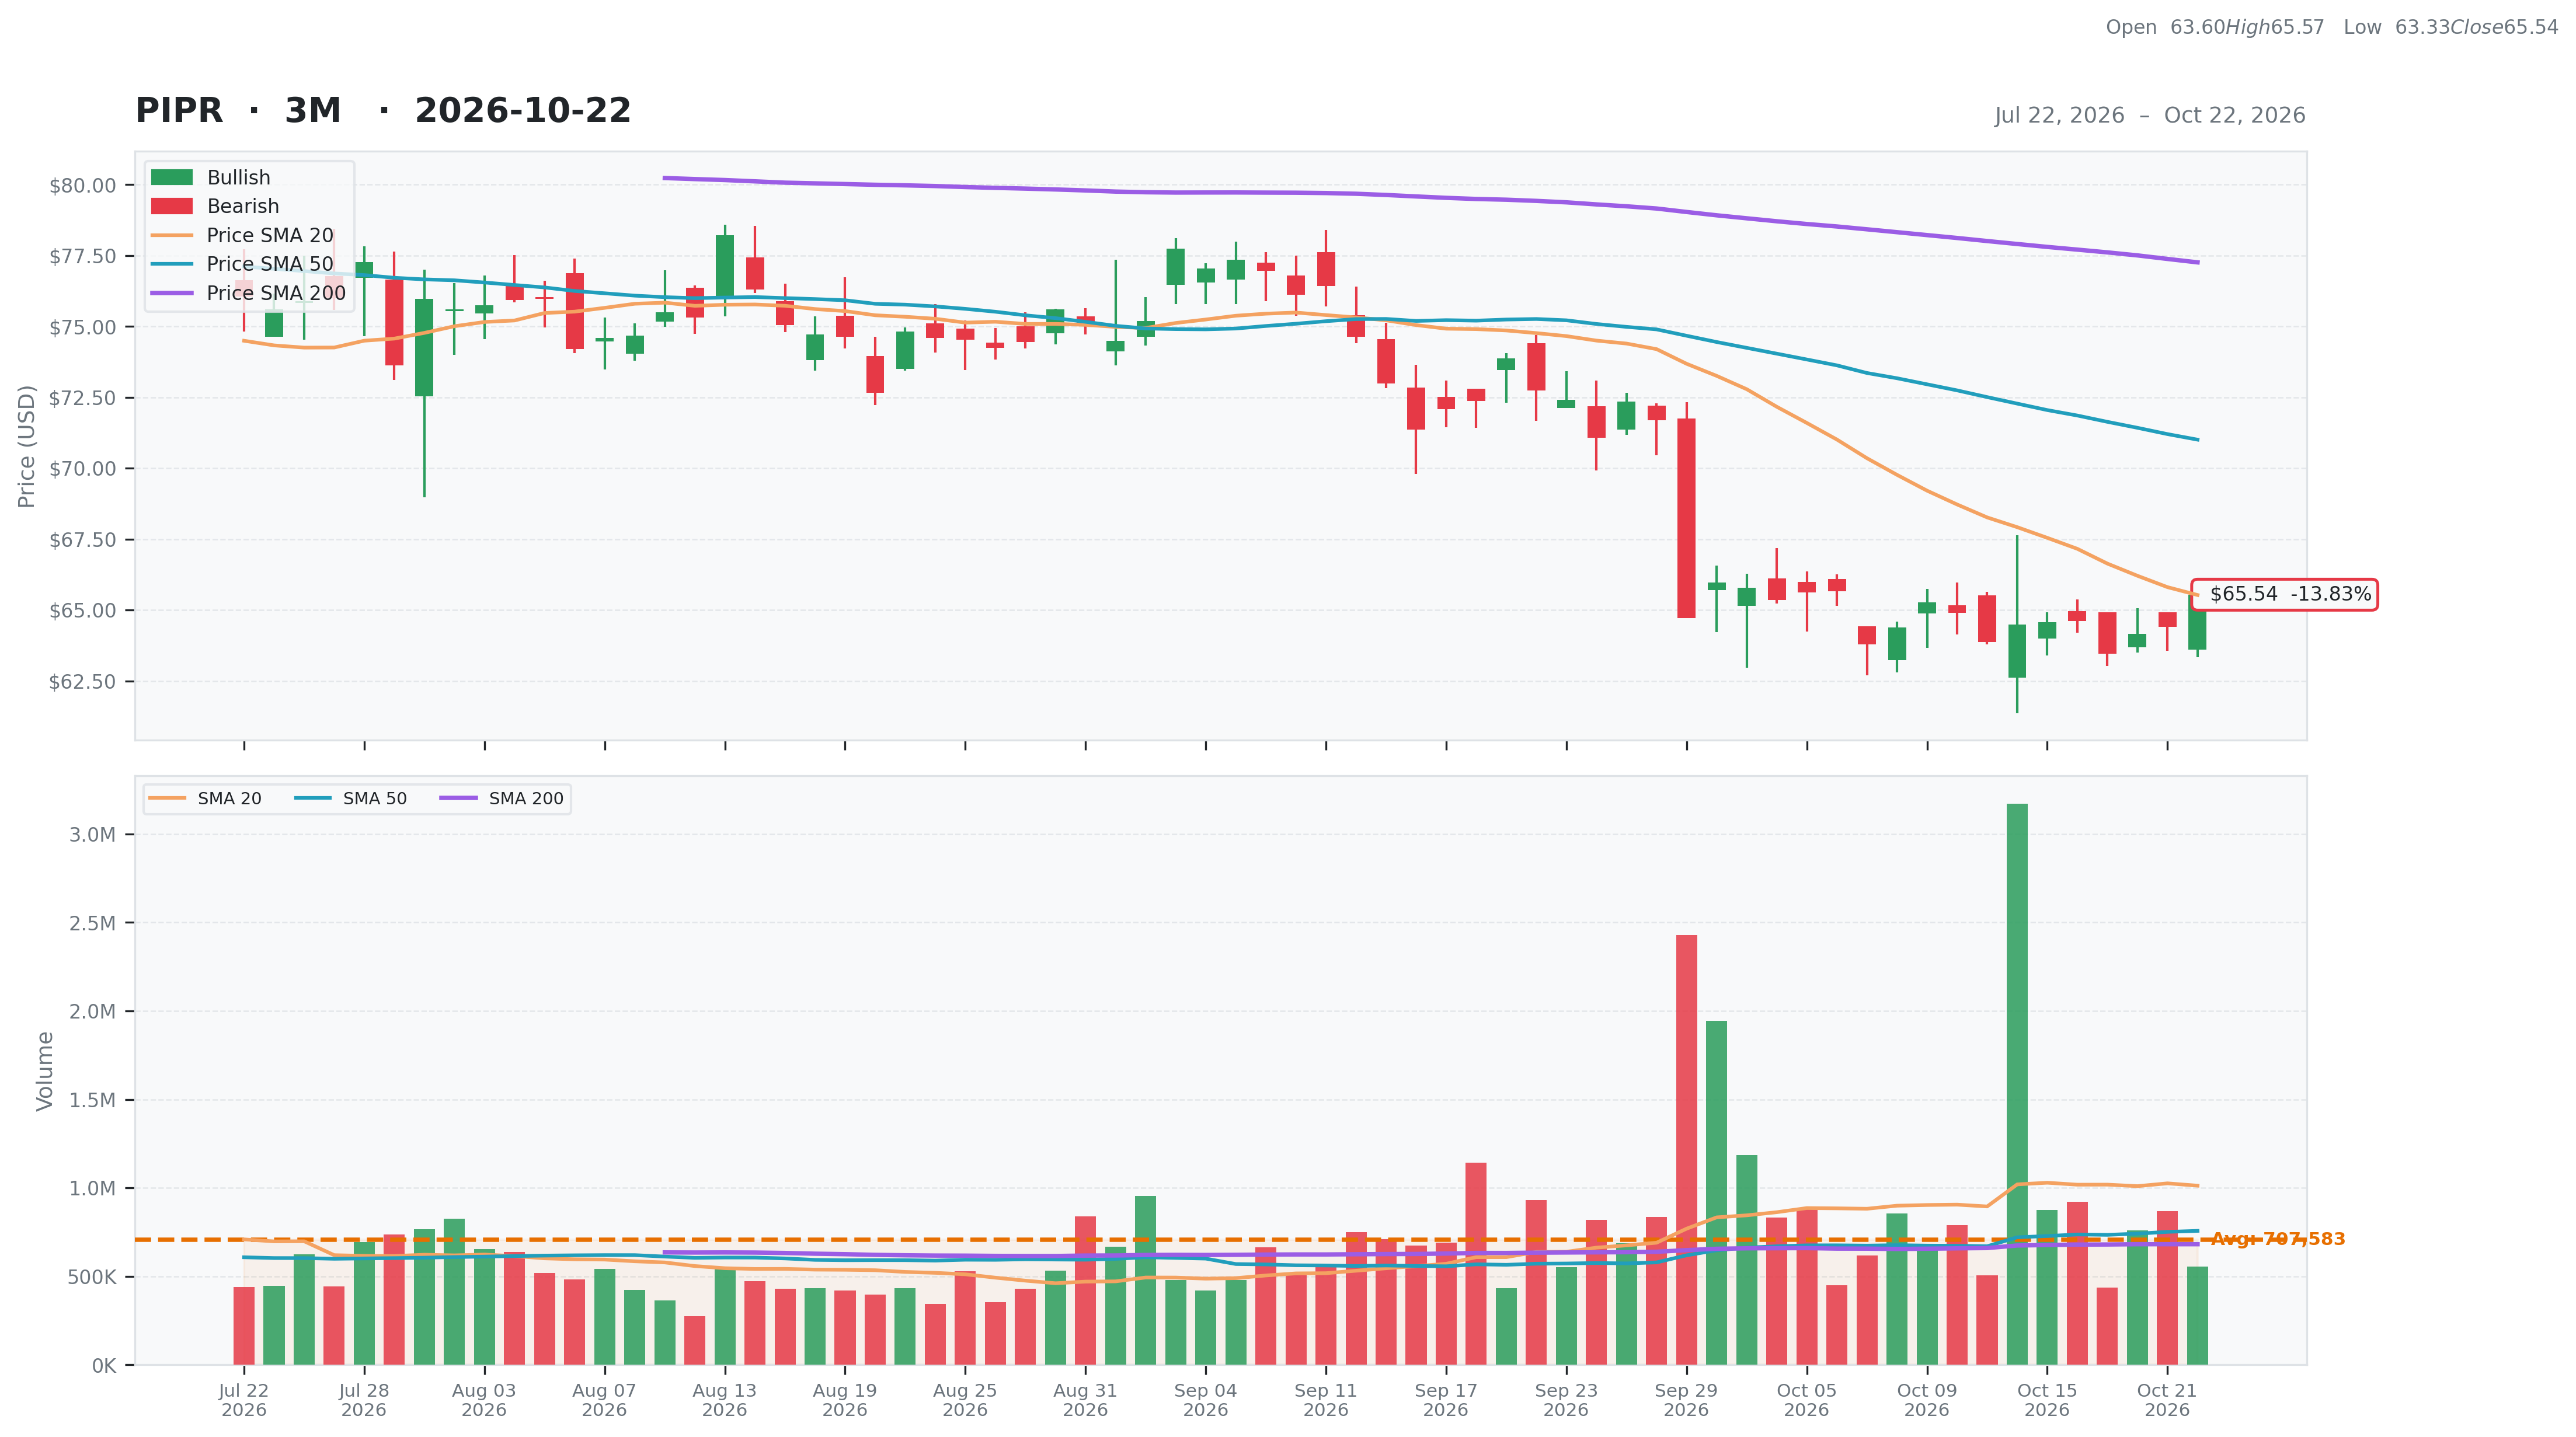
Financial Services • Capital Markets • $65.54 • MCap: 4,566,714,368
https://www.pipersandler.com • Piper Sandler Companies operates as an investment bank and institutional securities firm that serves corporations, private equity groups, public entities, non-profit entities, and institutional investors in the United States and internationally. It offers investment banking services, institutional sales, and trading services for various equity and fixed income products; research services; advisory services, such as mergers and acquisitions, equity and debt financings, equity and debt private placements, debt capital markets advisory, restructuring and private capital advisory; municipal financial advisory and loan placement services; and various over-the-counter derivative products, as well as underwrites municipal issuances. The company also provides public finance investment banking services that focus on state and local governments, special districts and development infrastructure, project finance, and cultural and social service non-profit entities, as well as the education, healthcare, hospitality, senior living, housing, and transportation sectors. In addition, it offers equity and fixed income advisory and trade execution services for institutional investors, corporations, and government and non-profit entities. Further, the company has alternative asset management funds in merchant banking and healthcare to invest firm capital and to manage capital from outside investors; equity and debt capital markets products; public finance services; institutional brokerage services; fundamental equity and macro research services; alternative asset management strategies; and fixed income sales and trading solutions to banks, registered investment advisors, public entities, credit unions, asset managers, and insurance companies. The company was formerly known as Piper Jaffray Companies and changed its name to Piper Sandler Companies in January 2020. Piper Sandler Companies was founded in 1895 and is headquartered in Minneapolis, Minnesota.
ET
| Score | Price | 52 Week & Averages | Relative Strength | Risk | |||||
|---|---|---|---|---|---|---|---|---|---|
| Total | 82 | Current | $65.54 | 52W High | $92.26 -28.96% | Relative Strength | -0.21 | Beta | 1.44 |
| Business Quality | 23 | Weekly | $64.57 1.50% | 52W Low | $63.45 3.29% | 3M | -0.14 | Short % | 0.05 |
| Financial Strength | 19 | Monthly | $72.74 -9.90% | Above 50DMA | $71.01 -7.70% | 6M | -0.25 | Risk Score | 3 |
| Growth Outlook | 15 | Quarterly | $75.89 -13.63% | Above 200DMA | $77.26 -15.17% | 9M | -0.29 | ||
| Momentum | 2 | Yearly | $85.52 -23.36% | 12M | -0.23 | ||||
| Valuation | Financial Strength | Growth/Profitability | |||
|---|---|---|---|---|---|
| Trailing P/E | 14.96 | Cash | 862M | Revenue Growth | 0.25% |
| Forward P/E | 11.95 | Debt | 177M | Earnings Growth | 0.61% |
| PEG Ratio | 1.26 | Debt/Equity | 11.27 | Qtr Earnings Growth | 0.61% |
| Price/Sales | 2.16 | Current Ratio | 2.43 | Gross Margin | 0.92% |
| Price/Book | 3.18 | Quick Ratio | 2.39 | Operating Margin | 0.22% |
| EV/Revenue | 1.82 | Operating CF | 506M | Profit Margin | 0.15% |
| EV/EBITDA | N/A | Free CF | N/A | EBITDA Margin | 0.00% |
| Ent Value | 3,851M | Return on Assets | 0.17% | ||
| Return on Equity | 0.25% | ||||
| Technical | Volume & Bollinger Bands | Analyst | |||
|---|---|---|---|---|---|
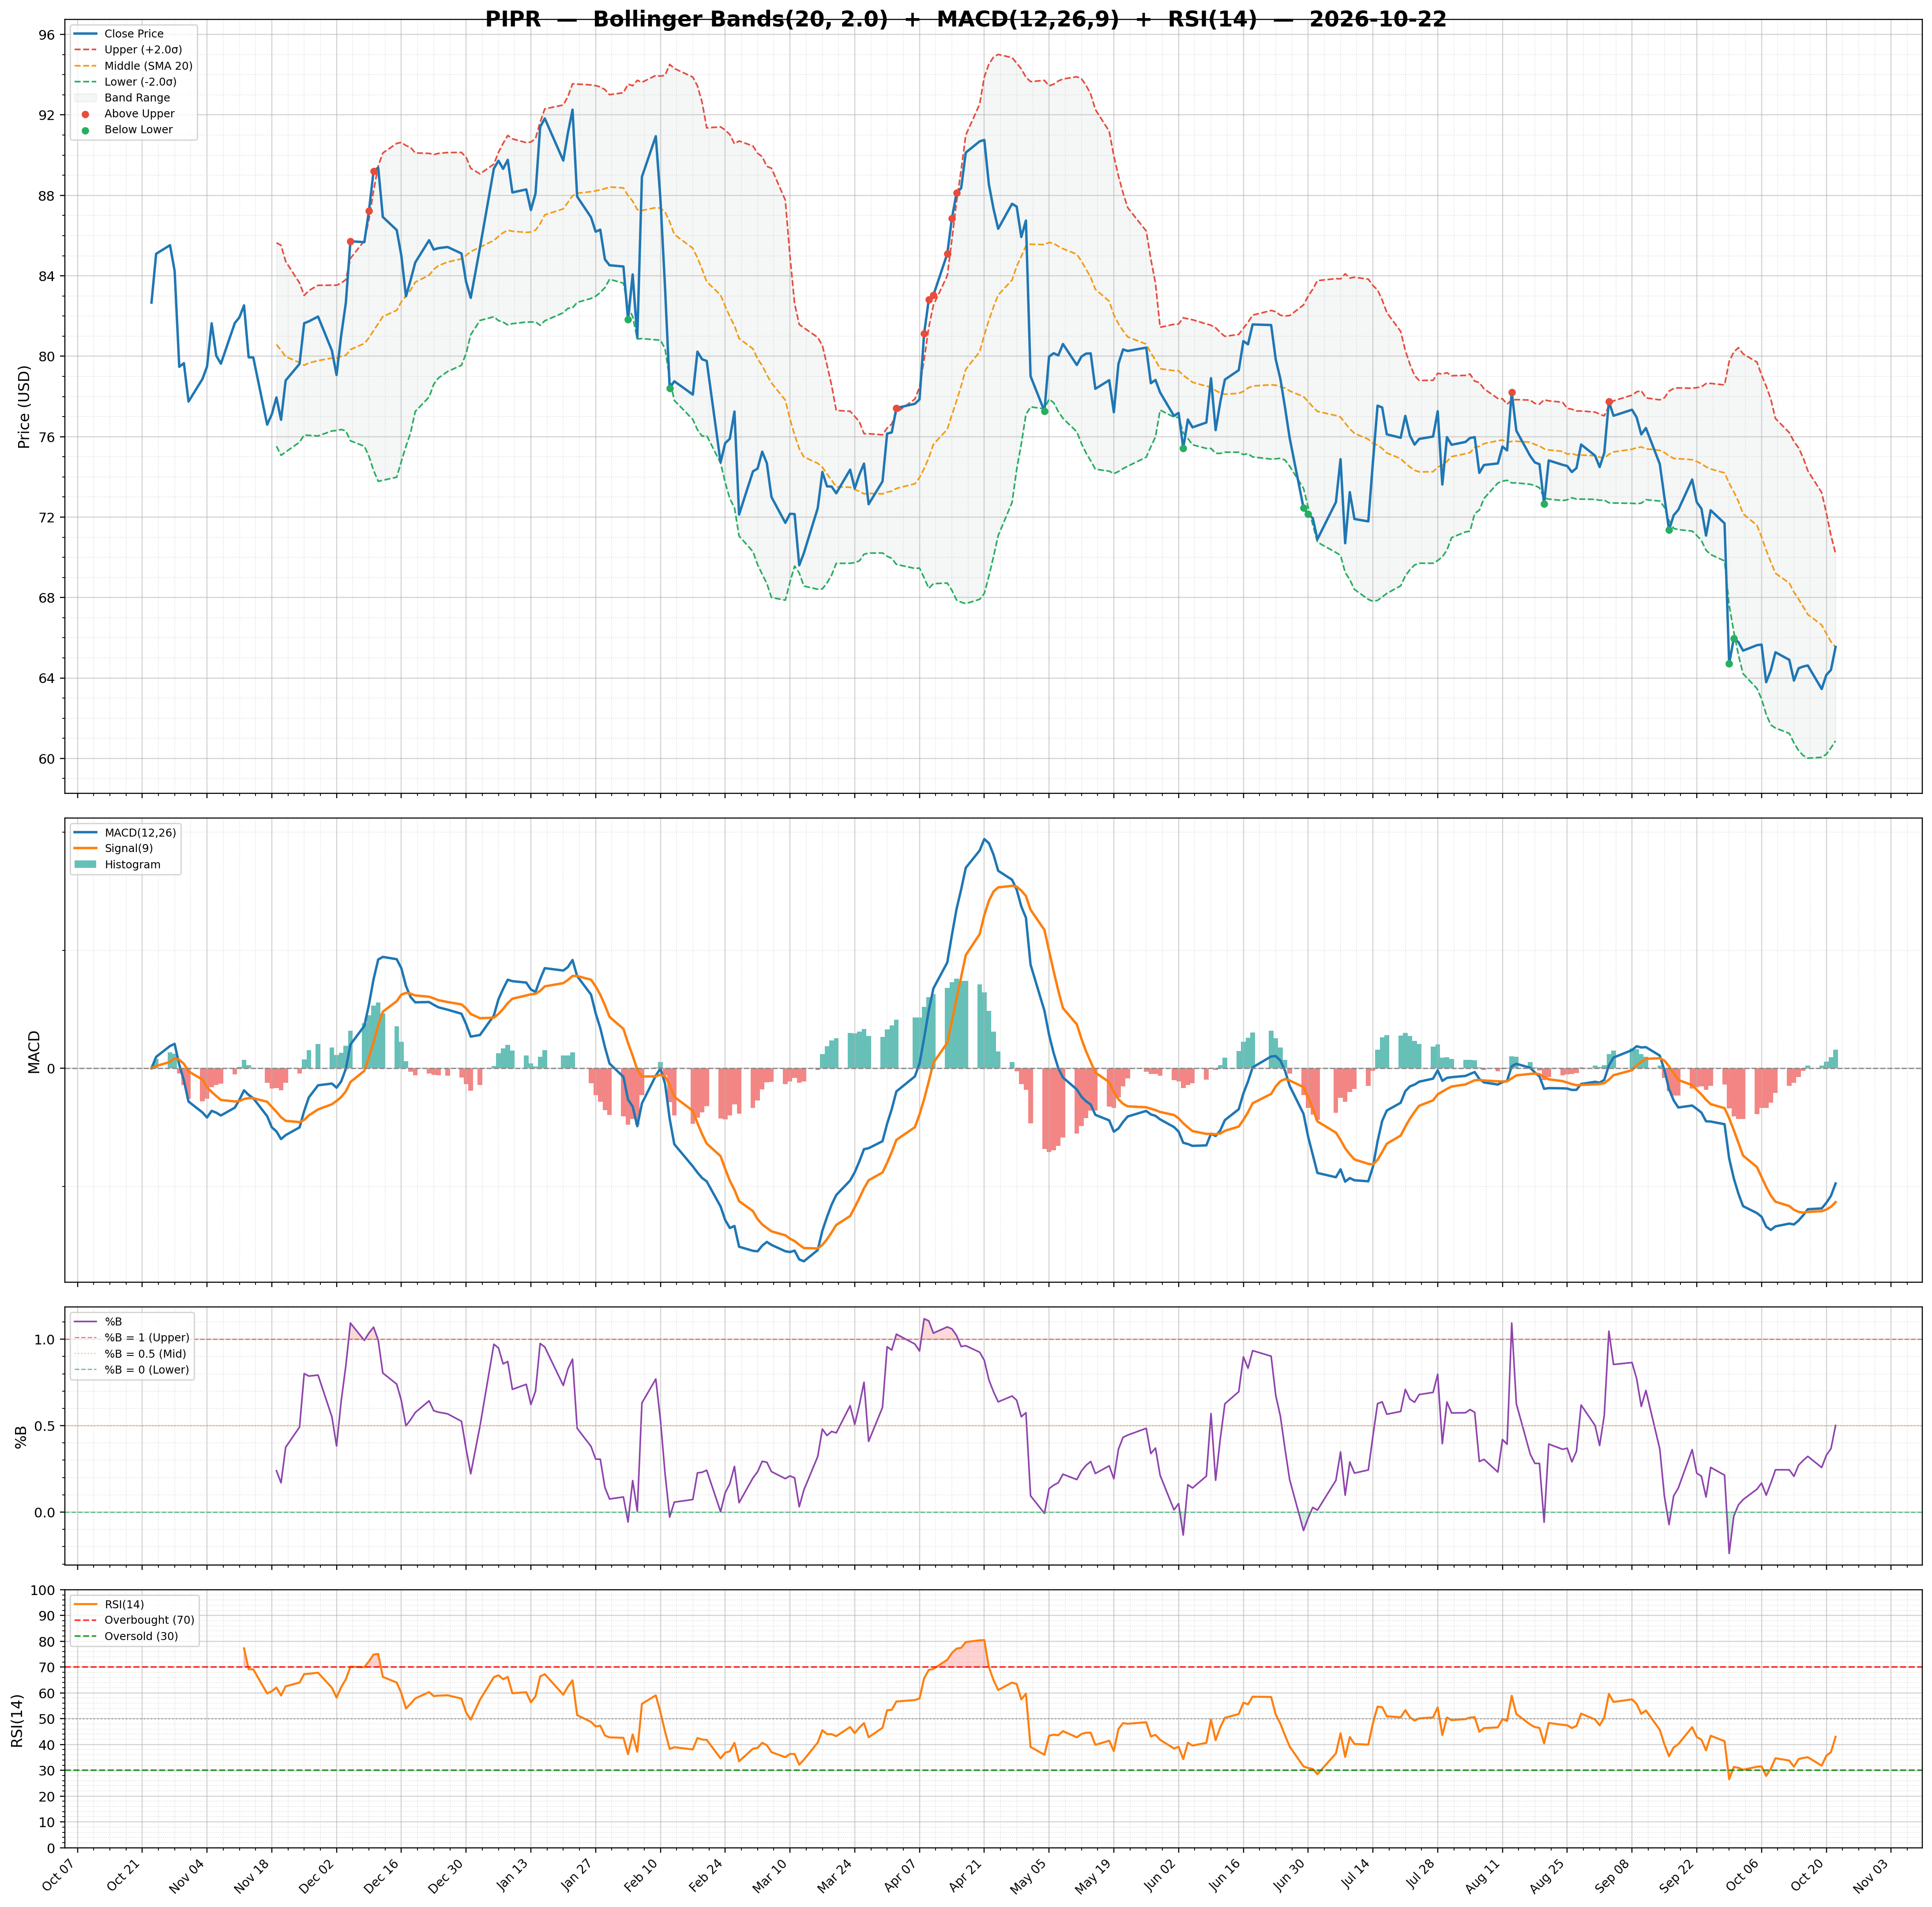
| RSI | 42.99 | Volume | 0.86M | Rating | buy |
| Previous RSI | 37.03 | Avg Volume 20D | 1.01M | Target Mean | $79.38 |
| RSI Trend | Up | Relative Volume | 0.61 | Target High | $87.50 |
| MACD | -1.95 | Lower Band | 60.87 | Target Low | $75.00 |
| MACD Signal | -2.27 | Middle Band | 65.53 | Target Median | $77.50 |
| Histogram | 0.32 | Upper Band | 70.19 | Analysts | 4 |
| Previous Histogram | 0.19 | Bandwidth | 14.230 | Upside | 22.83% |
| Histogram Trend | Increasing | %B | 0.50 | ||