Invesco QQQ Trust, Series 1 (QQQ)
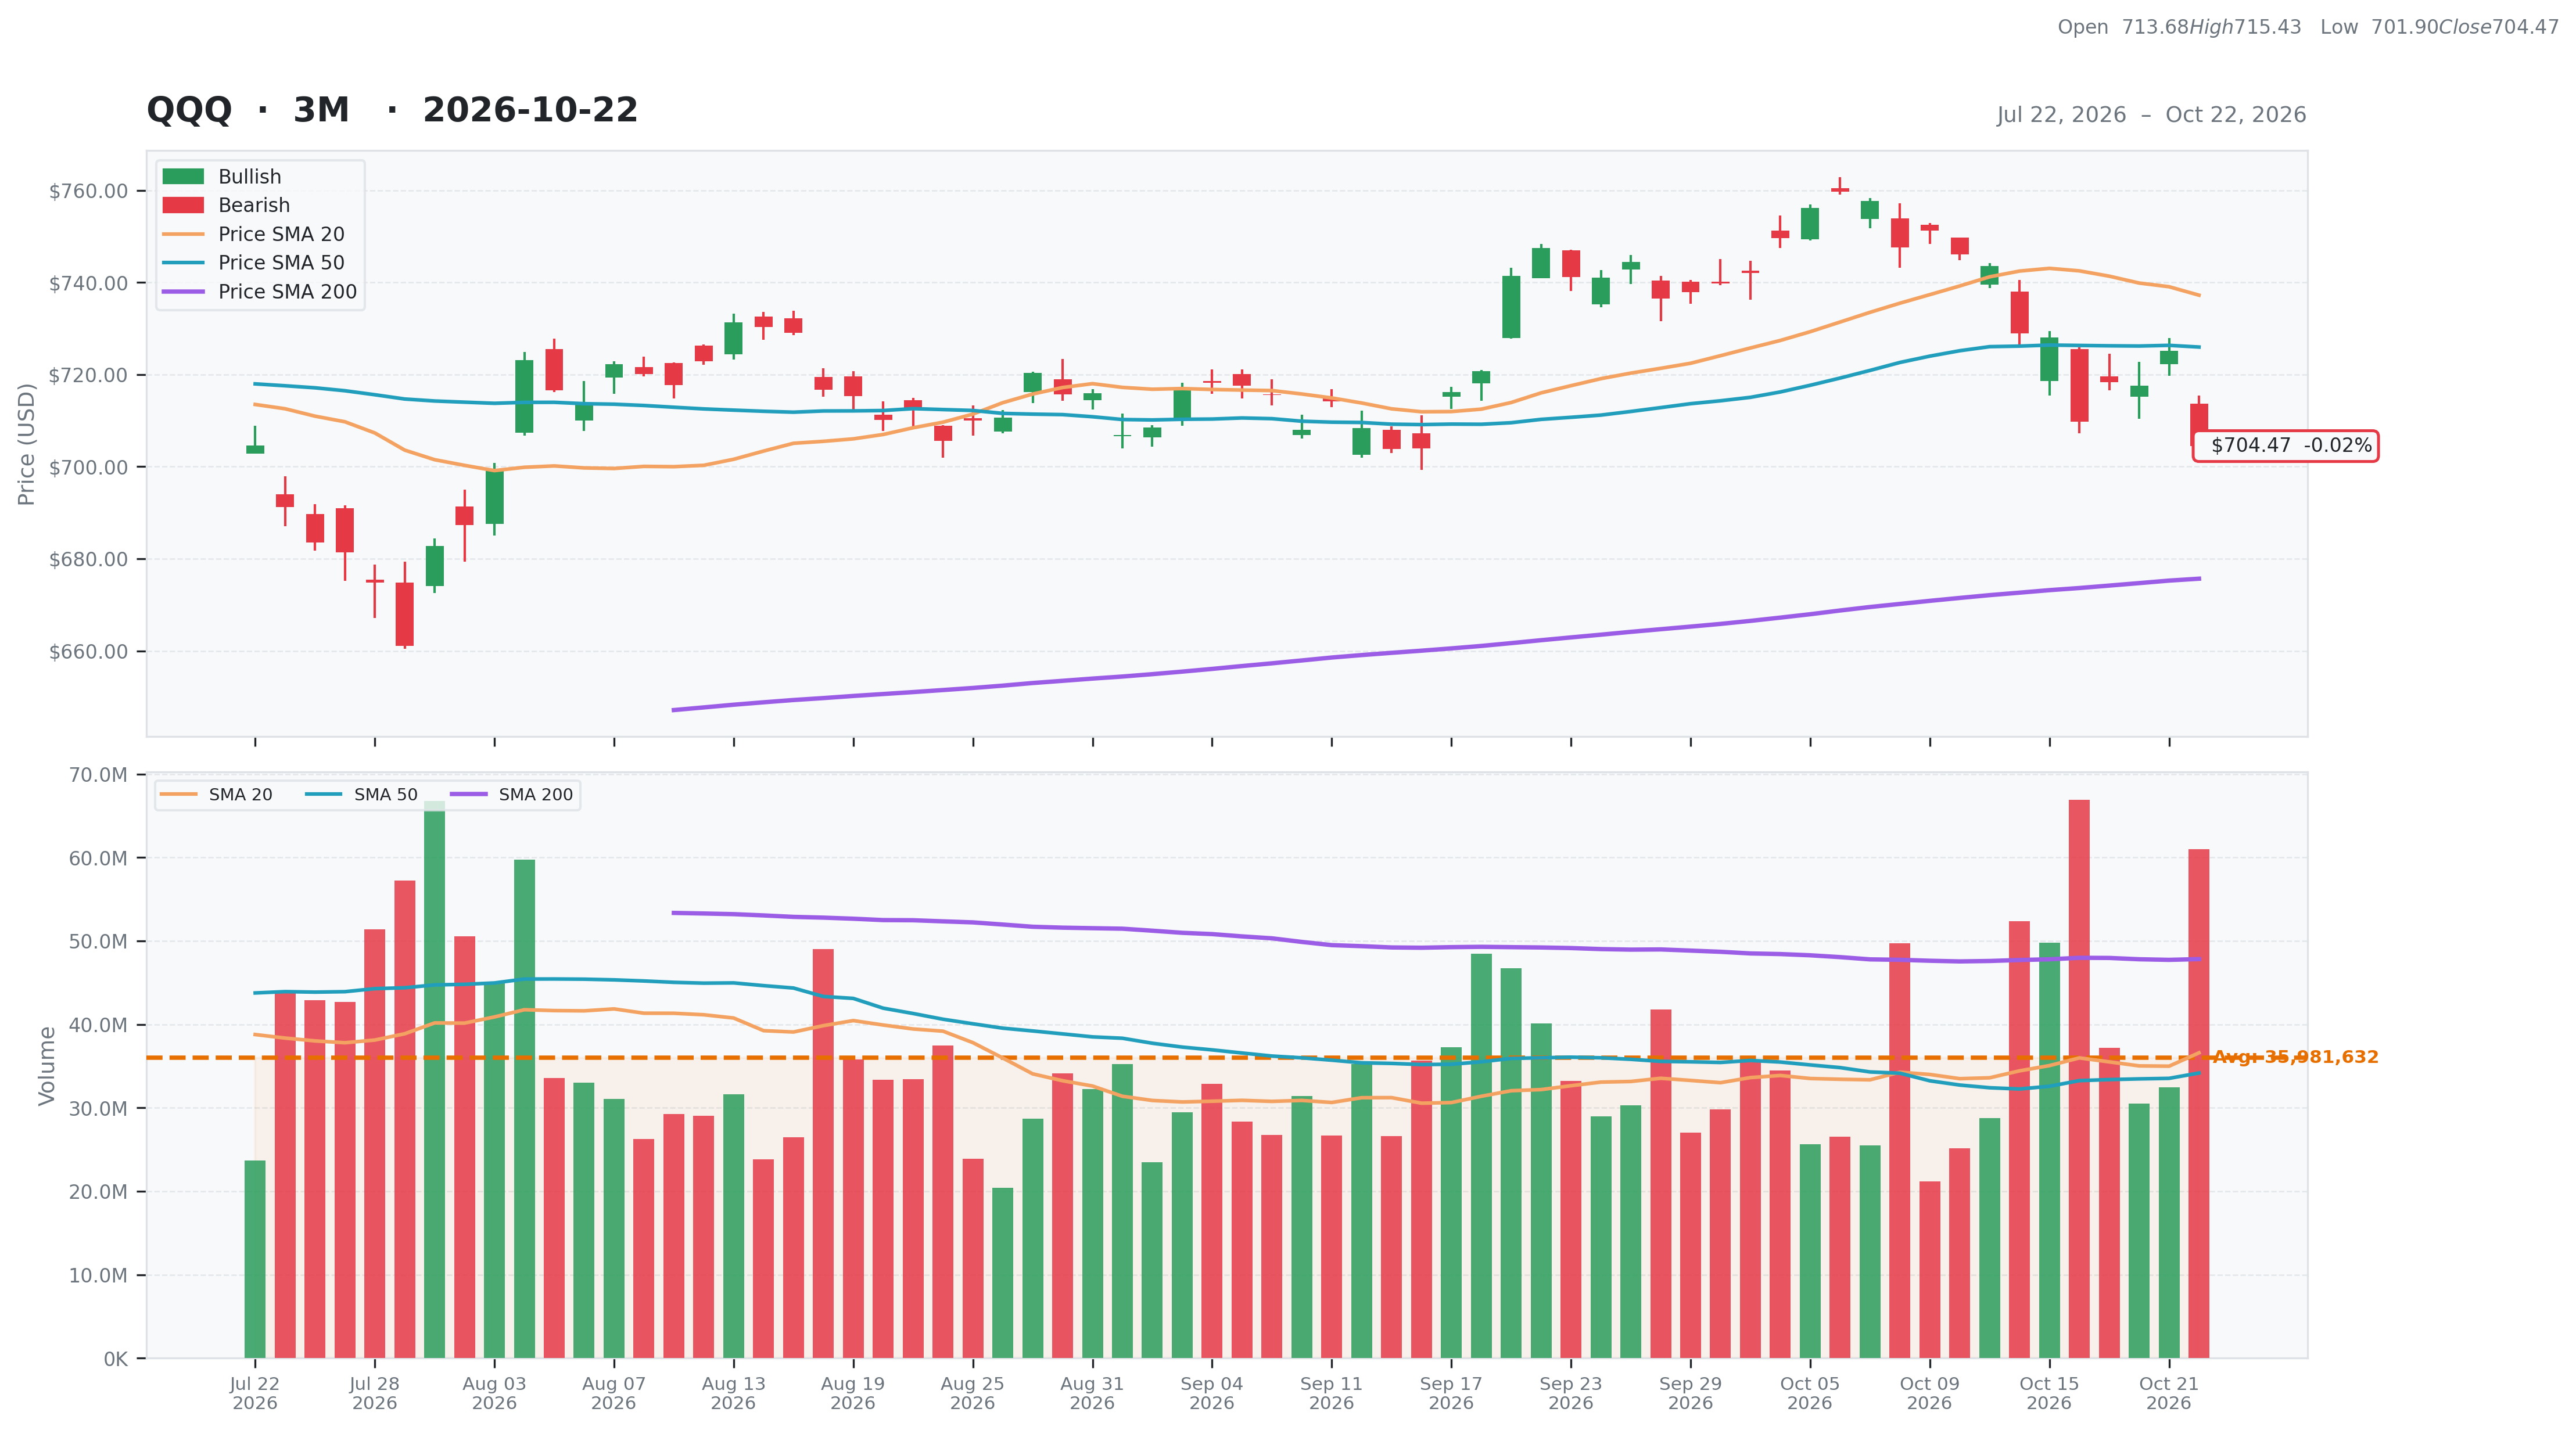
• • $704.47 • MCap:
• To maintain the correspondence between the composition and weights of the securities in the trust (the "securities") and the stocks in the NASDAQ-100 Index®, the adviser adjusts the securities from time to time to conform to periodic changes in the identity and/or relative weights of index securities. The composition and weighting of the securities portion of a portfolio deposit are also adjusted to conform to changes in the index.
Joie
| Score | Price | 52 Week & Averages | Relative Strength | Risk | |||||
|---|---|---|---|---|---|---|---|---|---|
| Total | 28 | Current | $704.47 | 52W High | $759.66 -7.27% | Relative Strength | 0.09 | Beta | N/A |
| Business Quality | 1 | Weekly | $728.00 -3.23% | 52W Low | $557.09 26.46% | 3M | 0.03 | Short % | |
| Financial Strength | 6 | Monthly | $747.46 -5.75% | Above 50DMA | $725.98 -2.96% | 6M | 0.08 | Risk Score | |
| Growth Outlook | 1 | Quarterly | $683.52 3.07% | Above 200DMA | $675.69 4.26% | 9M | 0.14 | ||
| Momentum | 2 | Yearly | $625.15 12.69% | 12M | 0.15 | ||||
| Valuation | Financial Strength | Growth/Profitability | |||
|---|---|---|---|---|---|
| Trailing P/E | 27.18 | Cash | N/A | Revenue Growth | N/A |
| Forward P/E | N/A | Debt | N/A | Earnings Growth | N/A |
| PEG Ratio | N/A | Debt/Equity | N/A | Qtr Earnings Growth | N/A |
| Price/Sales | N/A | Current Ratio | N/A | Gross Margin | N/A |
| Price/Book | 1.98 | Quick Ratio | N/A | Operating Margin | N/A |
| EV/Revenue | N/A | Operating CF | N/A | Profit Margin | N/A |
| EV/EBITDA | N/A | Free CF | N/A | EBITDA Margin | N/A |
| Ent Value | N/A | Return on Assets | N/A | ||
| Return on Equity | N/A | ||||
| Technical | Volume & Bollinger Bands | Analyst | |||
|---|---|---|---|---|---|
| RSI | 36.62 | Volume | 66.25M | Rating | |
| Previous RSI | 46.08 | Avg Volume 20D | 36.59M | Target Mean | N/A |
| RSI Trend | Down | Relative Volume | 1.68 | Target High | N/A |
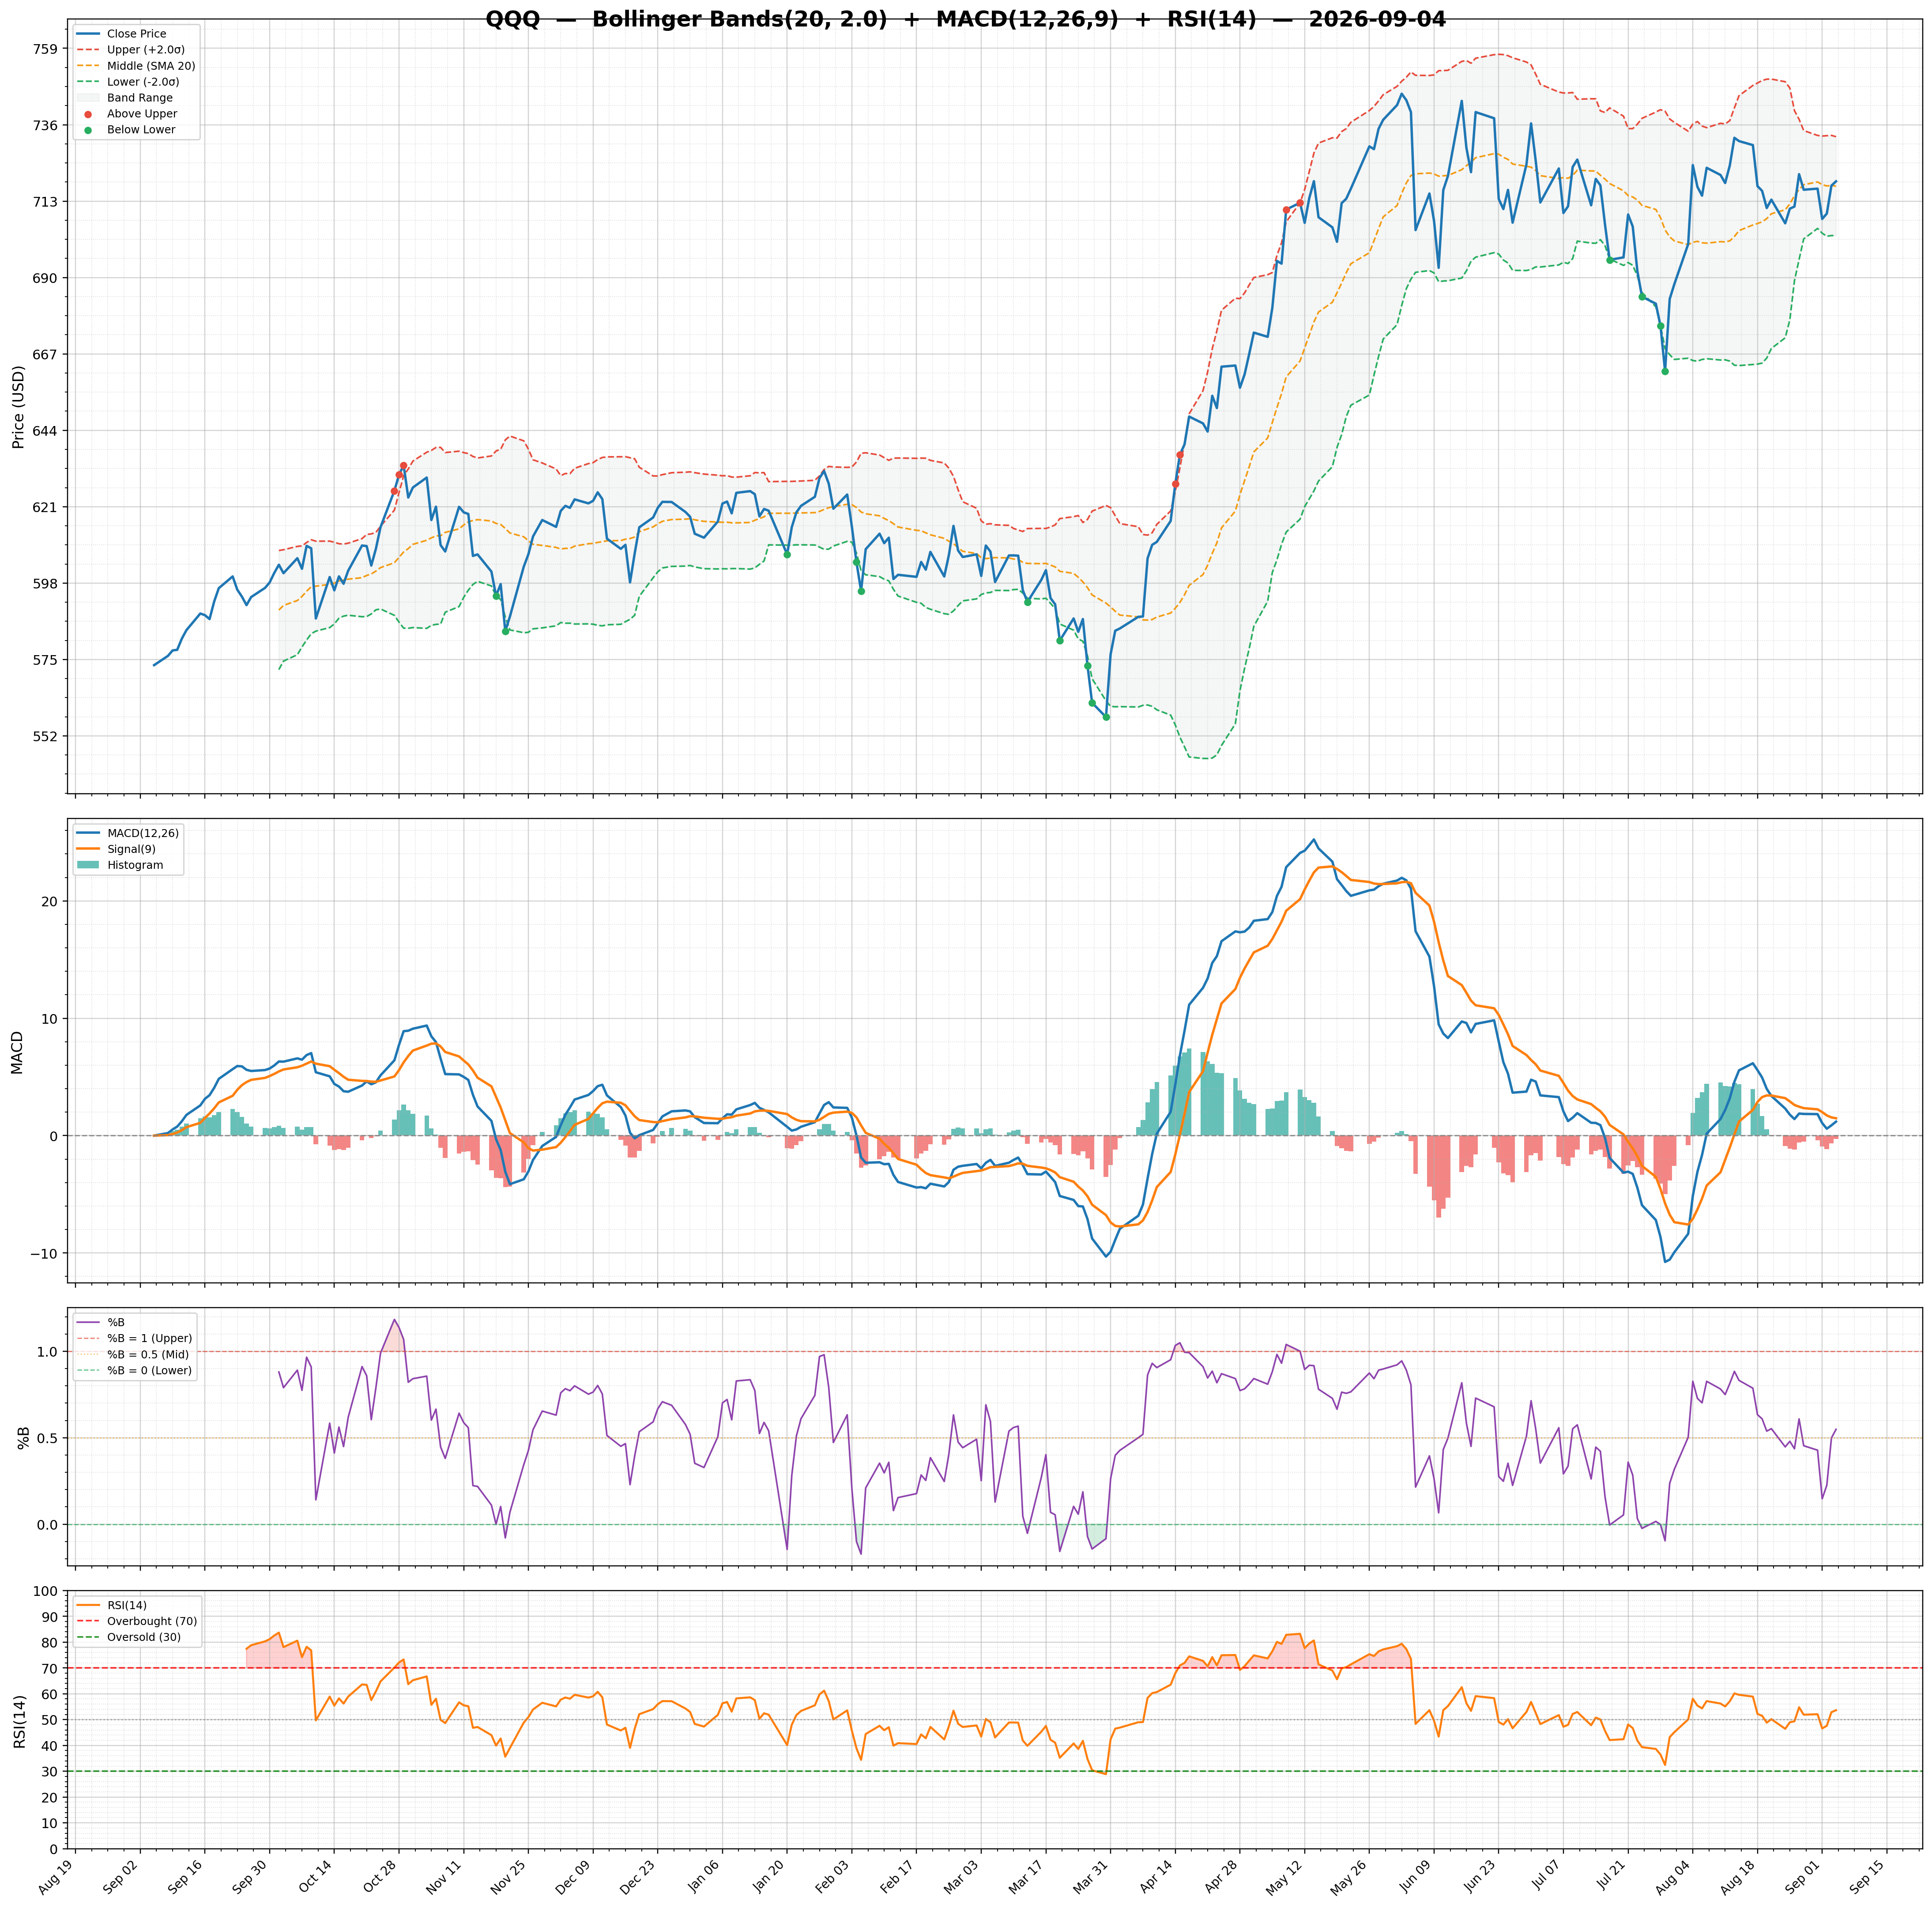
| MACD | -3.46 | Lower Band | 705.43 | Target Low | N/A |
| MACD Signal | 1.52 | Middle Band | 737.24 | Target Median | N/A |
| Histogram | -4.98 | Upper Band | 769.05 | Analysts | N/A |
| Previous Histogram | -4.29 | Bandwidth | 8.630 | Upside | N/A |
| Histogram Trend | Decreasing | %B | -0.02 | ||