QXO, Inc. (QXO)
Industrials • Industrial Distribution • $11.02 • MCap: 11,267,148,800
https://www.qxo.com • QXO, Inc. distributes roofing, waterproofing and complementary building products in the United States and Canada. It offers roofing and siding materials for residential construction, such as asphalt shingles, metal roofing, wood roofing, tile roofing, slate roofing, roofing accessories, and roofing insulation; and siding materials, including vinyl siding aluminum siding, steel siding, fiber cement siding, wood and composite siding, trim and accessories, and gutters and accessories. The company also provides commercial roofing and siding products built-up roofing, modified roofing, EPDM roofing, PVC roofing, low-slope metal roofing TPO roofing, and commercial accessories; commercial waterproofing, concrete restoration and parking, public works, DOT and industrial, fire protection, wall systems, and safety and tools, as well as glass, glazing, and fenestration. In addition, it offers building materials; exterior and interior materials; and tools and equipment. The company provides its products under Atlas, Carlisle, CertainTeed, Elevate, Exterior Portfolio, GAF, IKO, James Hardie, LP SmartSide, Owens Corning, Royal, Tamko, TRI-BUILT, and Velux brands. It serves professional contractors, home builders, building owners, lumberyards, and retailers. The company was formerly known as SilverSun Technologies, Inc. and changed its name to QXO, Inc. in June 2024. QXO, Inc. is headquartered in Greenwich, Connecticut.
ET
| Score | Price | 52 Week & Averages | Relative Strength | Risk | |||||
|---|---|---|---|---|---|---|---|---|---|
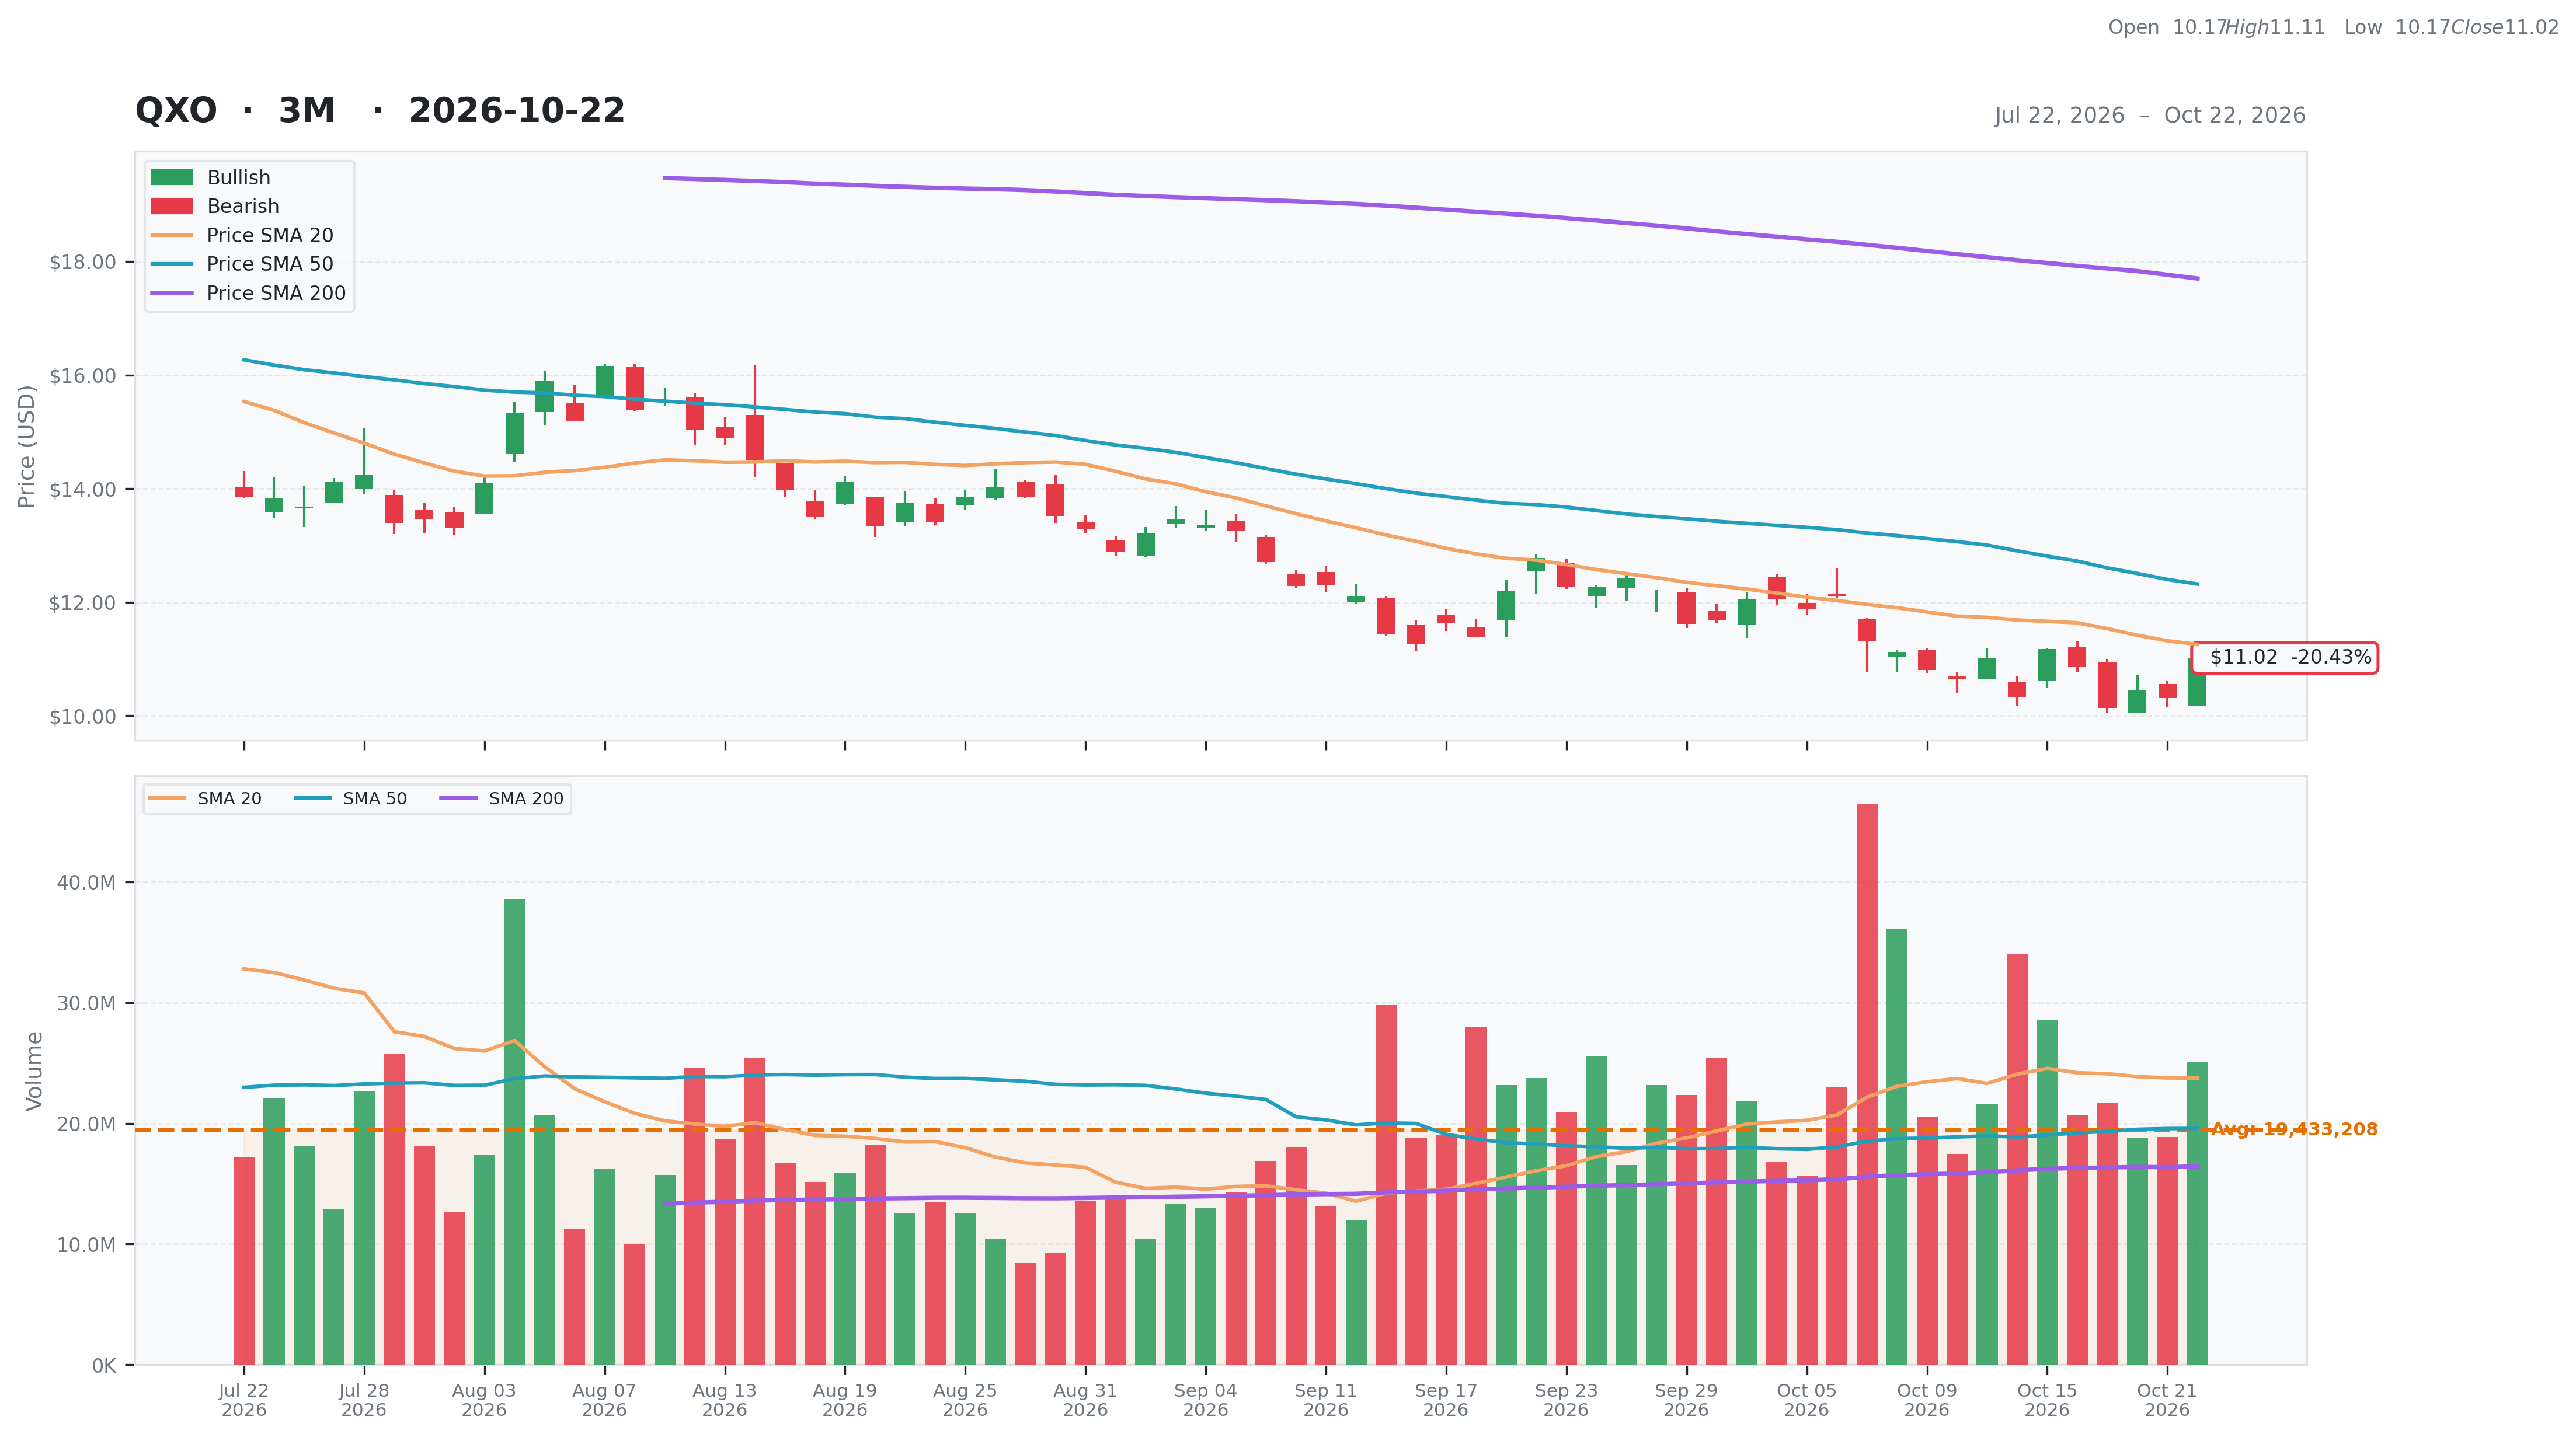
| Total | 38 | Current | $11.02 | 52W High | $27.07 -59.29% | Relative Strength | -0.37 | Beta | 2.28 |
| Business Quality | 4 | Weekly | $11.18 -1.43% | 52W Low | $10.14 8.68% | 3M | -0.19 | Short % | 0.13 |
| Financial Strength | 13 | Monthly | $12.78 -13.77% | Above 50DMA | $12.32 -10.55% | 6M | -0.50 | Risk Score | 6 |
| Growth Outlook | 1 | Quarterly | $13.67 -19.39% | Above 200DMA | $17.70 -37.74% | 9M | -0.54 | ||
| Momentum | 3 | Yearly | $18.08 -39.05% | 12M | -0.40 | ||||
| Valuation | Financial Strength | Growth/Profitability | |||
|---|---|---|---|---|---|
| Trailing P/E | N/A | Cash | 2,774M | Revenue Growth | 0.70% |
| Forward P/E | 19.70 | Debt | 7,037M | Earnings Growth | N/A |
| PEG Ratio | 0.87 | Debt/Equity | 57.03 | Qtr Earnings Growth | N/A |
| Price/Sales | 1.14 | Current Ratio | 4.12 | Gross Margin | 0.25% |
| Price/Book | 0.85 | Quick Ratio | 2.04 | Operating Margin | 0.01% |
| EV/Revenue | 1.87 | Operating CF | 253M | Profit Margin | -0.05% |
| EV/EBITDA | 31.34 | Free CF | -2,546M | EBITDA Margin | 0.06% |
| Ent Value | 18,548M | Return on Assets | 0.00% | ||
| Return on Equity | -0.05% | ||||
| Technical | Volume & Bollinger Bands | Analyst | |||
|---|---|---|---|---|---|
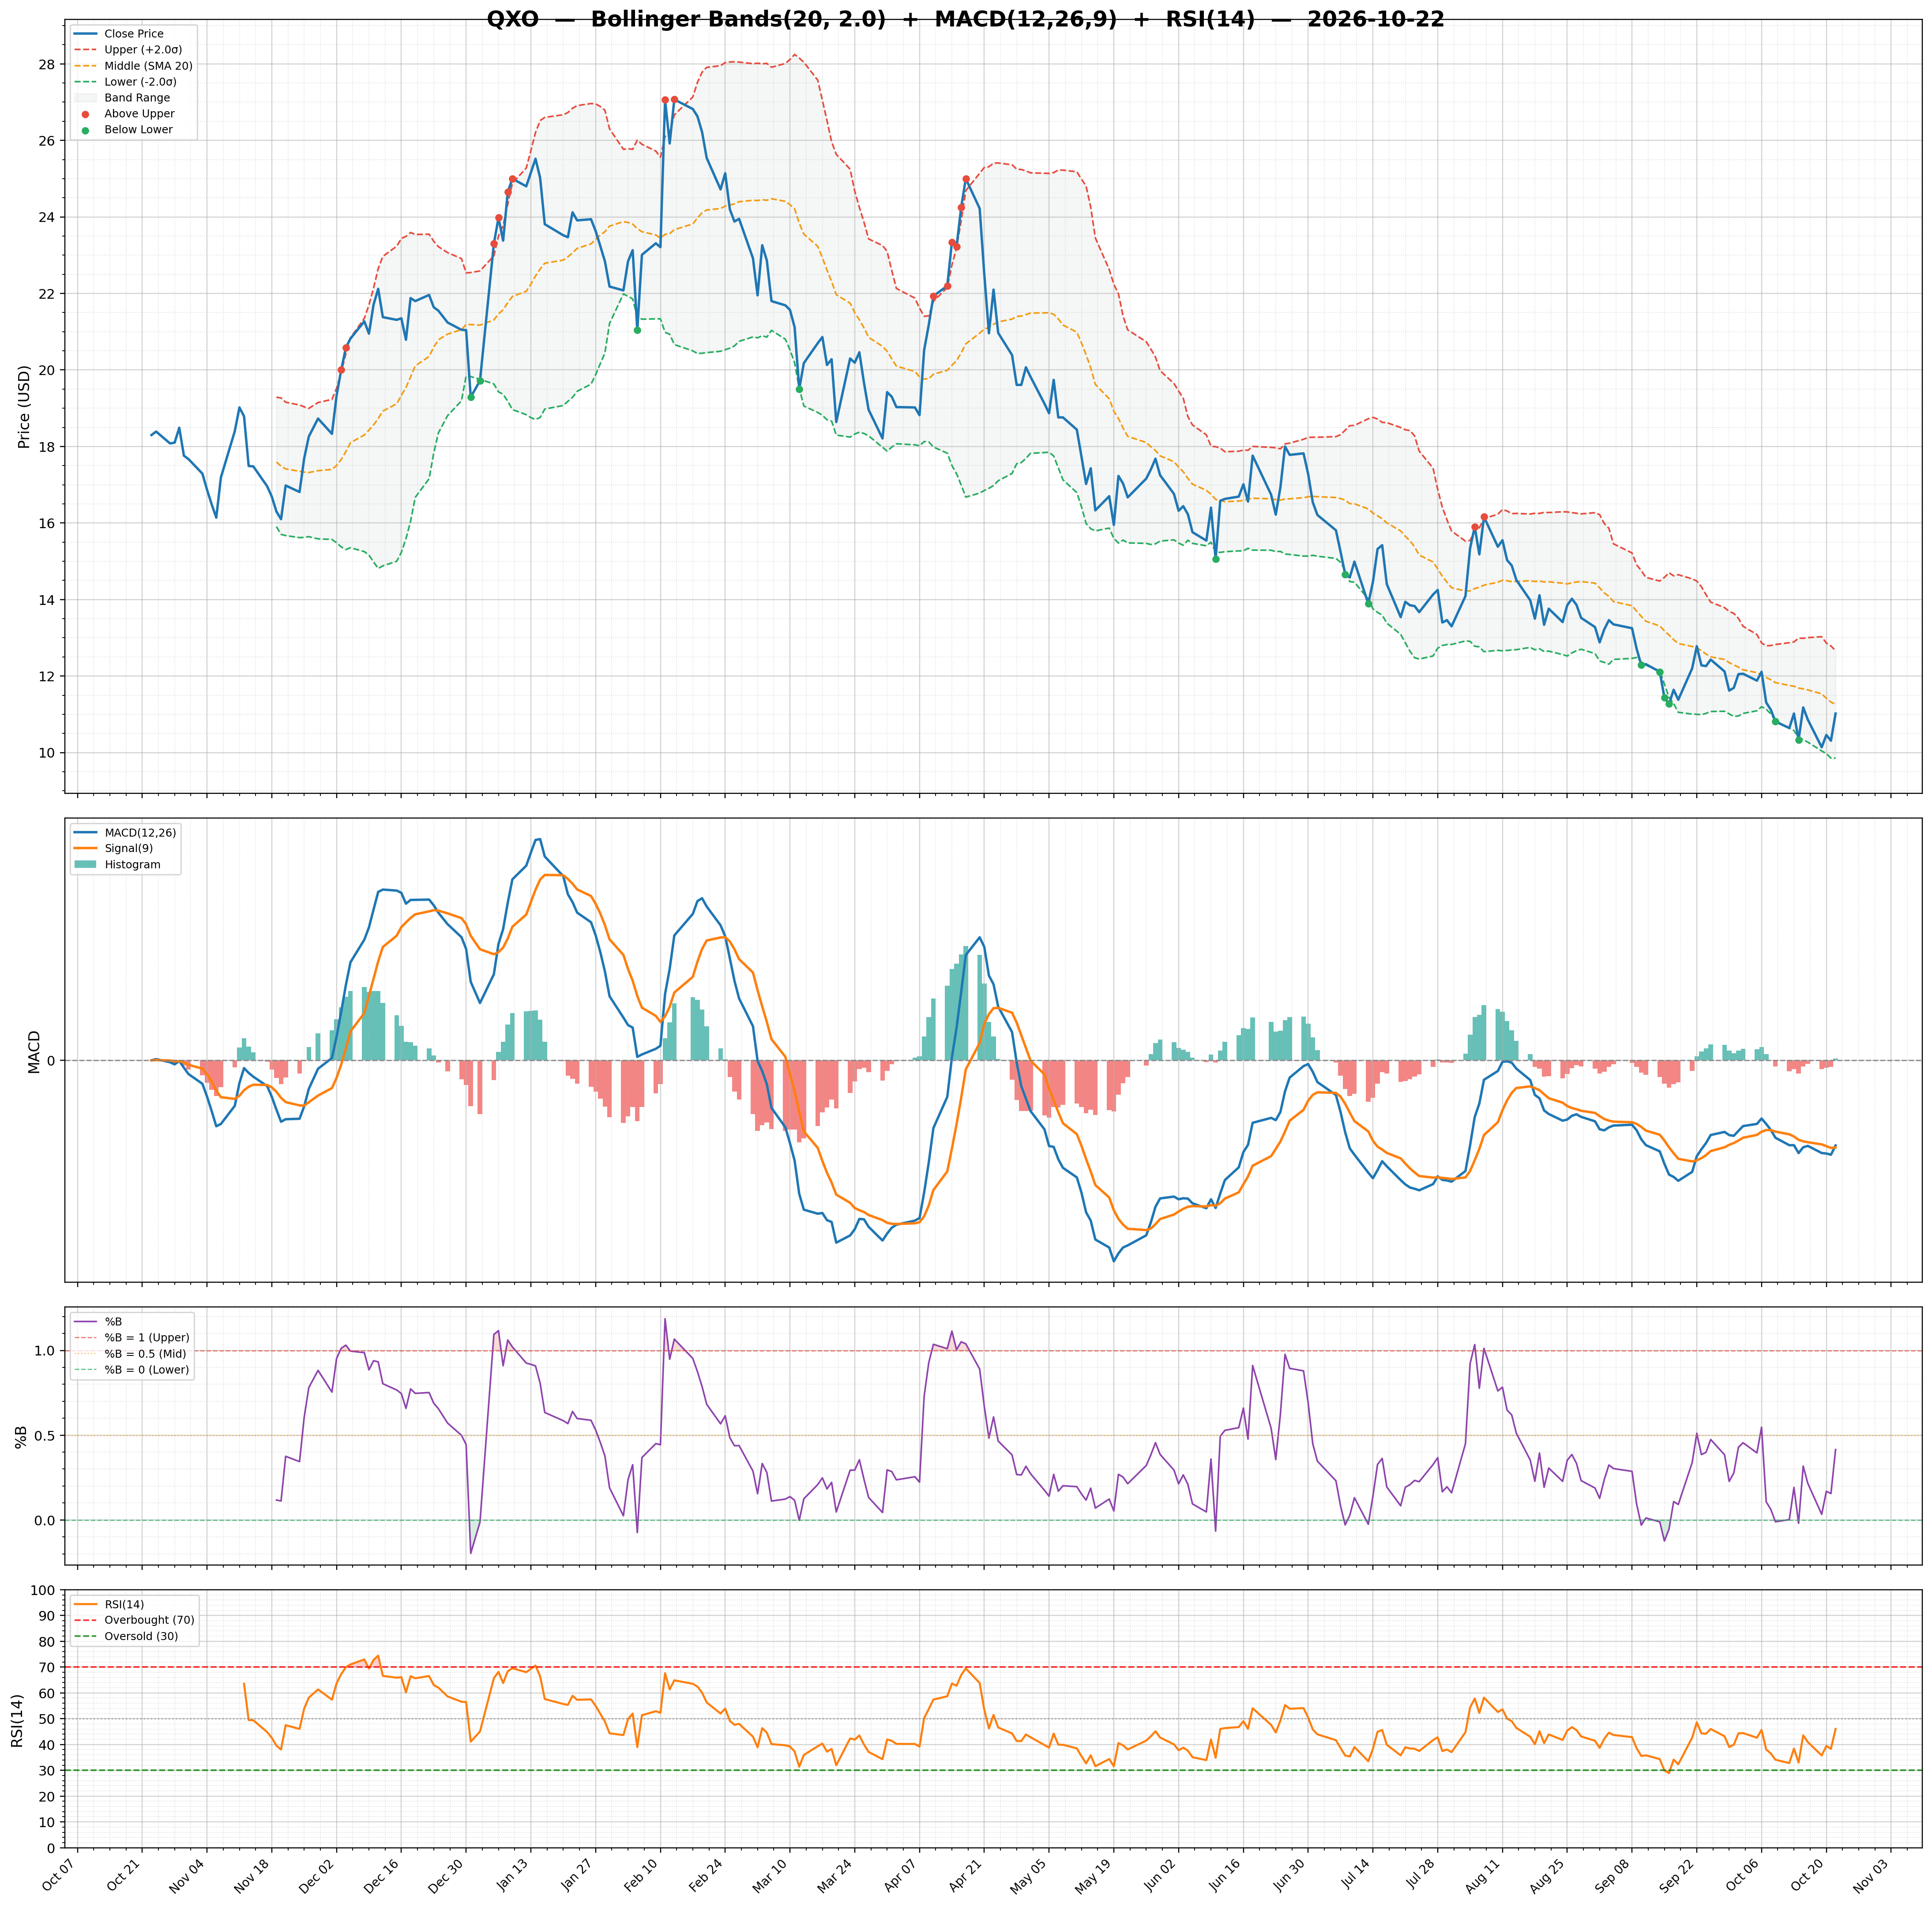
| RSI | 46.05 | Volume | 20.7M | Rating | strong_buy |
| Previous RSI | 38.32 | Avg Volume 20D | 23.74M | Target Mean | $26.00 |
| RSI Trend | Up | Relative Volume | 1.09 | Target High | $50.00 |
| MACD | -0.53 | Lower Band | 9.86 | Target Low | $15.00 |
| MACD Signal | -0.54 | Middle Band | 11.26 | Target Median | $25.00 |
| Histogram | 0.01 | Upper Band | 12.66 | Analysts | 19 |
| Previous Histogram | -0.04 | Bandwidth | 24.920 | Upside | 139.41% |
| Histogram Trend | Increasing | %B | 0.42 | ||