Rapport Therapeutics, Inc. (RAPP)
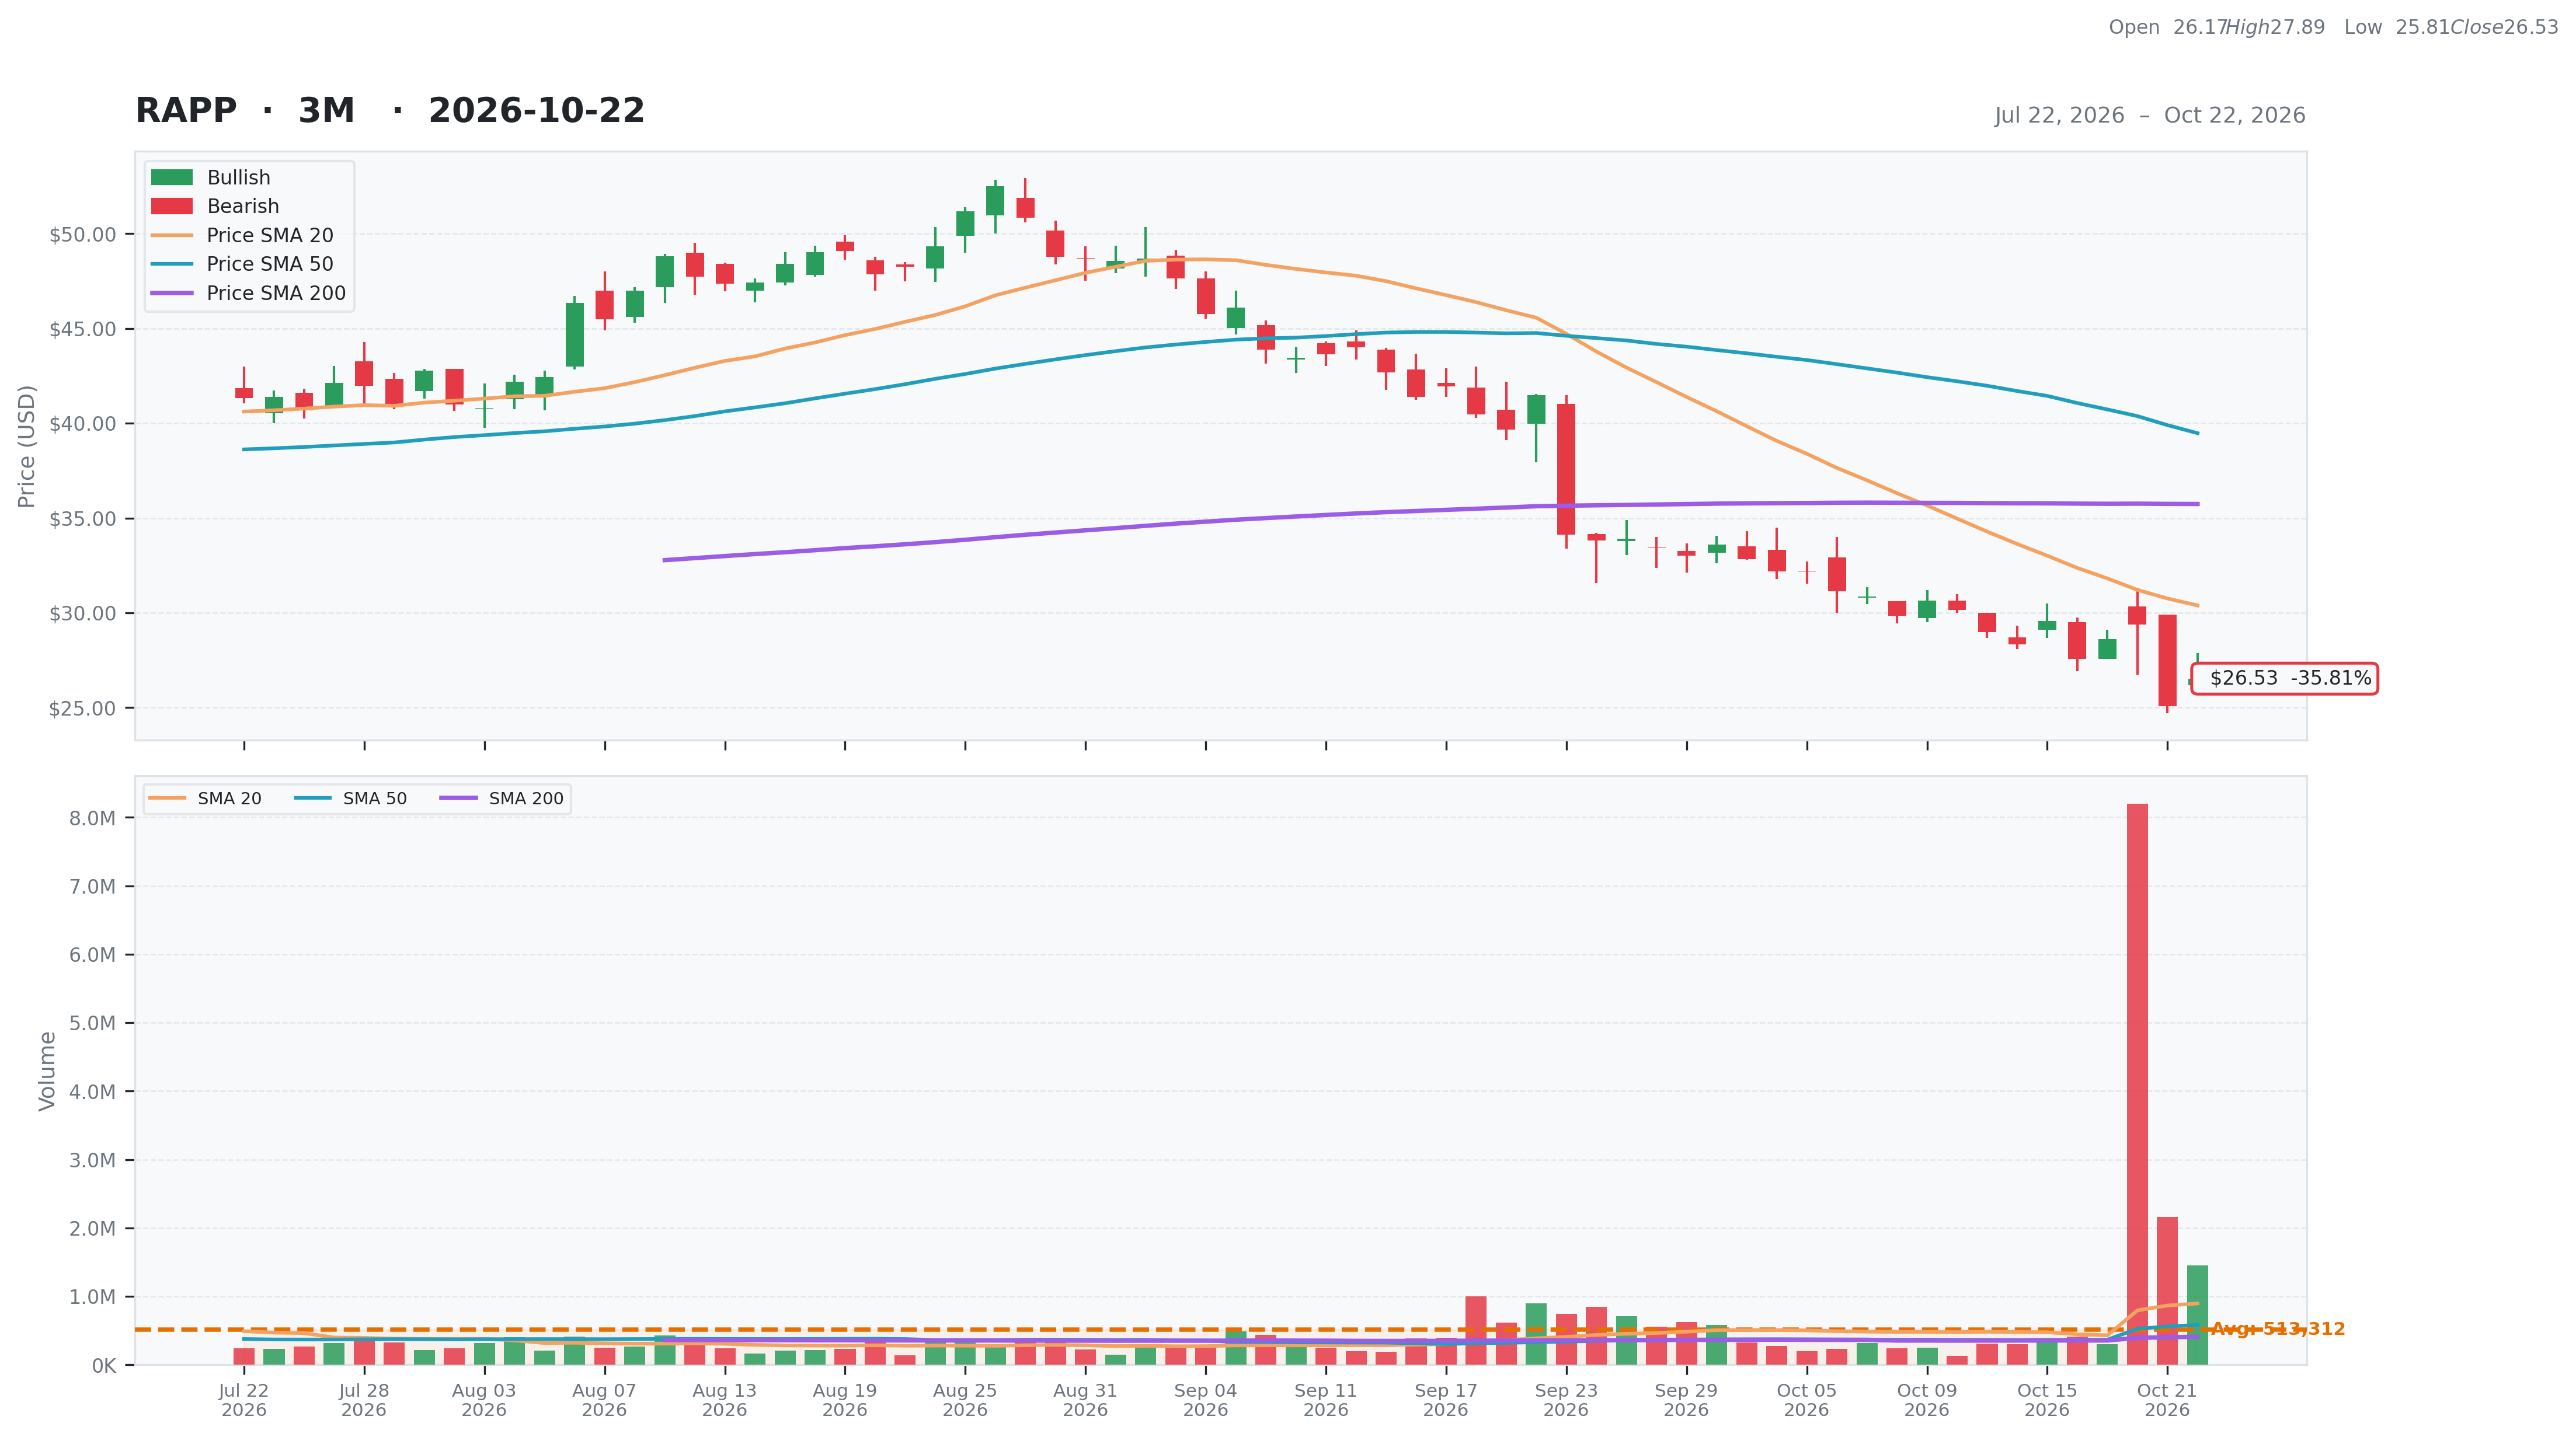
Healthcare • Biotechnology • $26.53 • MCap: 1,322,761,344
https://www.rapportrx.com • Rapport Therapeutics, Inc., operates as a clinical-stage biopharmaceutical company that focuses on the discovery and development of transformational small molecule medicines for patients suffering from central nervous system (CNS) disorders. The company's lead product candidate is receptor associated protein (RAP)-219, an investigational small molecule that is designed to inhibit TARPy8-containing AMPARs with picomolar affinity for the treatment of focal epilepsy and other CNS disorders, including peripheral neuropathic pain and bipolar disorder. It also develops nicotinic acetylcholine receptor (nAChR) programs, such as a6 nAChR to treat chronic pain and migraine; and a9a10 nAChR for the treatment of hearing/vestibular disorders. The company was formerly known as Precision Neuroscience NewCo, Inc. and changed its name to Rapport Therapeutics, Inc. in October 2022. Rapport Therapeutics, Inc. was incorporated in 2022 and is headquartered in Boston, Massachusetts.
| Score | Price | 52 Week & Averages | Relative Strength | Risk | |||||
|---|---|---|---|---|---|---|---|---|---|
| Total | 29 | Current | $26.53 | 52W High | $52.50 -49.47% | Relative Strength | -0.20 | Beta | 1.22 |
| Business Quality | 1 | Weekly | $29.57 -10.28% | 52W Low | $24.37 8.86% | 3M | -0.35 | Short % | 0.11 |
| Financial Strength | 10 | Monthly | $41.47 -36.03% | Above 50DMA | $39.48 -32.79% | 6M | -0.27 | Risk Score | 7 |
| Growth Outlook | 1 | Quarterly | $40.68 -34.78% | Above 200DMA | $35.74 -25.77% | 9M | -0.05 | ||
| Momentum | 3 | Yearly | $26.48 0.19% | 12M | 0.02 | ||||
| Valuation | Financial Strength | Growth/Profitability | |||
|---|---|---|---|---|---|
| Trailing P/E | N/A | Cash | 436M | Revenue Growth | N/A |
| Forward P/E | -5.40 | Debt | 10M | Earnings Growth | N/A |
| PEG Ratio | N/A | Debt/Equity | 2.39 | Qtr Earnings Growth | N/A |
| Price/Sales | 66.14 | Current Ratio | 15.72 | Gross Margin | -1.09% |
| Price/Book | 3.13 | Quick Ratio | 15.35 | Operating Margin | -7.68% |
| EV/Revenue | 44.74 | Operating CF | -97M | Profit Margin | 0.00% |
| EV/EBITDA | -5.87 | Free CF | -56M | EBITDA Margin | 0.00% |
| Ent Value | 895M | Return on Assets | -0.26% | ||
| Return on Equity | -0.40% | ||||
| Technical | Volume & Bollinger Bands | Analyst | |||
|---|---|---|---|---|---|
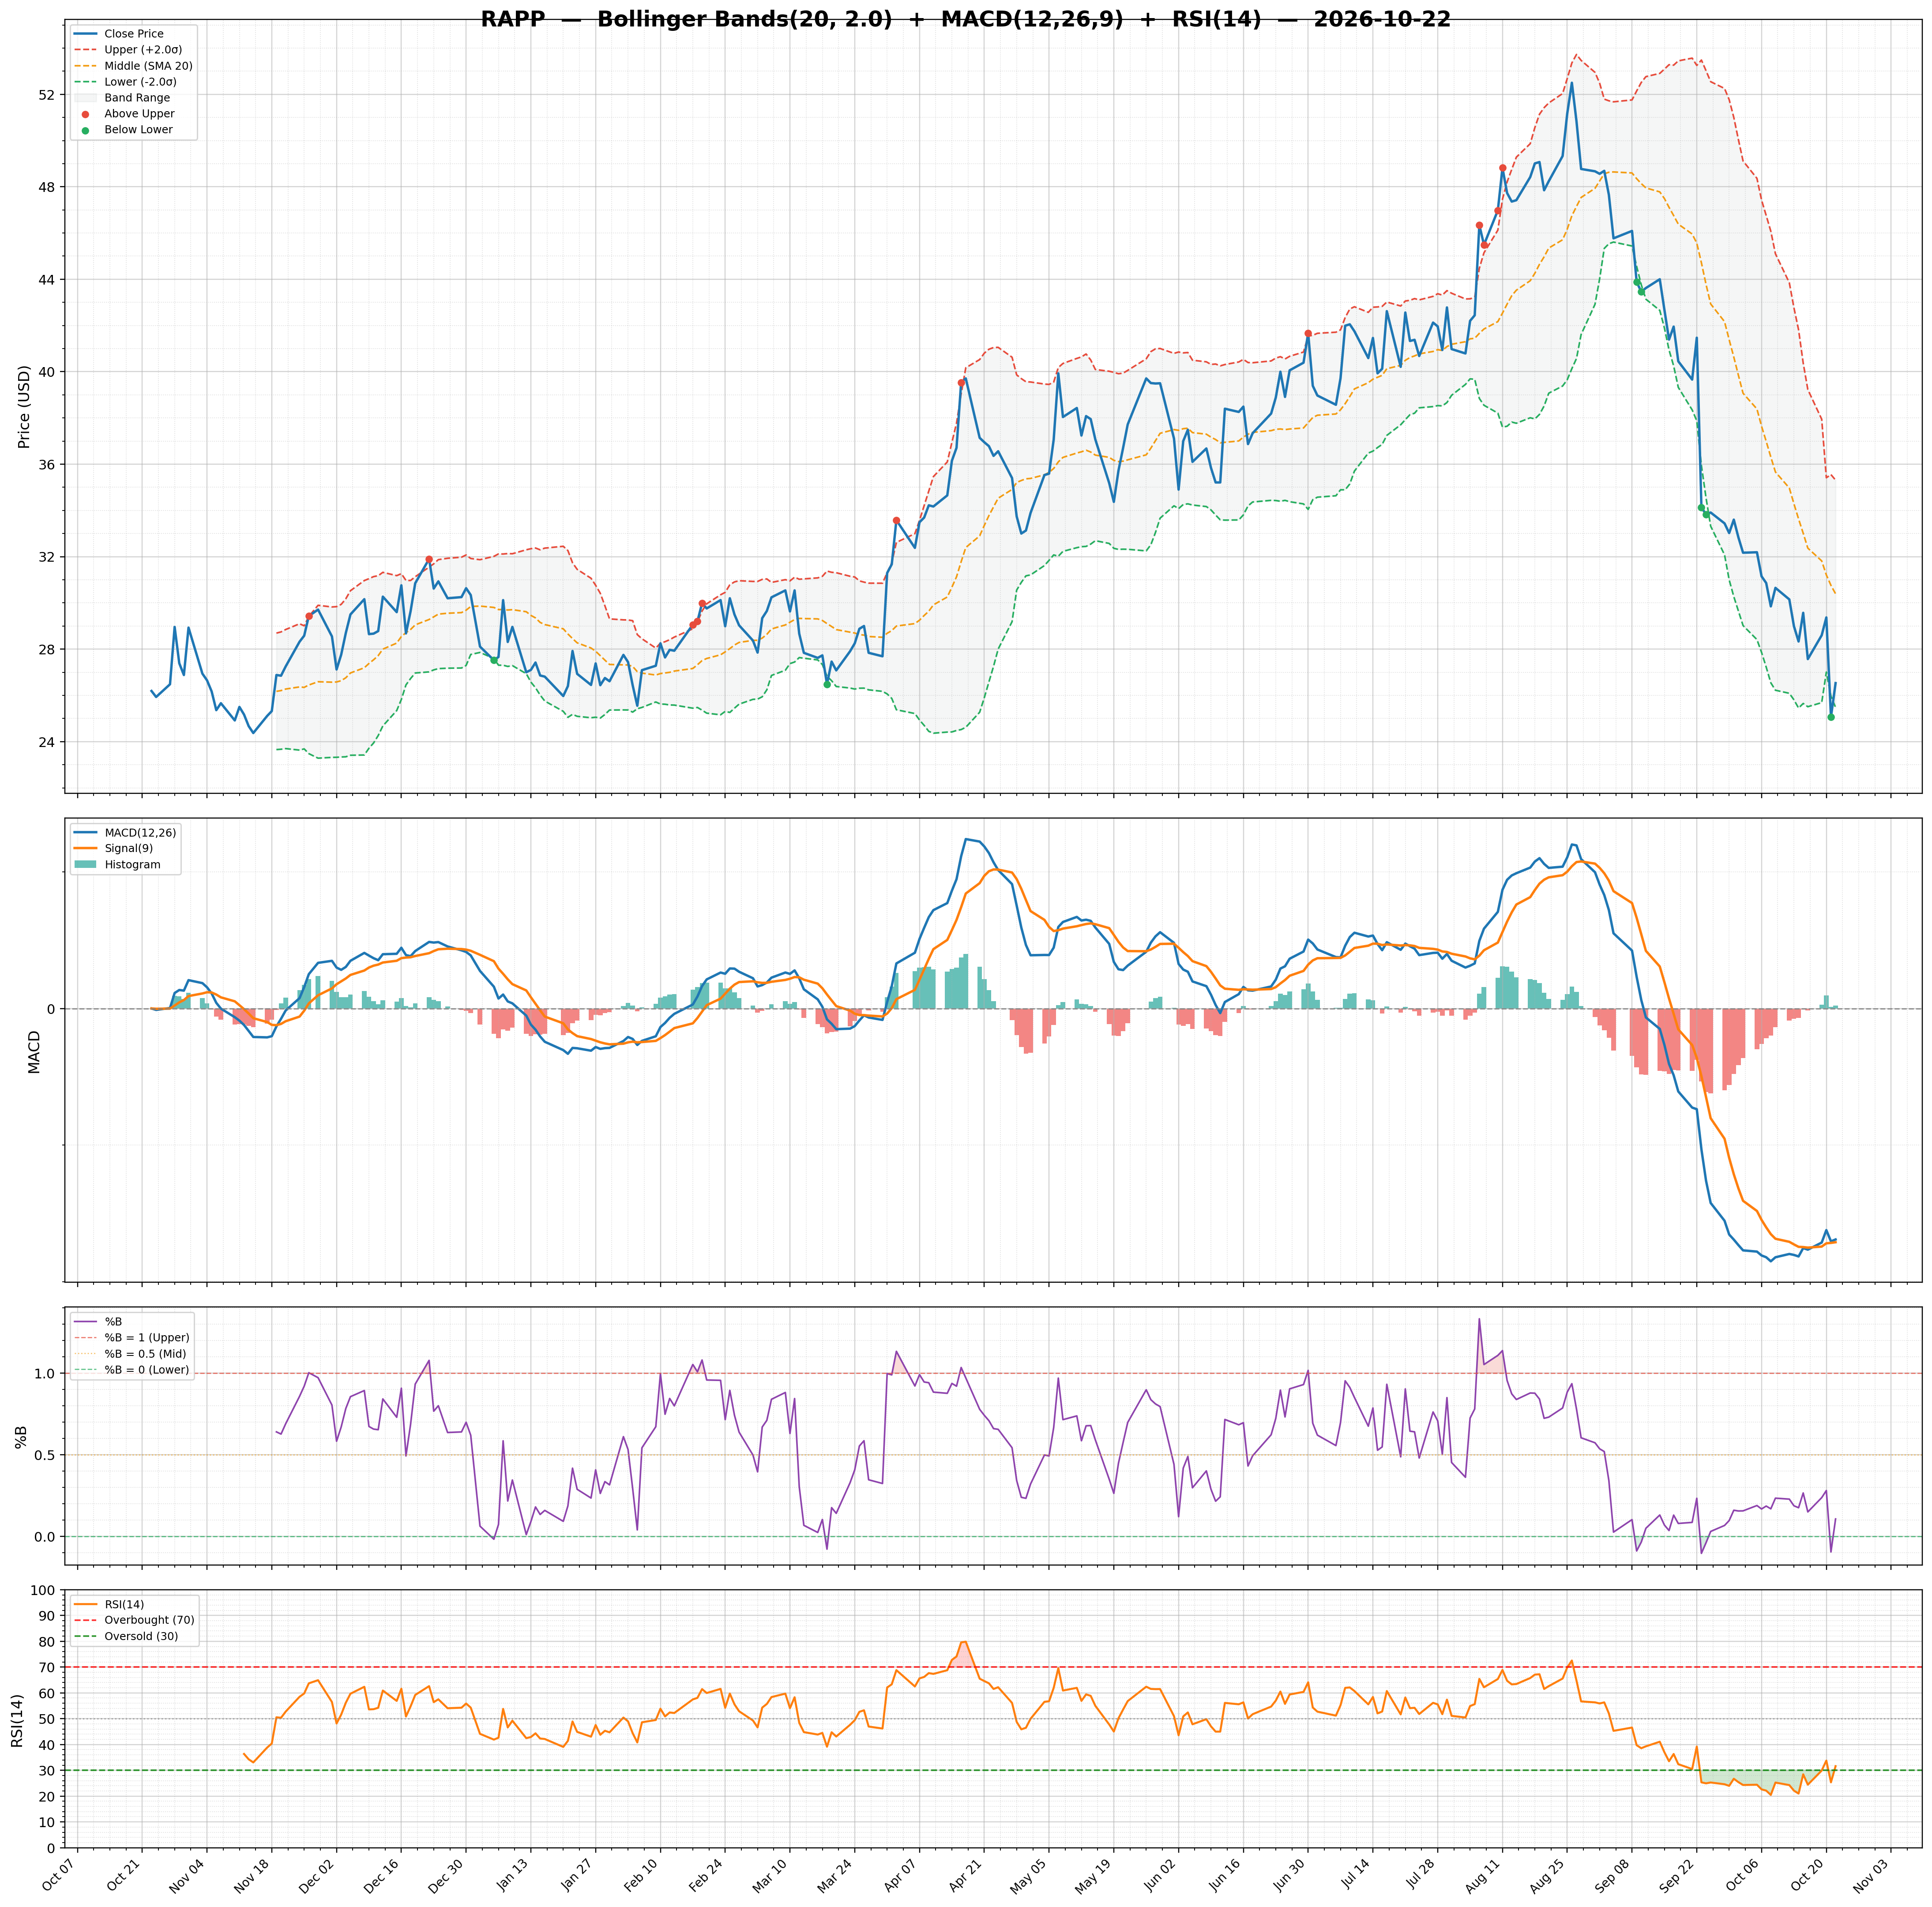
| RSI | 31.61 | Volume | 0.41M | Rating | strong_buy |
| Previous RSI | 25.35 | Avg Volume 20D | 0.9M | Target Mean | $62.71 |
| RSI Trend | Up | Relative Volume | 1.86 | Target High | $80.00 |
| MACD | -3.38 | Lower Band | 25.47 | Target Low | $50.00 |
| MACD Signal | -3.42 | Middle Band | 30.39 | Target Median | $62.00 |
| Histogram | 0.04 | Upper Band | 35.31 | Analysts | 15 |
| Previous Histogram | 0.02 | Bandwidth | 32.360 | Upside | 127.44% |
| Histogram Trend | Increasing | %B | 0.11 | ||