Rocky Brands, Inc. (RCKY)
Consumer Cyclical • Footwear & Accessories • $47.64 • MCap: 343,204,448
https://www.rockybrands.com • Rocky Brands, Inc. designs, manufactures, and markets footwear and apparel in the United States, Canada, the United Kingdom, and internationally. It operates through Wholesale, Retail, and Contract Manufacturing segments. The Wholesale segment offers products, which includes sporting goods stores, outdoor retailers, independent shoe retailers, hardware stores, mass merchants, uniform stores, farm store chains, specialty safety stores, specialty retailers, and online retailers in retail locations through a range of distribution channels. Its Retail segment sells its products direct sales to consumers through its websites comprising rockyboots.com, georgiaboot.com, durangoboot.com, muckbootcompany.com, xtratuf.com, lehighoutfitters.com, lehighsafetyshoes.com, and slipgrips.com; and third-party marketplaces and Rocky Outdoor Gear Stores. The Contract Manufacturing segment include private label sales and sales to customers which are contracted to manufacture a specific footwear product for a customers. This segment also sells to the U.S. Military. It serves industrial and construction workers; hospitality industry workers, such as restaurants or hotels; farmers and ranchers; hunting, fishing, camping, and hiking enthusiasts; law enforcement, security personnel, and postal employees; and for the U.S. military personnel. The company sells its products under the Rocky, Georgia Boot, Durango, Lehigh, Muck, XTRATUF, Ranger, and Michelin brand names. The company was formerly known as William Brooks Shoe Co. Rocky Brands, Inc. was founded in 1932 and is headquartered in Nelsonville, Ohio.
AAII
| Score | Price | 52 Week & Averages | Relative Strength | Risk | |||||
|---|---|---|---|---|---|---|---|---|---|
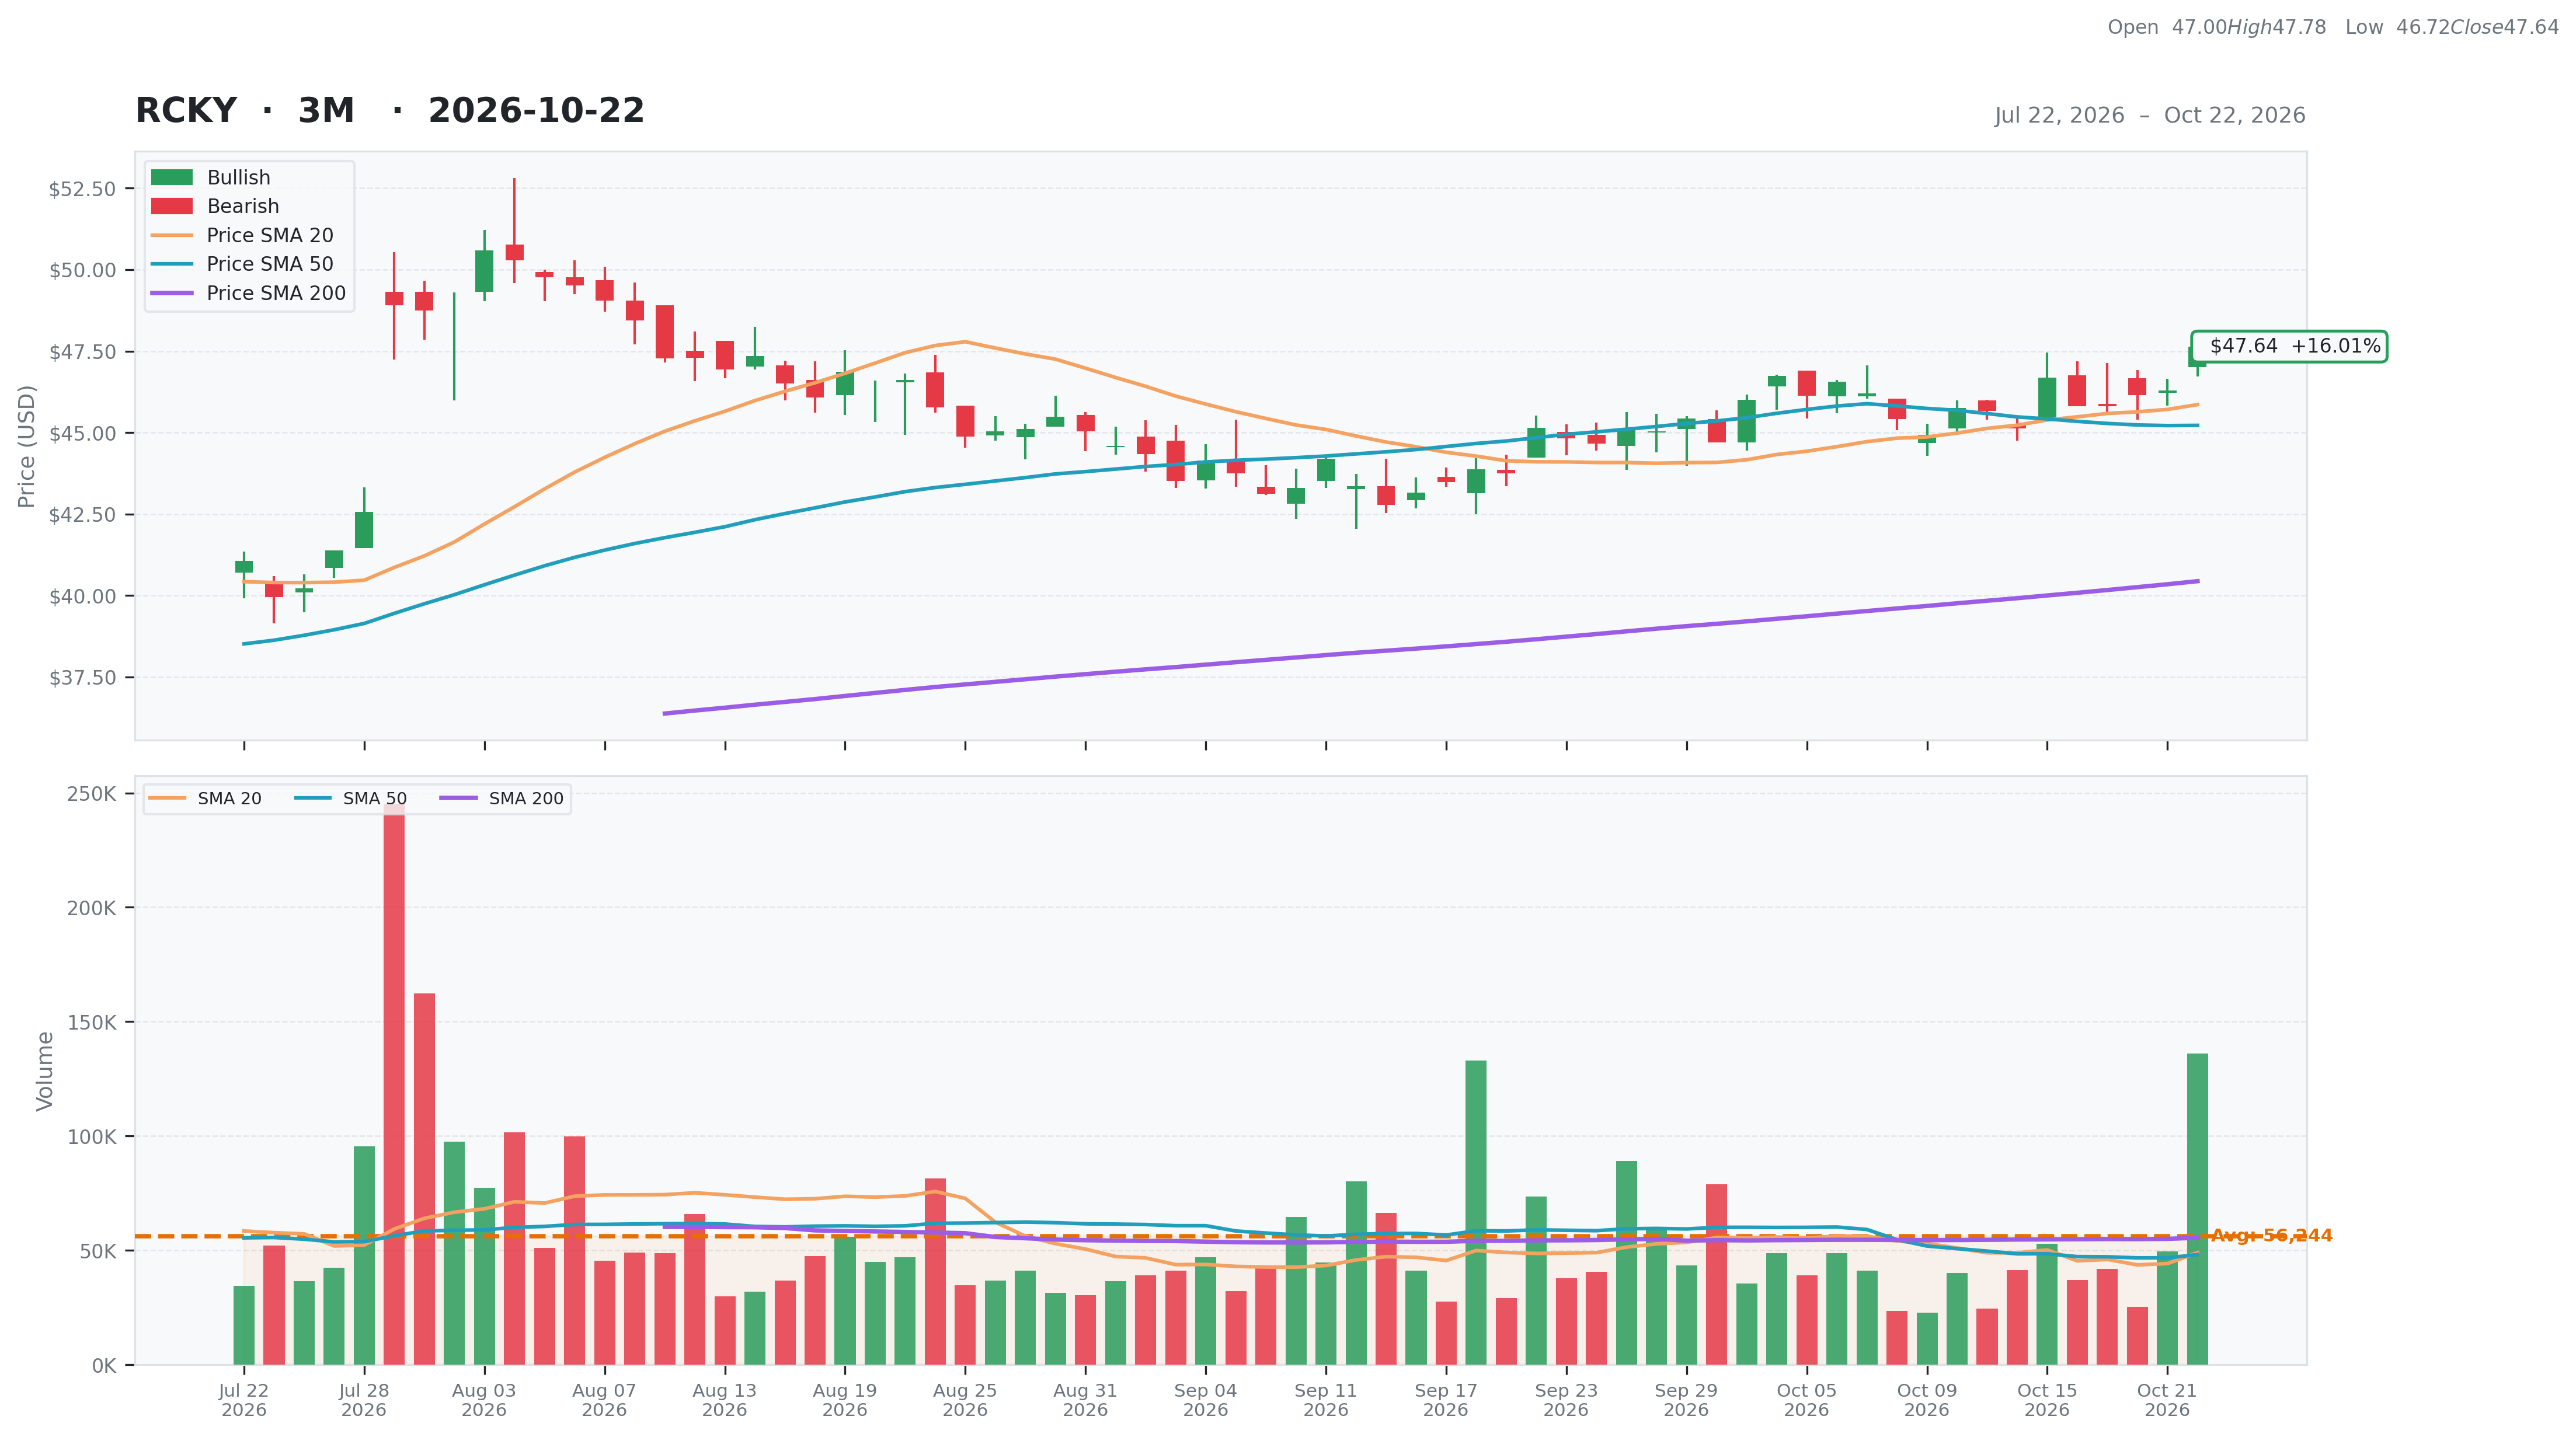
| Total | 59 | Current | $47.64 | 52W High | $50.59 -5.83% | Relative Strength | 0.31 | Beta | 2.39 |
| Business Quality | 9 | Weekly | $46.68 2.06% | 52W Low | $27.72 71.85% | 3M | 0.18 | Short % | 0.03 |
| Financial Strength | 12 | Monthly | $45.15 5.51% | Above 50DMA | $45.22 5.35% | 6M | 0.11 | Risk Score | 6 |
| Growth Outlook | 13 | Quarterly | $40.22 18.45% | Above 200DMA | $40.44 17.80% | 9M | 0.44 | ||
| Momentum | 4 | Yearly | $28.88 64.94% | 12M | 0.62 | ||||
| Valuation | Financial Strength | Growth/Profitability | |||
|---|---|---|---|---|---|
| Trailing P/E | 12.02 | Cash | 3M | Revenue Growth | 0.12% |
| Forward P/E | 10.91 | Debt | 130M | Earnings Growth | 2.81% |
| PEG Ratio | 1.17 | Debt/Equity | 49.32 | Qtr Earnings Growth | 2.85% |
| Price/Sales | 0.68 | Current Ratio | 2.97 | Gross Margin | 0.39% |
| Price/Book | 1.30 | Quick Ratio | 1.06 | Operating Margin | 0.02% |
| EV/Revenue | 0.93 | Operating CF | 24M | Profit Margin | 0.06% |
| EV/EBITDA | 12.49 | Free CF | -4M | EBITDA Margin | 0.07% |
| Ent Value | 471M | Return on Assets | 0.04% | ||
| Return on Equity | 0.11% | ||||
| Technical | Volume & Bollinger Bands | Analyst | |||
|---|---|---|---|---|---|
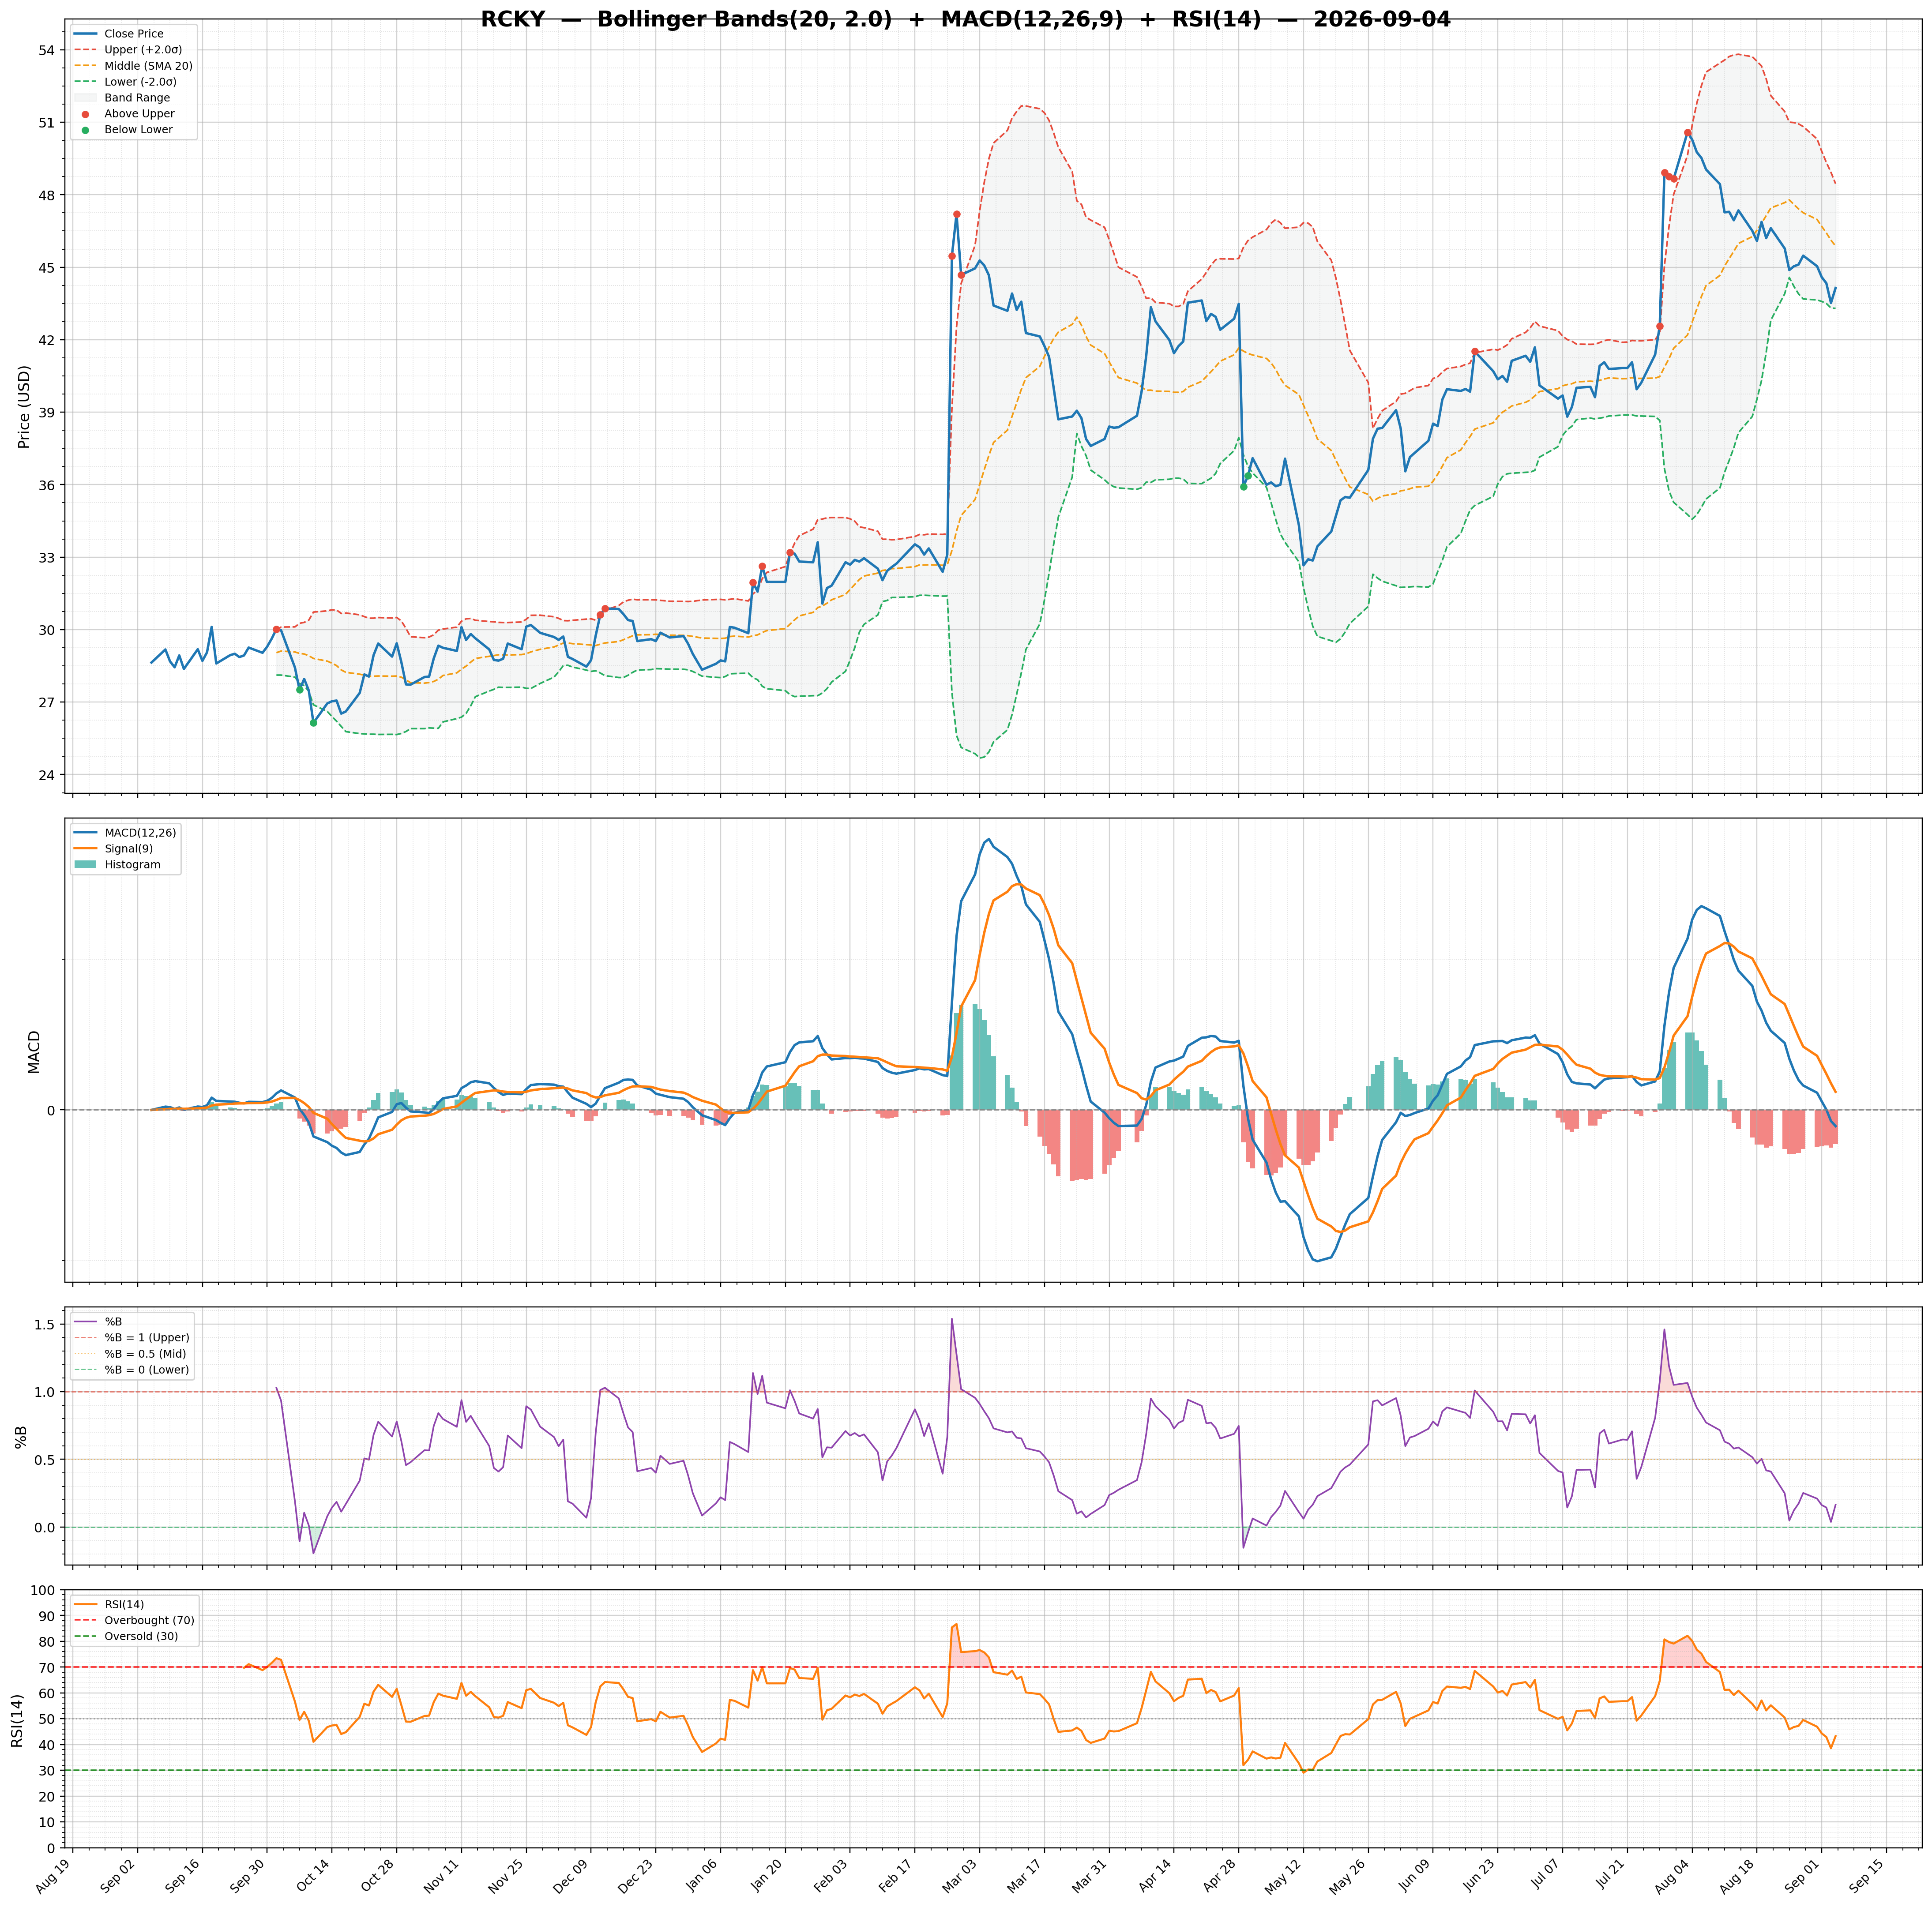
| RSI | 62.83 | Volume | 0.04M | Rating | none |
| Previous RSI | 55.69 | Avg Volume 20D | 0.05M | Target Mean | $50.00 |
| RSI Trend | Up | Relative Volume | 2.63 | Target High | $50.00 |
| MACD | 0.46 | Lower Band | 44.40 | Target Low | $50.00 |
| MACD Signal | 0.34 | Middle Band | 45.86 | Target Median | $50.00 |
| Histogram | 0.12 | Upper Band | 47.32 | Analysts | 1 |
| Previous Histogram | 0.03 | Bandwidth | 6.350 | Upside | 9.15% |
| Histogram Trend | Increasing | %B | 1.11 | ||