RCM Technologies, Inc. (RCMT)
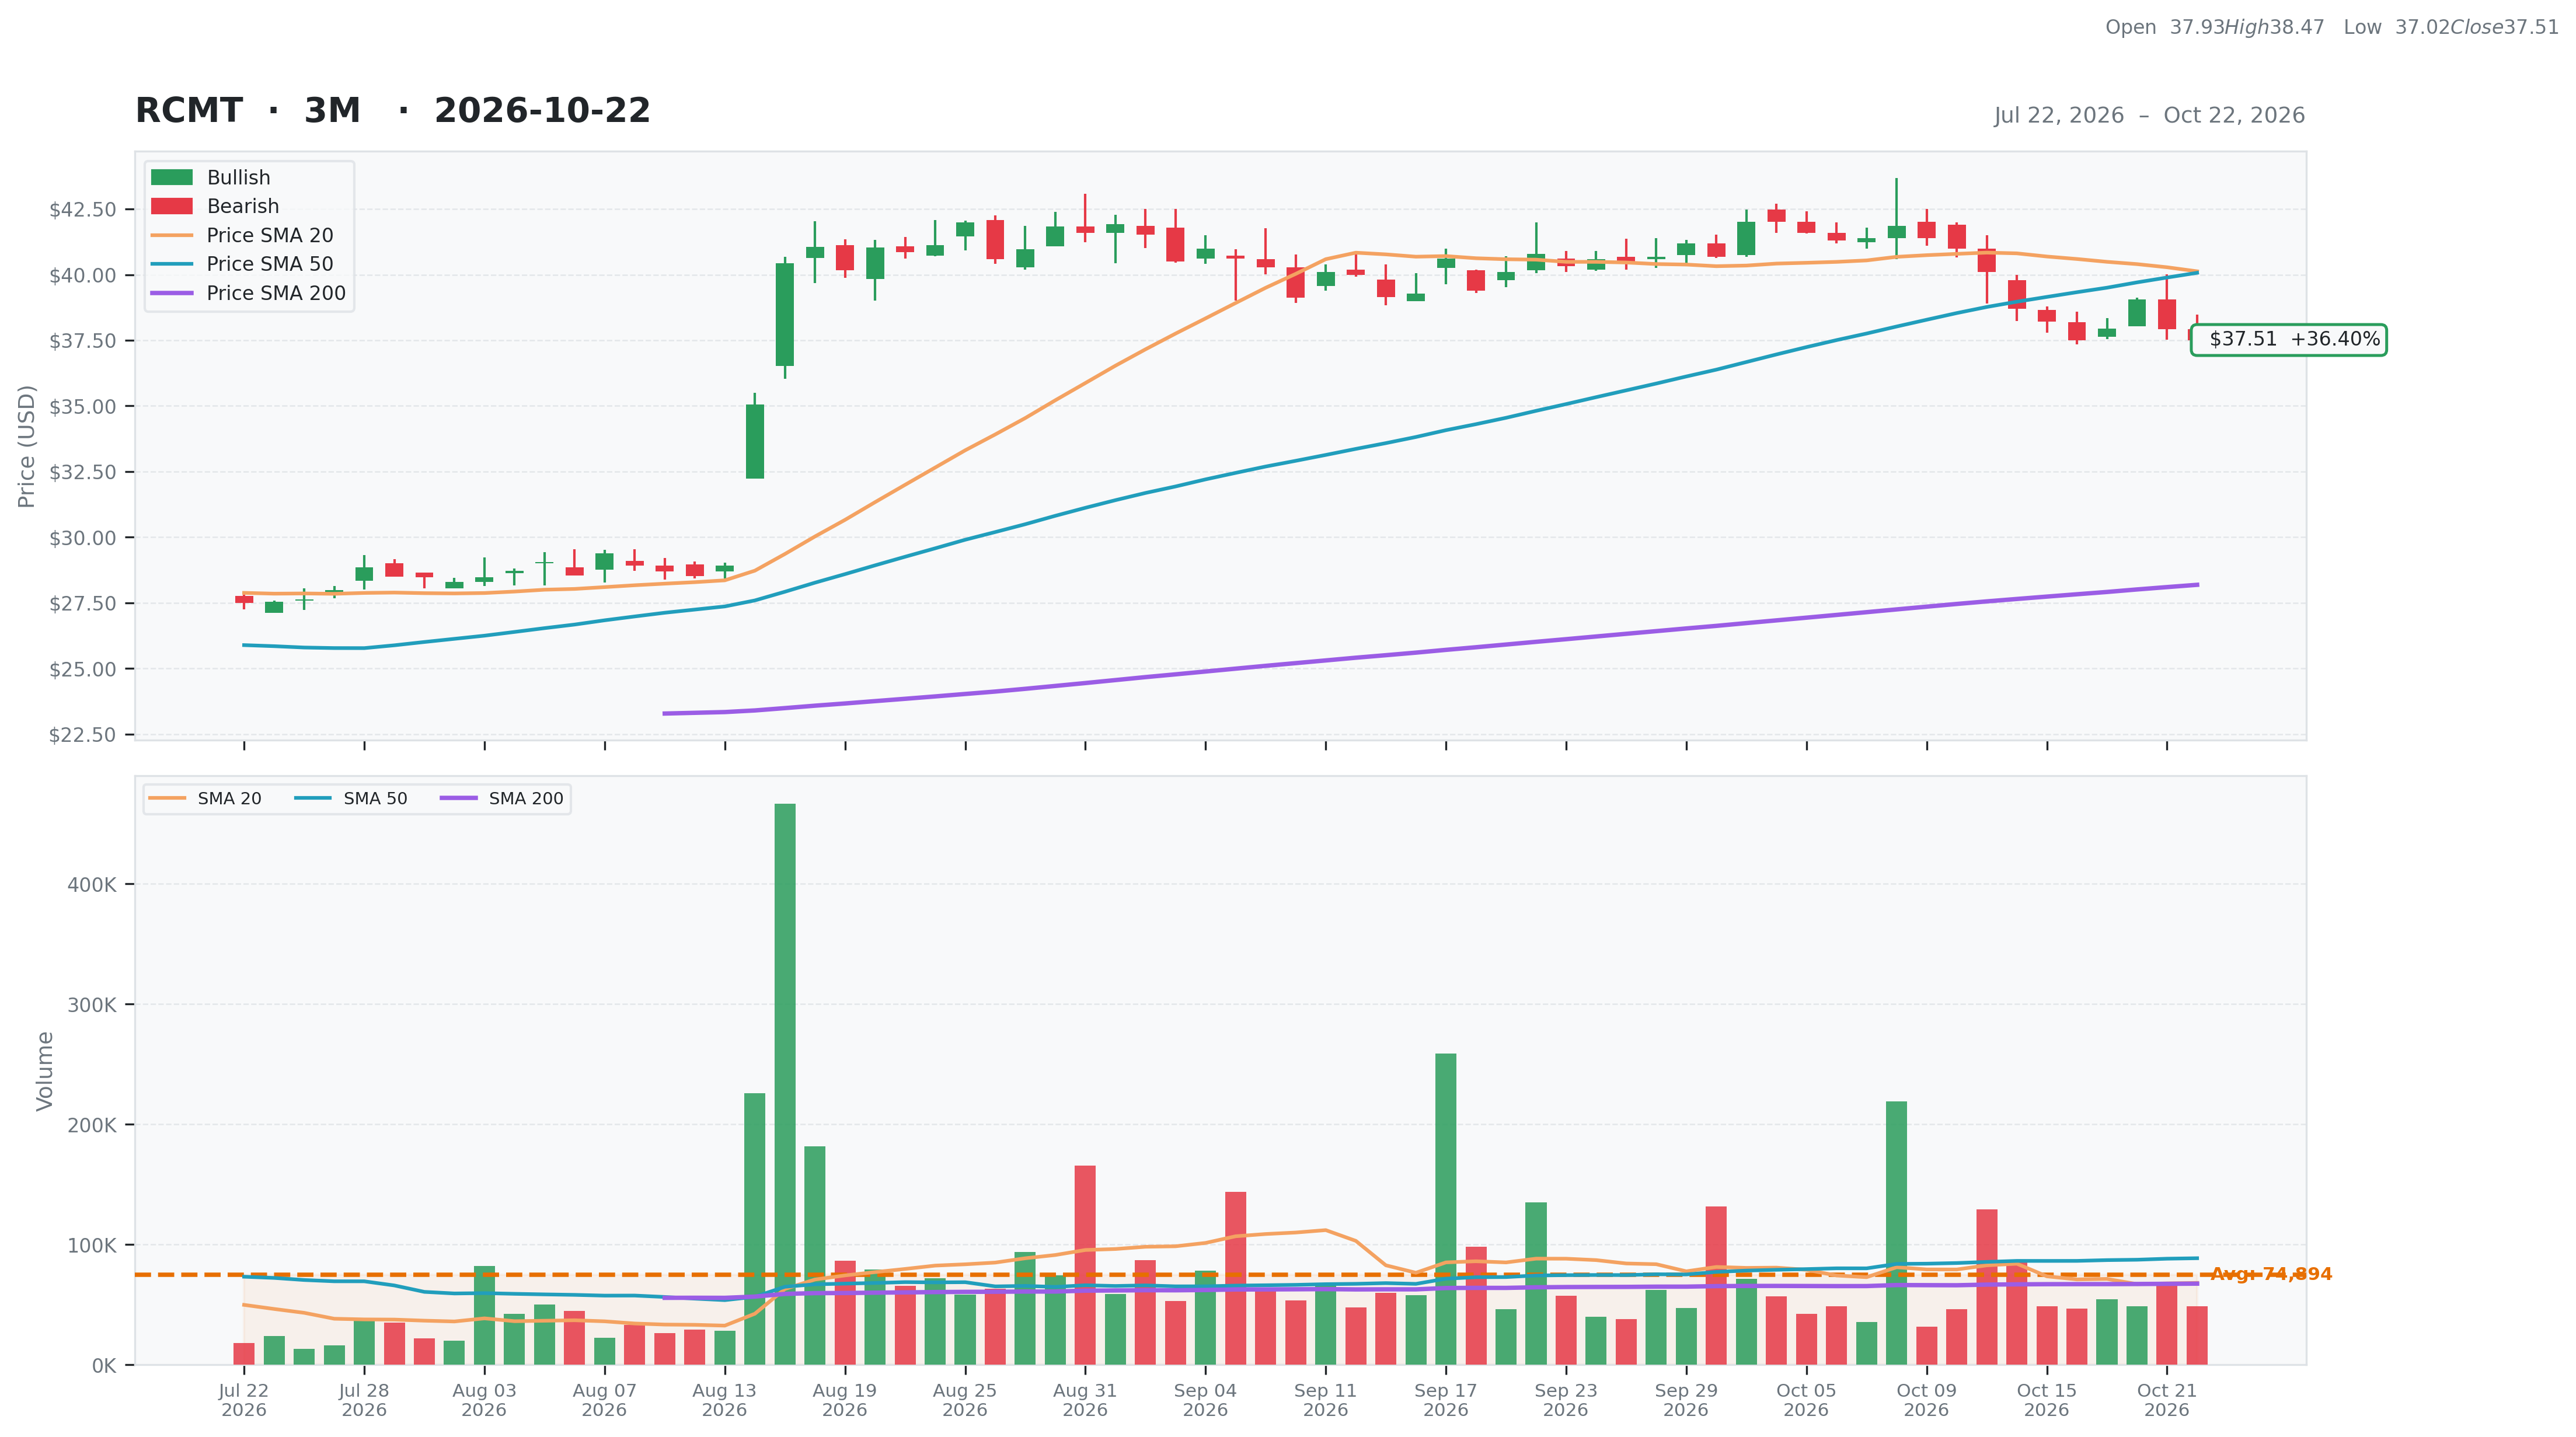
Industrials • Conglomerates • $37.51 • MCap: 266,653,456
https://www.rcmt.com • RCM Technologies, Inc. engages in the provision of business and technology solutions in the United States, Canada, Puerto Rico, Europe, and Philippines. The company operates through three segments: Engineering; Specialty Health Care; and Life Sciences, Data and Solutions (LS&D). It offers engineering services, including project management engineering, integrated design engineering, transmission and distribution power delivery, engineering analysis, engineering-procurement-construction, configuration management, hardware/software validation and verification, quality assurance, technical writing and publications, manufacturing process planning and improvement, and 3D/BIM integrated design. The company also provides long-term and short-term staffing, executive search, international recruitment, and placement solutions in the fields of allied and therapy staffing, correctional healthcare staffing, health information management, nursing services, physician and advanced practice, school staffing and recruitment, and telepractice. In addition, it offers enterprise business solutions, application development and support, IT infrastructure deployment and management, data solutions, digitization, human capital management solutions, as well as technology and business solutions for the life sciences industry and other specific verticals. The company serves aerospace/defense, educational institutions, energy, financial services, healthcare, life sciences, manufacturing and distribution, public sector, and technology. RCM Technologies, Inc. was incorporated in 1971 and is based in Pennsauken, New Jersey.
Ex-AAII
| Score | Price | 52 Week & Averages | Relative Strength | Risk | |||||
|---|---|---|---|---|---|---|---|---|---|
| Total | 70 | Current | $37.51 | 52W High | $42.02 -10.73% | Relative Strength | 0.48 | Beta | 0.40 |
| Business Quality | 8 | Weekly | $38.21 -1.83% | 52W Low | $17.55 113.73% | 3M | 0.36 | Short % | 0.05 |
| Financial Strength | 19 | Monthly | $40.80 -8.06% | Above 50DMA | $40.07 -6.39% | 6M | 0.21 | Risk Score | 8 |
| Growth Outlook | 15 | Quarterly | $27.63 35.76% | Above 200DMA | $28.19 33.08% | 9M | 0.85 | ||
| Momentum | 4 | Yearly | $22.68 65.39% | 12M | 0.62 | ||||
| Valuation | Financial Strength | Growth/Profitability | |||
|---|---|---|---|---|---|
| Trailing P/E | 16.30 | Cash | 7M | Revenue Growth | 0.20% |
| Forward P/E | 11.49 | Debt | 29M | Earnings Growth | 0.36% |
| PEG Ratio | N/A | Debt/Equity | 59.85 | Qtr Earnings Growth | 0.30% |
| Price/Sales | 0.80 | Current Ratio | 1.92 | Gross Margin | 0.27% |
| Price/Book | 5.44 | Quick Ratio | 1.81 | Operating Margin | 0.08% |
| EV/Revenue | 0.87 | Operating CF | 24M | Profit Margin | 0.05% |
| EV/EBITDA | 10.33 | Free CF | 20M | EBITDA Margin | 0.08% |
| Ent Value | 289M | Return on Assets | 0.12% | ||
| Return on Equity | 0.40% | ||||
| Technical | Volume & Bollinger Bands | Analyst | |||
|---|---|---|---|---|---|
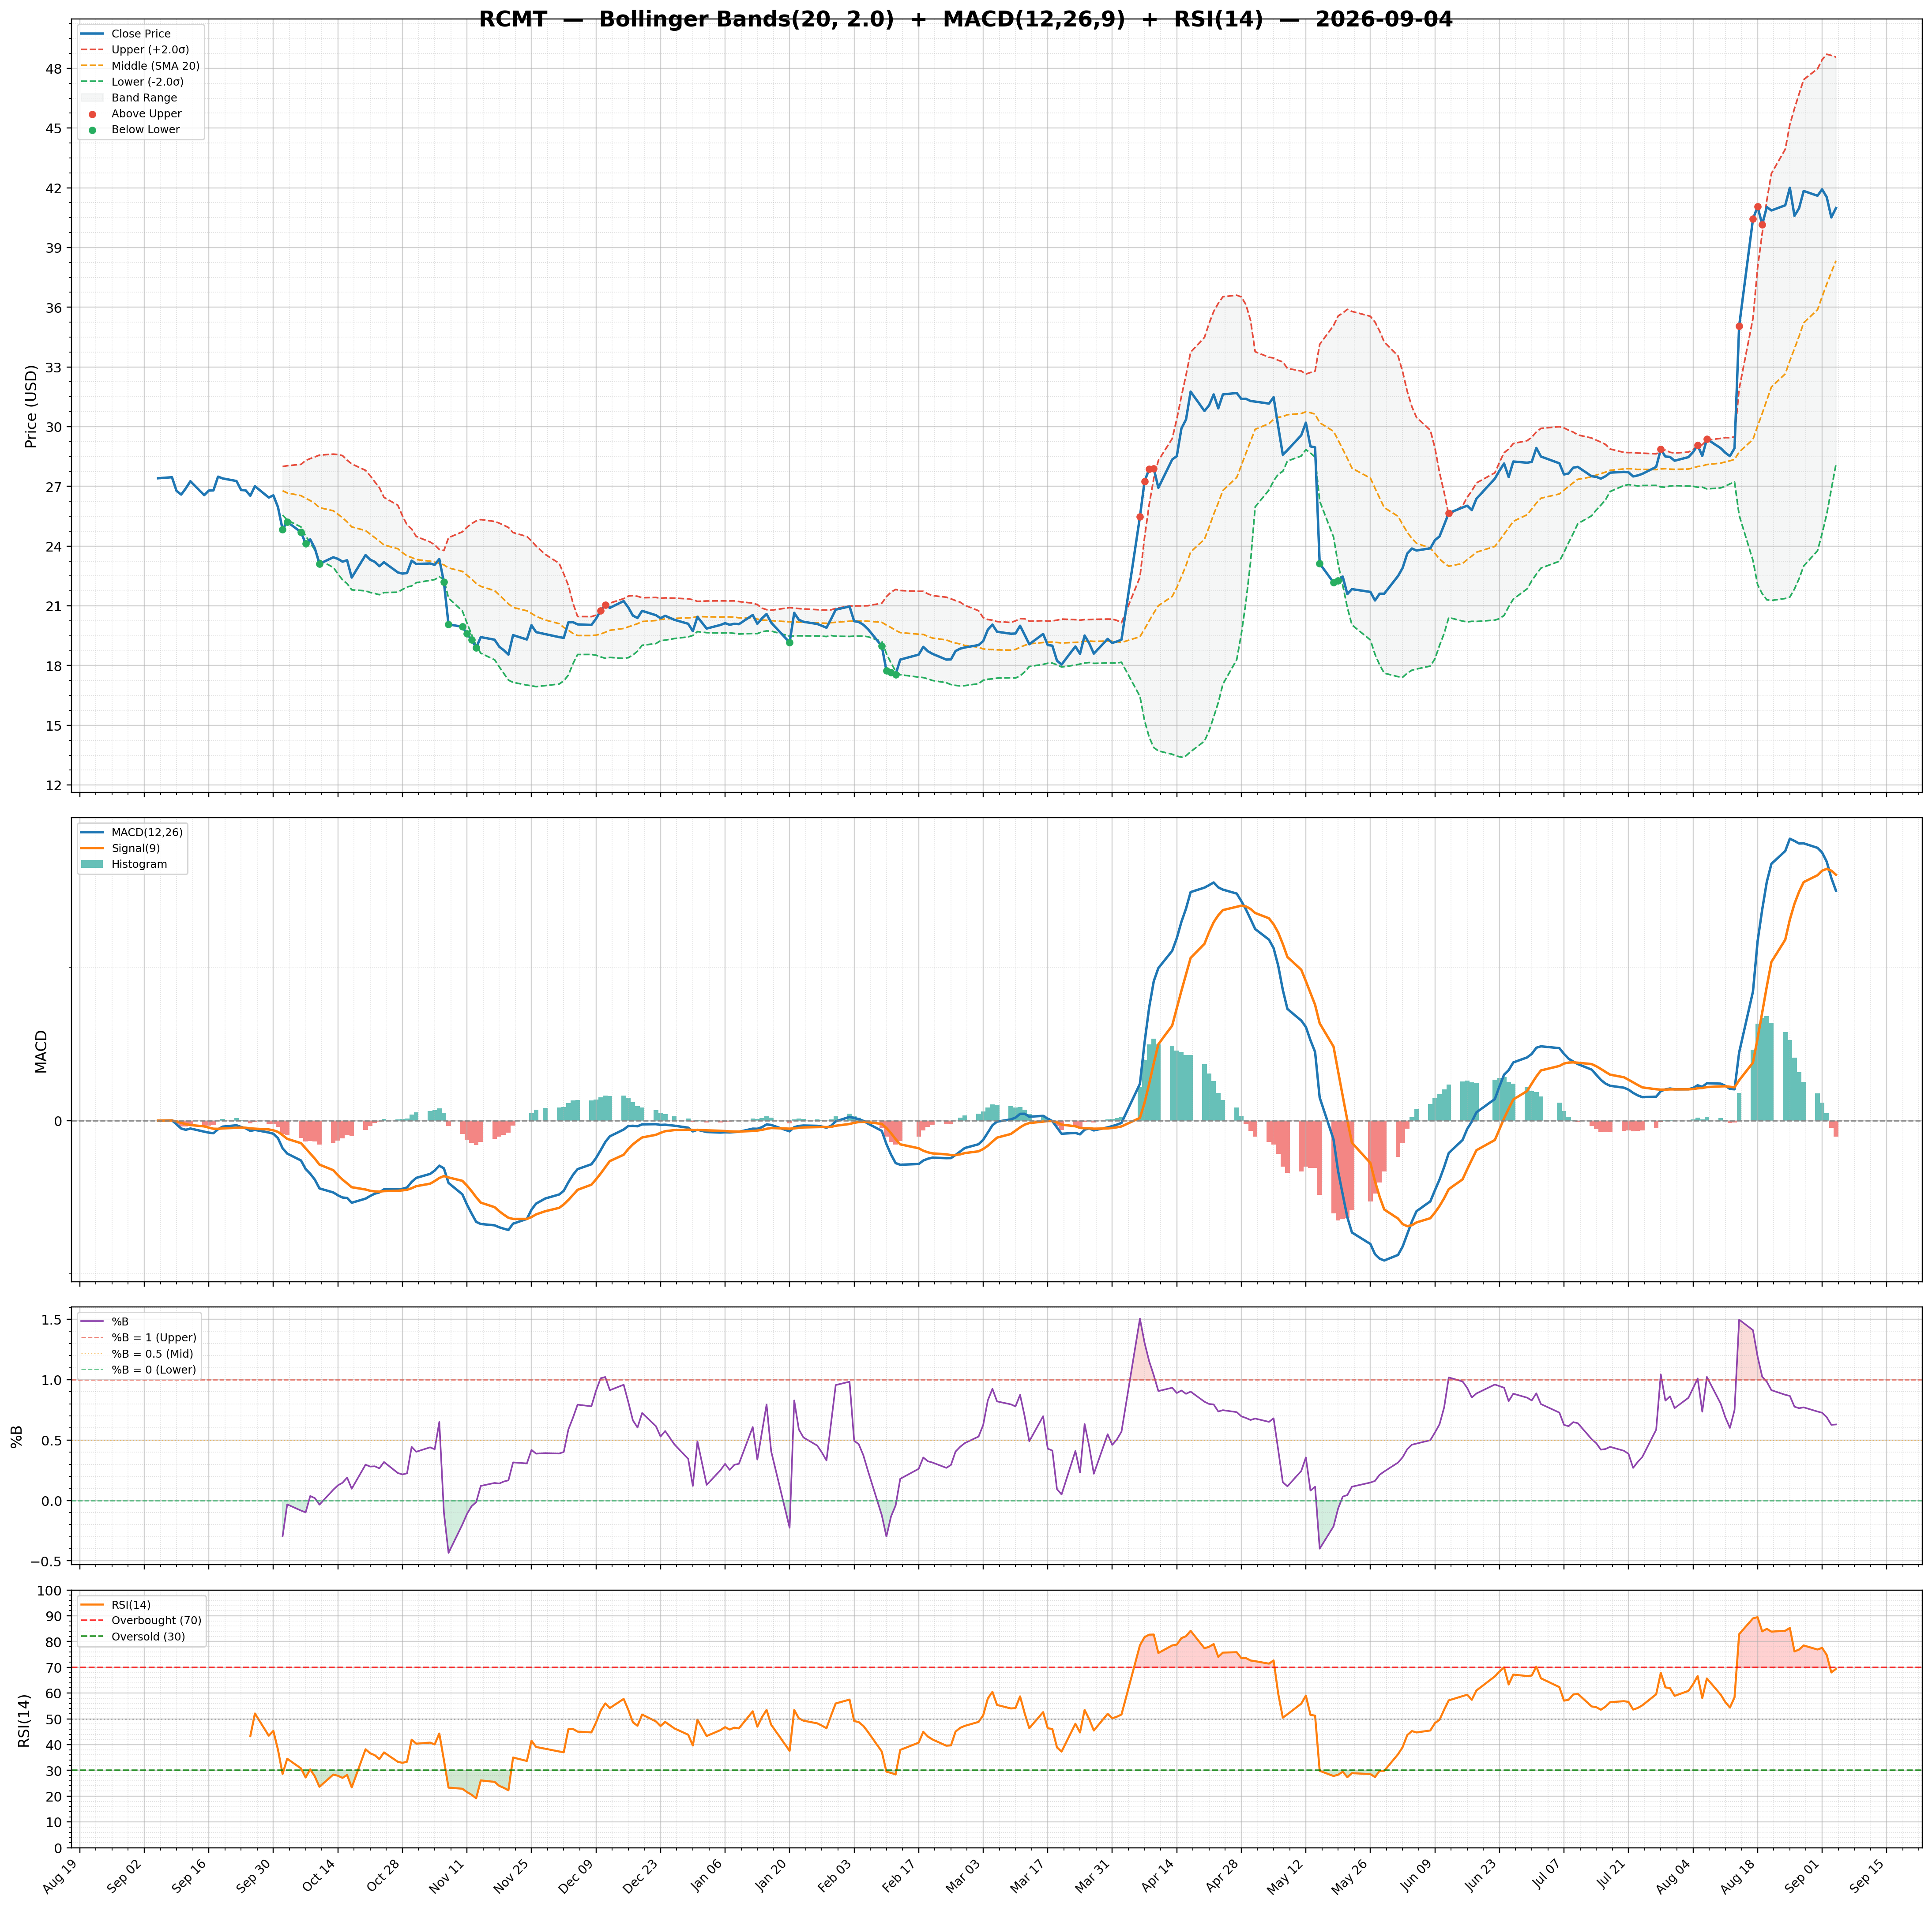
| RSI | 38.69 | Volume | 0.05M | Rating | none |
| Previous RSI | 40.56 | Avg Volume 20D | 0.07M | Target Mean | $45.00 |
| RSI Trend | Down | Relative Volume | 0.65 | Target High | $45.00 |
| MACD | -0.46 | Lower Band | 36.90 | Target Low | $45.00 |
| MACD Signal | 0.02 | Middle Band | 40.13 | Target Median | $45.00 |
| Histogram | -0.47 | Upper Band | 43.36 | Analysts | 2 |
| Previous Histogram | -0.48 | Bandwidth | 16.110 | Upside | 20.00% |
| Histogram Trend | Increasing | %B | 0.10 | ||