REX American Resources Corporat (REX)
Basic Materials • Chemicals • $39.82 • MCap: 1,384,087,680
https://www.rexamerican.com • REX American Resources Corporation, together with its subsidiaries, produces and sells ethanol in the United States. The company provides corn, distillers grains, ethanol, distillers corn oil, gasoline, and natural gas. It also offers dry distillers grains with soluble, which is used as a protein in animal feed. REX American Resources Corporation was formerly known as REX Stores Corporation and changed its name to REX American Resources Corporation in June 2010. The company was founded in 1980 and is headquartered in Dayton, Ohio.
Ex-AAII
| Score | Price | 52 Week & Averages | Relative Strength | Risk | |||||
|---|---|---|---|---|---|---|---|---|---|
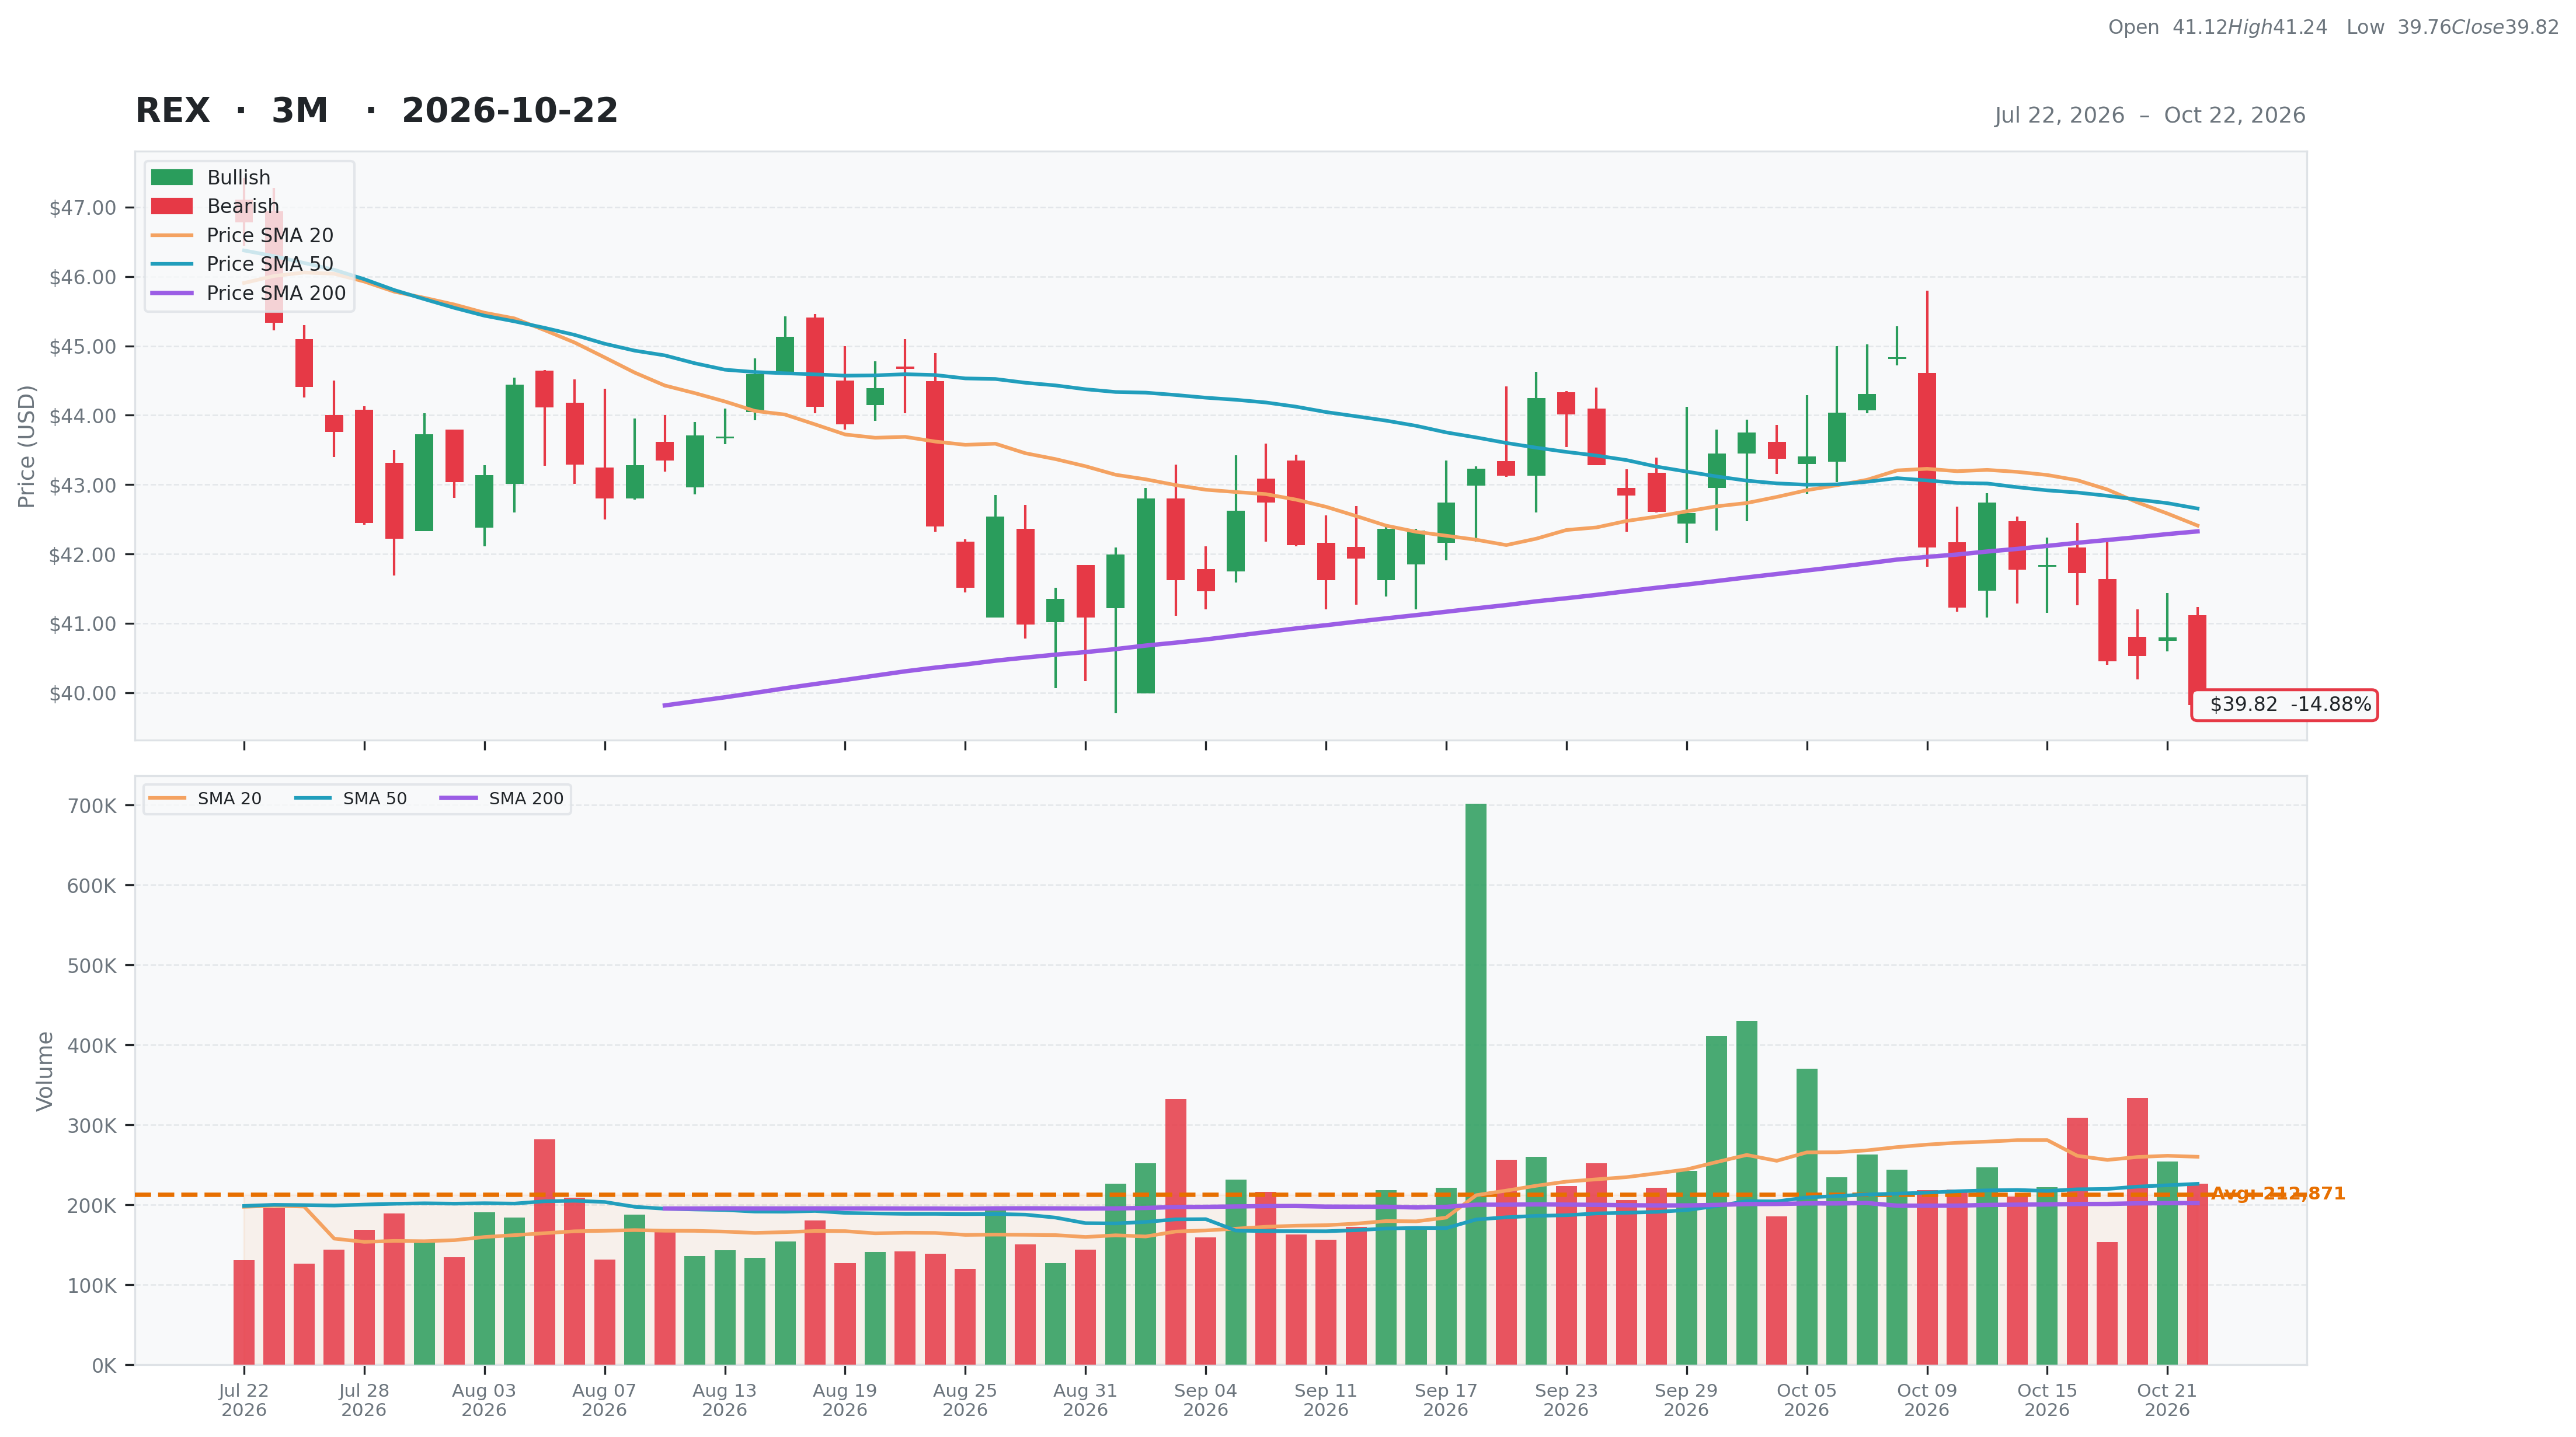
| Total | 61 | Current | $39.82 | 52W High | $51.16 -22.17% | Relative Strength | 0.01 | Beta | 0.60 |
| Business Quality | 14 | Weekly | $41.84 -4.83% | 52W Low | $31.69 25.65% | 3M | -0.10 | Short % | 0.03 |
| Financial Strength | 16 | Monthly | $44.25 -10.01% | Above 50DMA | $42.66 -6.65% | 6M | -0.14 | Risk Score | 4 |
| Growth Outlook | 11 | Quarterly | $44.41 -10.34% | Above 200DMA | $42.33 -5.92% | 9M | 0.15 | ||
| Momentum | 0 | Yearly | $31.79 25.26% | 12M | 0.24 | ||||
| Valuation | Financial Strength | Growth/Profitability | |||
|---|---|---|---|---|---|
| Trailing P/E | 11.43 | Cash | 380M | Revenue Growth | 0.06% |
| Forward P/E | 18.38 | Debt | 18M | Earnings Growth | 3.90% |
| PEG Ratio | 1.74 | Debt/Equity | 2.31 | Qtr Earnings Growth | 3.91% |
| Price/Sales | 2.10 | Current Ratio | 6.88 | Gross Margin | 0.18% |
| Price/Book | 2.05 | Quick Ratio | 6.19 | Operating Margin | 0.22% |
| EV/Revenue | 1.70 | Operating CF | 143M | Profit Margin | 0.18% |
| EV/EBITDA | 9.29 | Free CF | 48M | EBITDA Margin | 0.18% |
| Ent Value | 1,120M | Return on Assets | 0.08% | ||
| Return on Equity | 0.20% | ||||
| Technical | Volume & Bollinger Bands | Analyst | |||
|---|---|---|---|---|---|
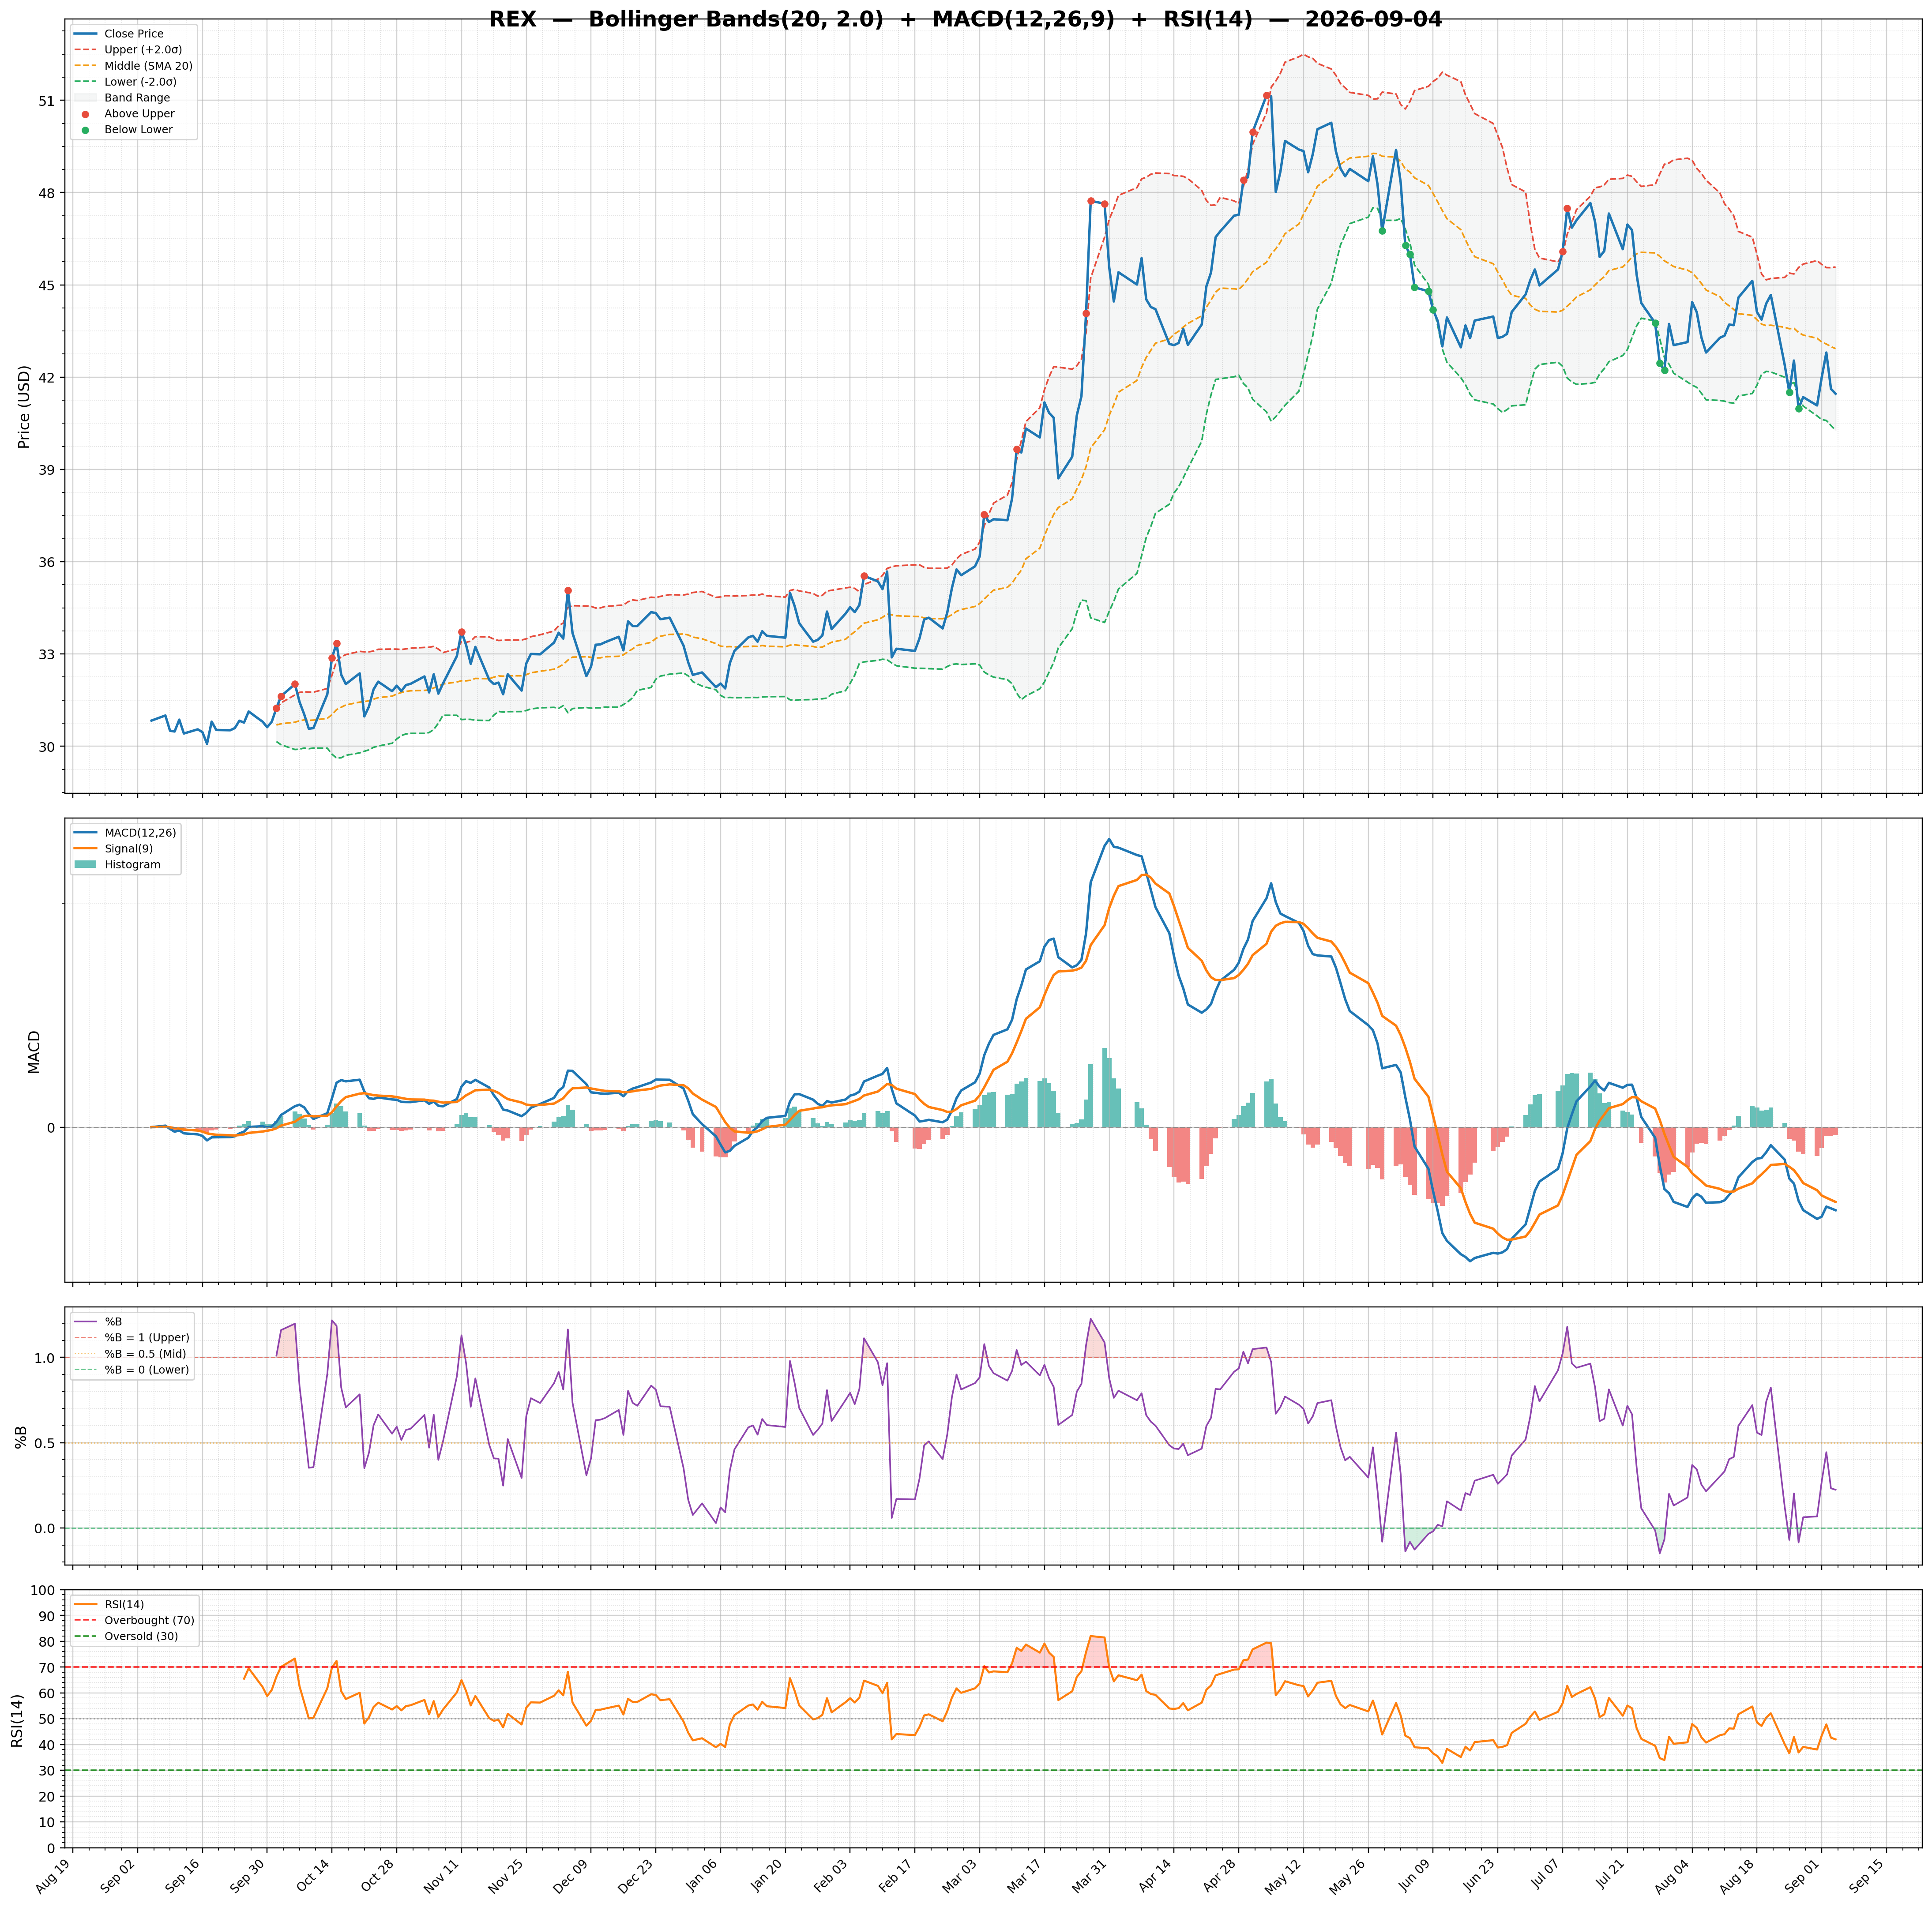
| RSI | 35.84 | Volume | 0.3M | Rating | none |
| Previous RSI | 40.22 | Avg Volume 20D | 0.26M | Target Mean | N/A |
| RSI Trend | Down | Relative Volume | 0.87 | Target High | N/A |
| MACD | -0.68 | Lower Band | 39.63 | Target Low | N/A |
| MACD Signal | -0.36 | Middle Band | 42.41 | Target Median | N/A |
| Histogram | -0.32 | Upper Band | 45.19 | Analysts | N/A |
| Previous Histogram | -0.29 | Bandwidth | 13.110 | Upside | N/A |
| Histogram Trend | Decreasing | %B | 0.03 | ||