Regis Corporation (RGS)
Consumer Cyclical • Personal Services • $29.5 • MCap: 72,504,552
https://www.regiscorp.com • Regis Corporation owns and franchises hair care salons primarily in North America. The company operates in two segments: Franchise Salons and Company-Owned Salons. Its salons provide haircutting; styling, including shampooing and conditioning; and hair coloring, as well as sell various hair care and other beauty products. It also offers business performance coaching, stylist training and education, site approval, marketing, loyalty and CRM programs, and technology support. The company operates its salons primarily under Supercuts, SmartStyle, Cost Cutters, First Choice Haircutters, Roosters, Hair Masters, Magicuts, Holiday Hair, and Regis concept names. Regis Corporation was founded in 1922 and is headquartered in Minneapolis, Minnesota.
AAII
| Score | Price | 52 Week & Averages | Relative Strength | Risk | |||||
|---|---|---|---|---|---|---|---|---|---|
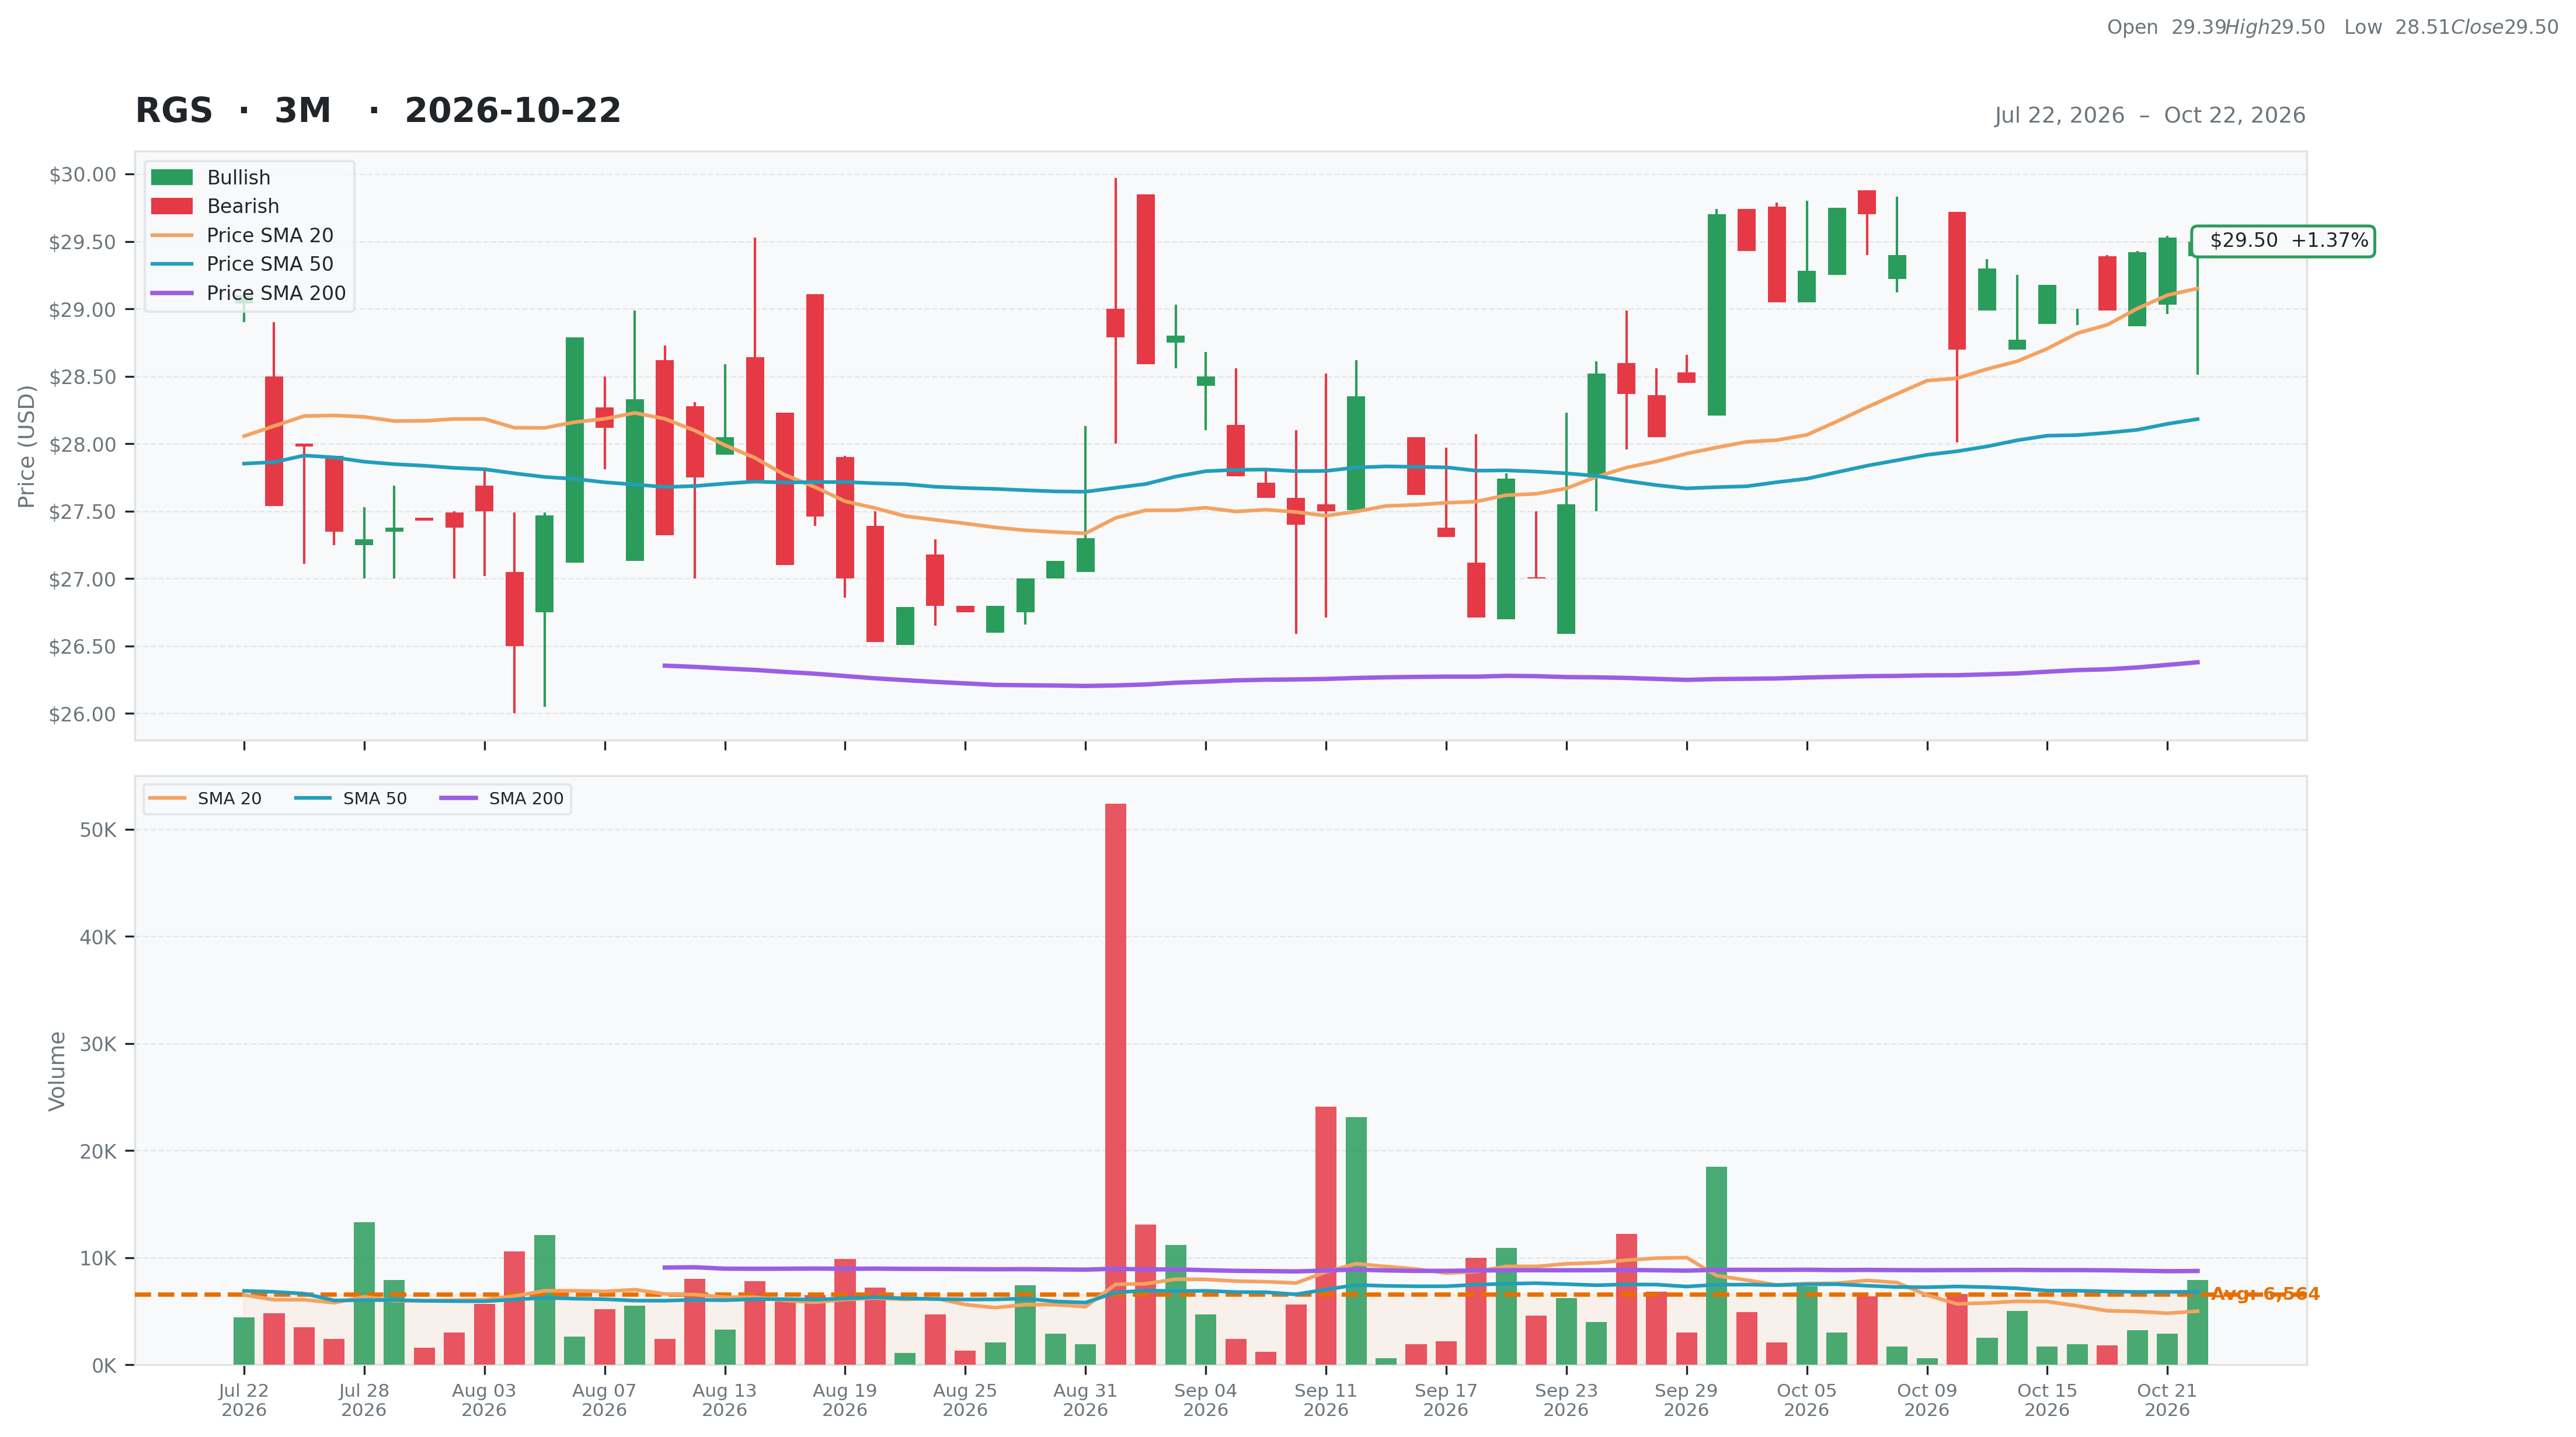
| Total | 43 | Current | $29.50 | 52W High | $30.46 -3.15% | Relative Strength | 0.07 | Beta | 1.26 |
| Business Quality | 12 | Weekly | $29.18 1.10% | 52W Low | $19.47 51.52% | 3M | 0.05 | Short % | 0.02 |
| Financial Strength | 3 | Monthly | $27.00 9.26% | Above 50DMA | $28.18 4.67% | 6M | 0.09 | Risk Score | 3 |
| Growth Outlook | 4 | Quarterly | $27.98 5.43% | Above 200DMA | $26.38 11.83% | 9M | 0.19 | ||
| Momentum | 6 | Yearly | $29.85 -1.17% | 12M | -0.03 | ||||
| Valuation | Financial Strength | Growth/Profitability | |||
|---|---|---|---|---|---|
| Trailing P/E | 11.74 | Cash | 26M | Revenue Growth | -0.07% |
| Forward P/E | 9.09 | Debt | 301M | Earnings Growth | -0.96% |
| PEG Ratio | 8.69 | Debt/Equity | 155.52 | Qtr Earnings Growth | -0.96% |
| Price/Sales | 0.32 | Current Ratio | 0.62 | Gross Margin | 0.37% |
| Price/Book | 0.37 | Quick Ratio | 0.38 | Operating Margin | 0.12% |
| EV/Revenue | 1.55 | Operating CF | 13M | Profit Margin | 0.03% |
| EV/EBITDA | 12.27 | Free CF | 6M | EBITDA Margin | 0.13% |
| Ent Value | 348M | Return on Assets | 0.03% | ||
| Return on Equity | 0.04% | ||||
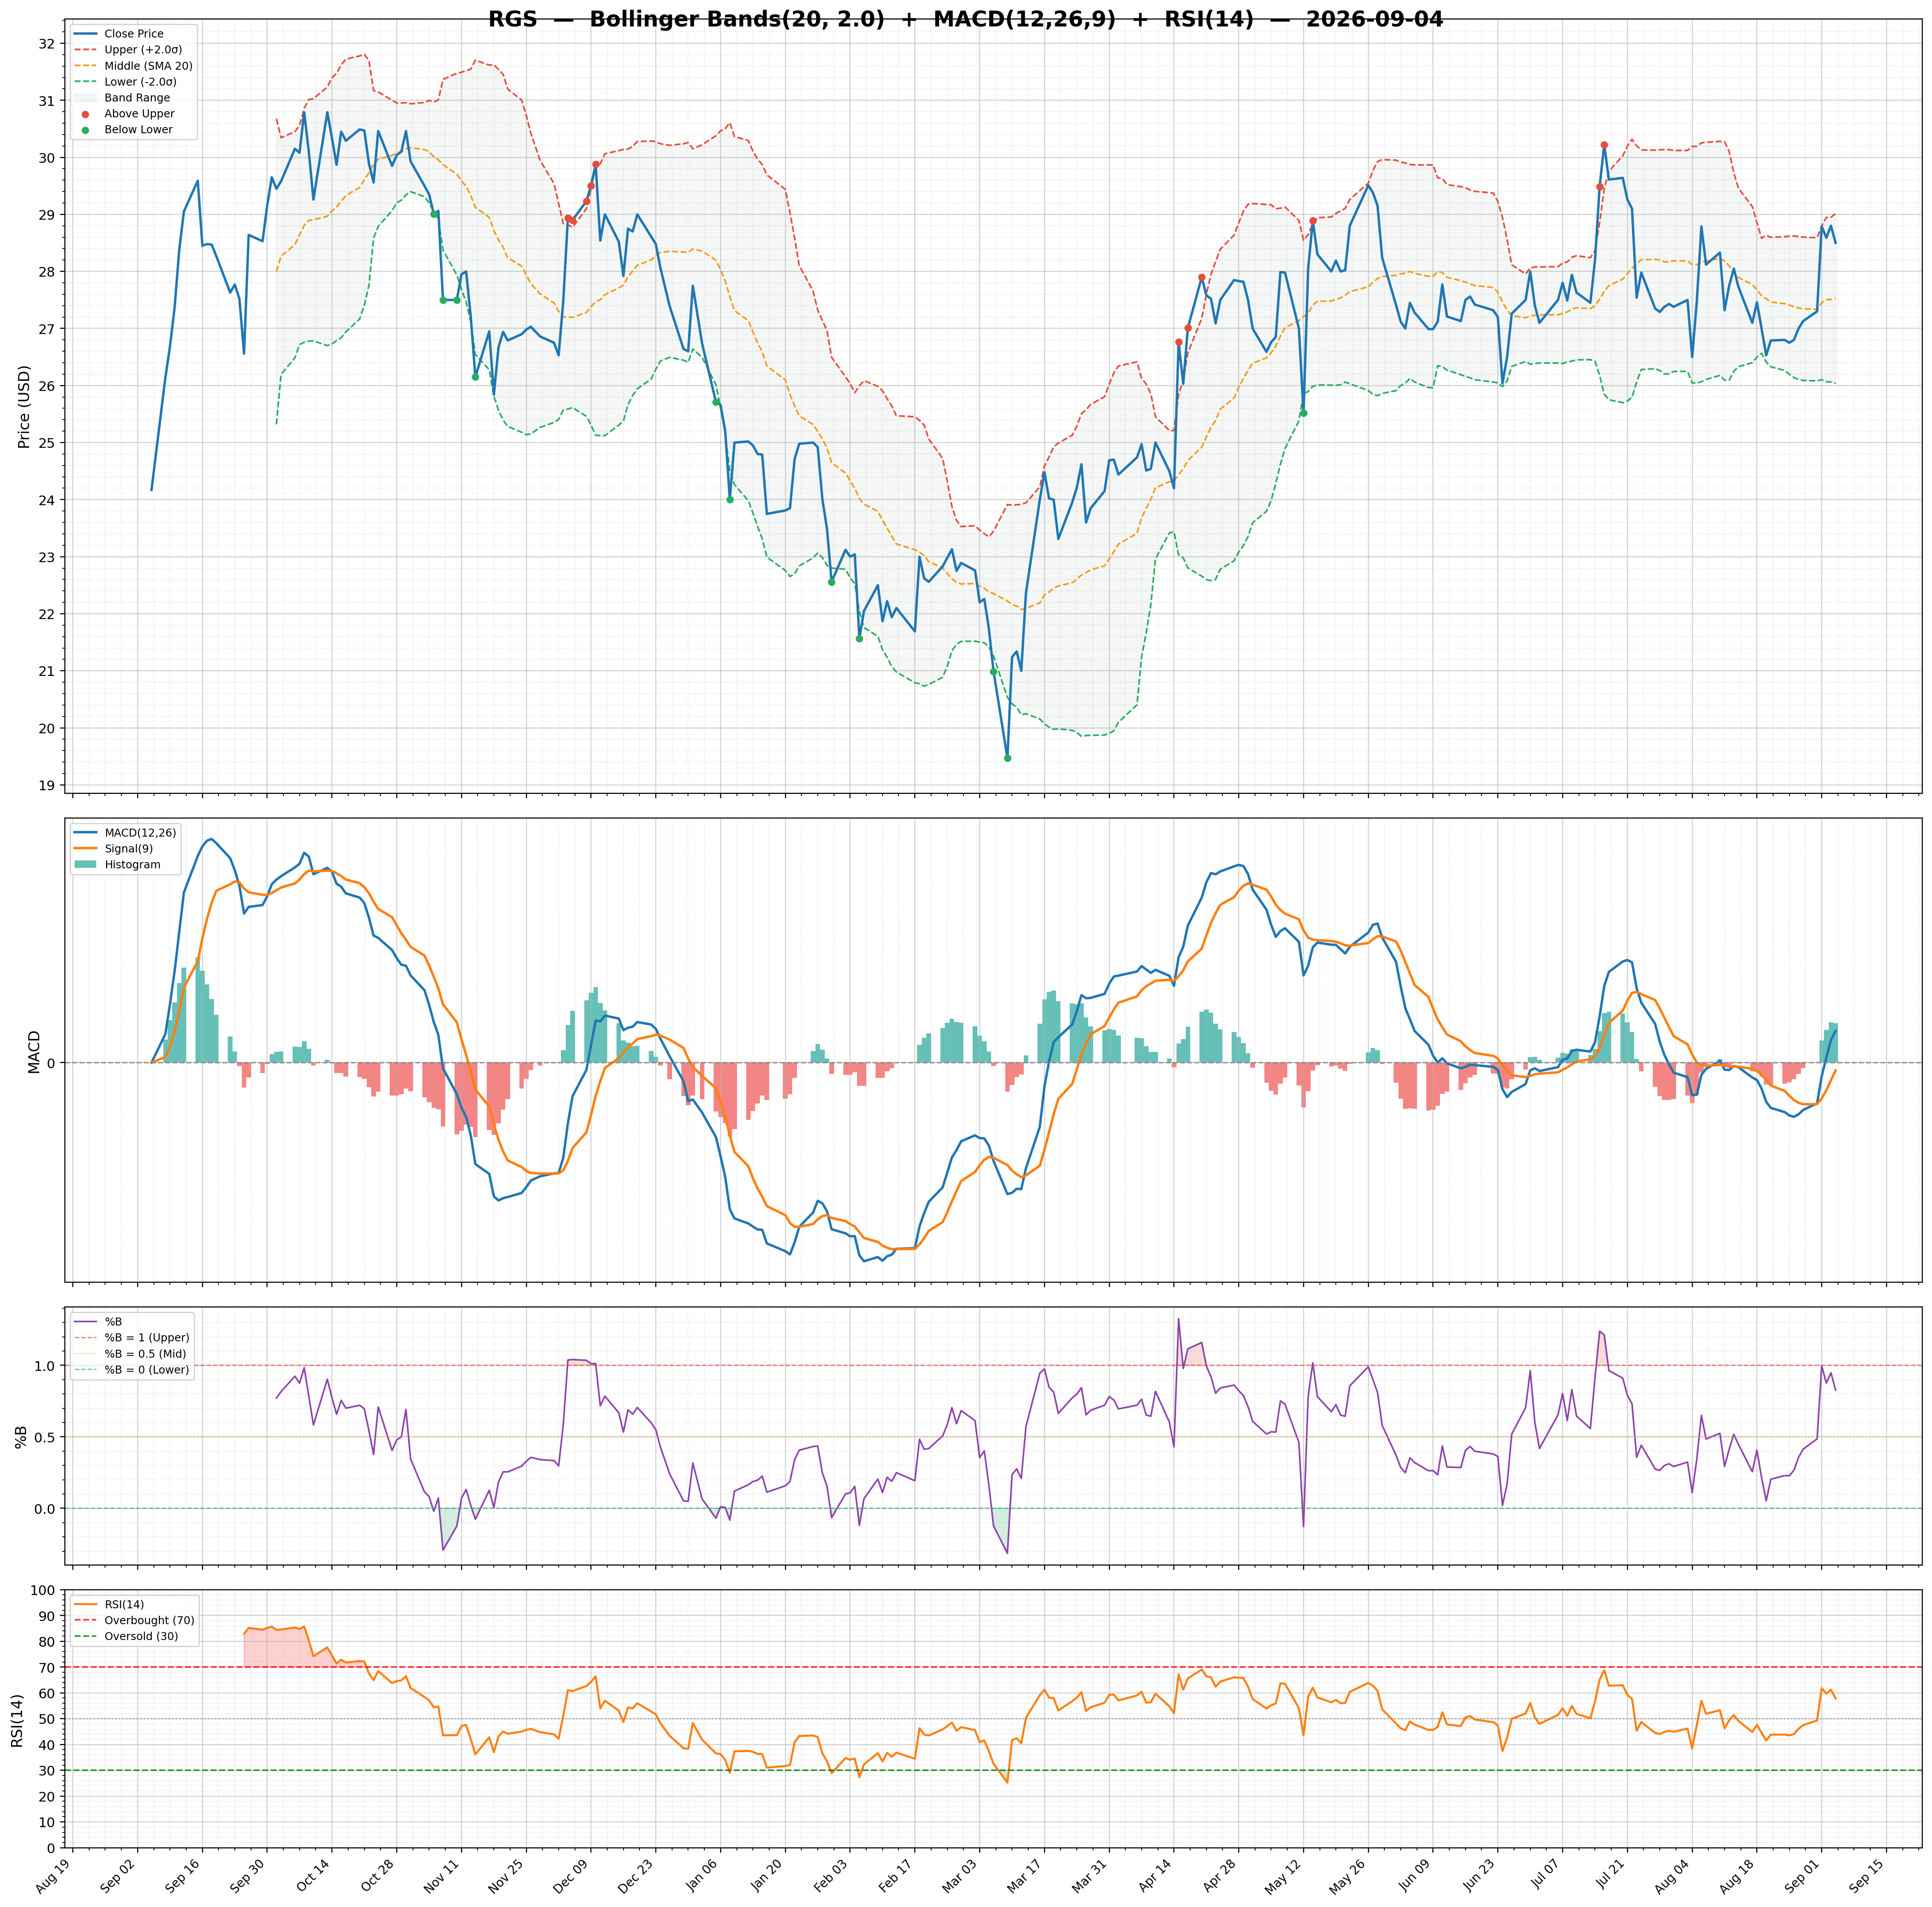
| Technical | Volume & Bollinger Bands | Analyst | |||
|---|---|---|---|---|---|
| RSI | 56.97 | Volume | 0M | Rating | none |
| Previous RSI | 57.31 | Avg Volume 20D | 0.01M | Target Mean | $42.00 |
| RSI Trend | Down | Relative Volume | 1.26 | Target High | $42.00 |
| MACD | 0.33 | Lower Band | 28.20 | Target Low | $42.00 |
| MACD Signal | 0.34 | Middle Band | 29.15 | Target Median | $42.00 |
| Histogram | -0.02 | Upper Band | 30.10 | Analysts | 1 |
| Previous Histogram | -0.02 | Bandwidth | 6.520 | Upside | 44.83% |
| Histogram Trend | Increasing | %B | 0.68 | ||