RCI Hospitality Holdings, Inc. (RICK)
Consumer Cyclical • Restaurants • $26.99 • MCap: 196,234,320
https://www.rcihospitality.com • RCI Hospitality Holdings, Inc., through its subsidiaries, engages in the hospitality and related businesses in the United States. The company operates through Nightclubs, Bombshells, and Other segments. It owns and/or operates upscale adult nightclubs under the Rick's Cabaret, Jaguars Club, Tootsie's Cabaret, XTC Cabaret, Club Onyx, Hoops Cabaret and Sports Bar, Scarlett's Cabaret, Diamond Cabaret, Cheetah Gentlemen's Club, PT's Showclub, Playmates Club, Country Rock Cabaret, Temptations Adult Cabaret, Foxy's Cabaret, Vivid Cabaret, Downtown Cabaret, Cabaret East, The Seville, Silver City Cabaret, Heartbreakers Gentlemen's Club, Kappa Men's Club, Baby Dolls, and Chicas Locas brands; and a dance club under the Studio 80 brand. The company also owns and operates restaurants and sports bars under the Bombshells Restaurant & Bar brand. In addition, it owns national industry conventions and trade shows; national industry trade publications; and national industry award shows, as well as industry and social media websites, which serves adult nightclubs industry and the adult retail products industry. Further, it holds license to sell Robust Energy Drink in the United States. The company was formerly known as Rick's Cabaret International, Inc. and changed its name to RCI Hospitality Holdings, Inc. in August 2014. RCI Hospitality Holdings, Inc. was founded in 1983 and is headquartered in Houston, Texas.
Ex-AAII
Joie
| Score | Price | 52 Week & Averages | Relative Strength | Risk | |||||
|---|---|---|---|---|---|---|---|---|---|
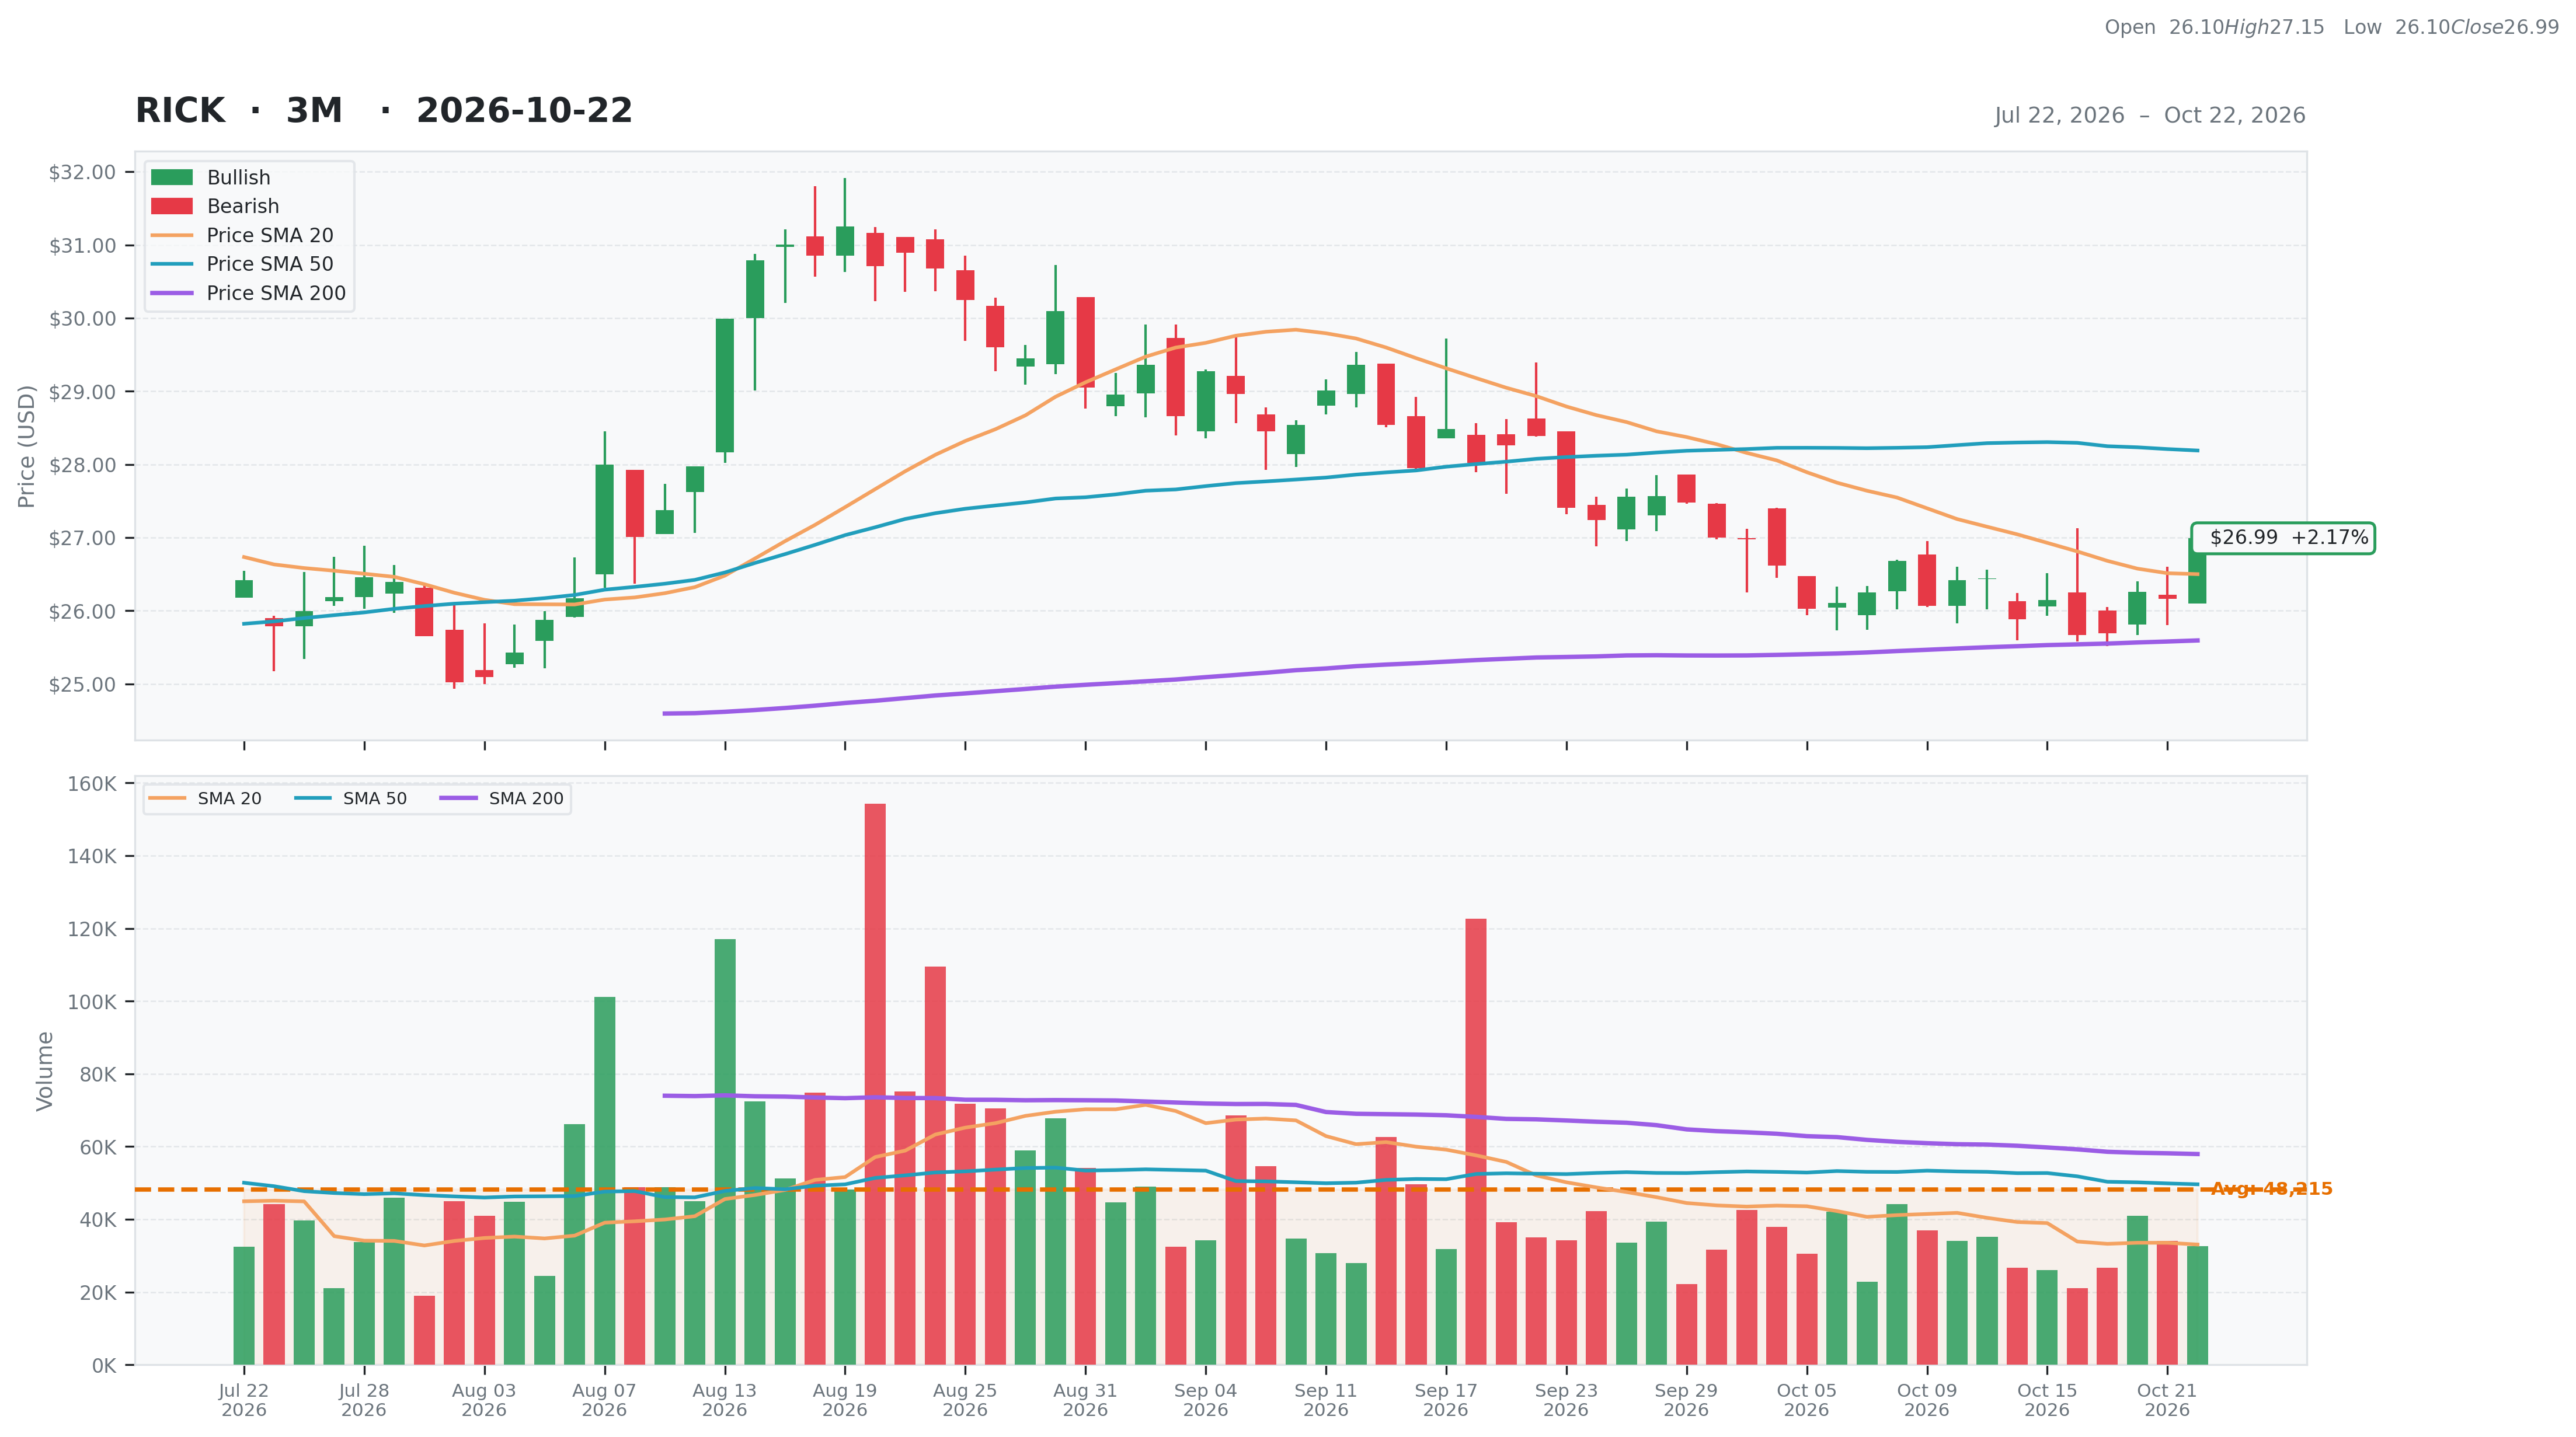
| Total | 60 | Current | $26.99 | 52W High | $31.25 -13.65% | Relative Strength | 0.05 | Beta | 0.85 |
| Business Quality | 15 | Weekly | $26.15 3.21% | 52W Low | $20.70 30.37% | 3M | 0.04 | Short % | 0.11 |
| Financial Strength | 5 | Monthly | $28.39 -4.93% | Above 50DMA | $28.19 -4.26% | 6M | 0.06 | Risk Score | 10 |
| Growth Outlook | 11 | Quarterly | $26.00 3.81% | Above 200DMA | $25.59 5.45% | 9M | 0.09 | ||
| Momentum | 2 | Yearly | $25.98 3.90% | 12M | 0.03 | ||||
| Valuation | Financial Strength | Growth/Profitability | |||
|---|---|---|---|---|---|
| Trailing P/E | N/A | Cash | 26M | Revenue Growth | 0.04% |
| Forward P/E | 6.14 | Debt | 268M | Earnings Growth | 0.80% |
| PEG Ratio | 0.71 | Debt/Equity | 113.02 | Qtr Earnings Growth | 0.56% |
| Price/Sales | 0.69 | Current Ratio | 0.56 | Gross Margin | 0.85% |
| Price/Book | 0.84 | Quick Ratio | 0.42 | Operating Margin | 0.18% |
| EV/Revenue | 1.55 | Operating CF | 43M | Profit Margin | -0.01% |
| EV/EBITDA | 7.98 | Free CF | 36M | EBITDA Margin | 0.19% |
| Ent Value | 441M | Return on Assets | 0.04% | ||
| Return on Equity | -0.02% | ||||
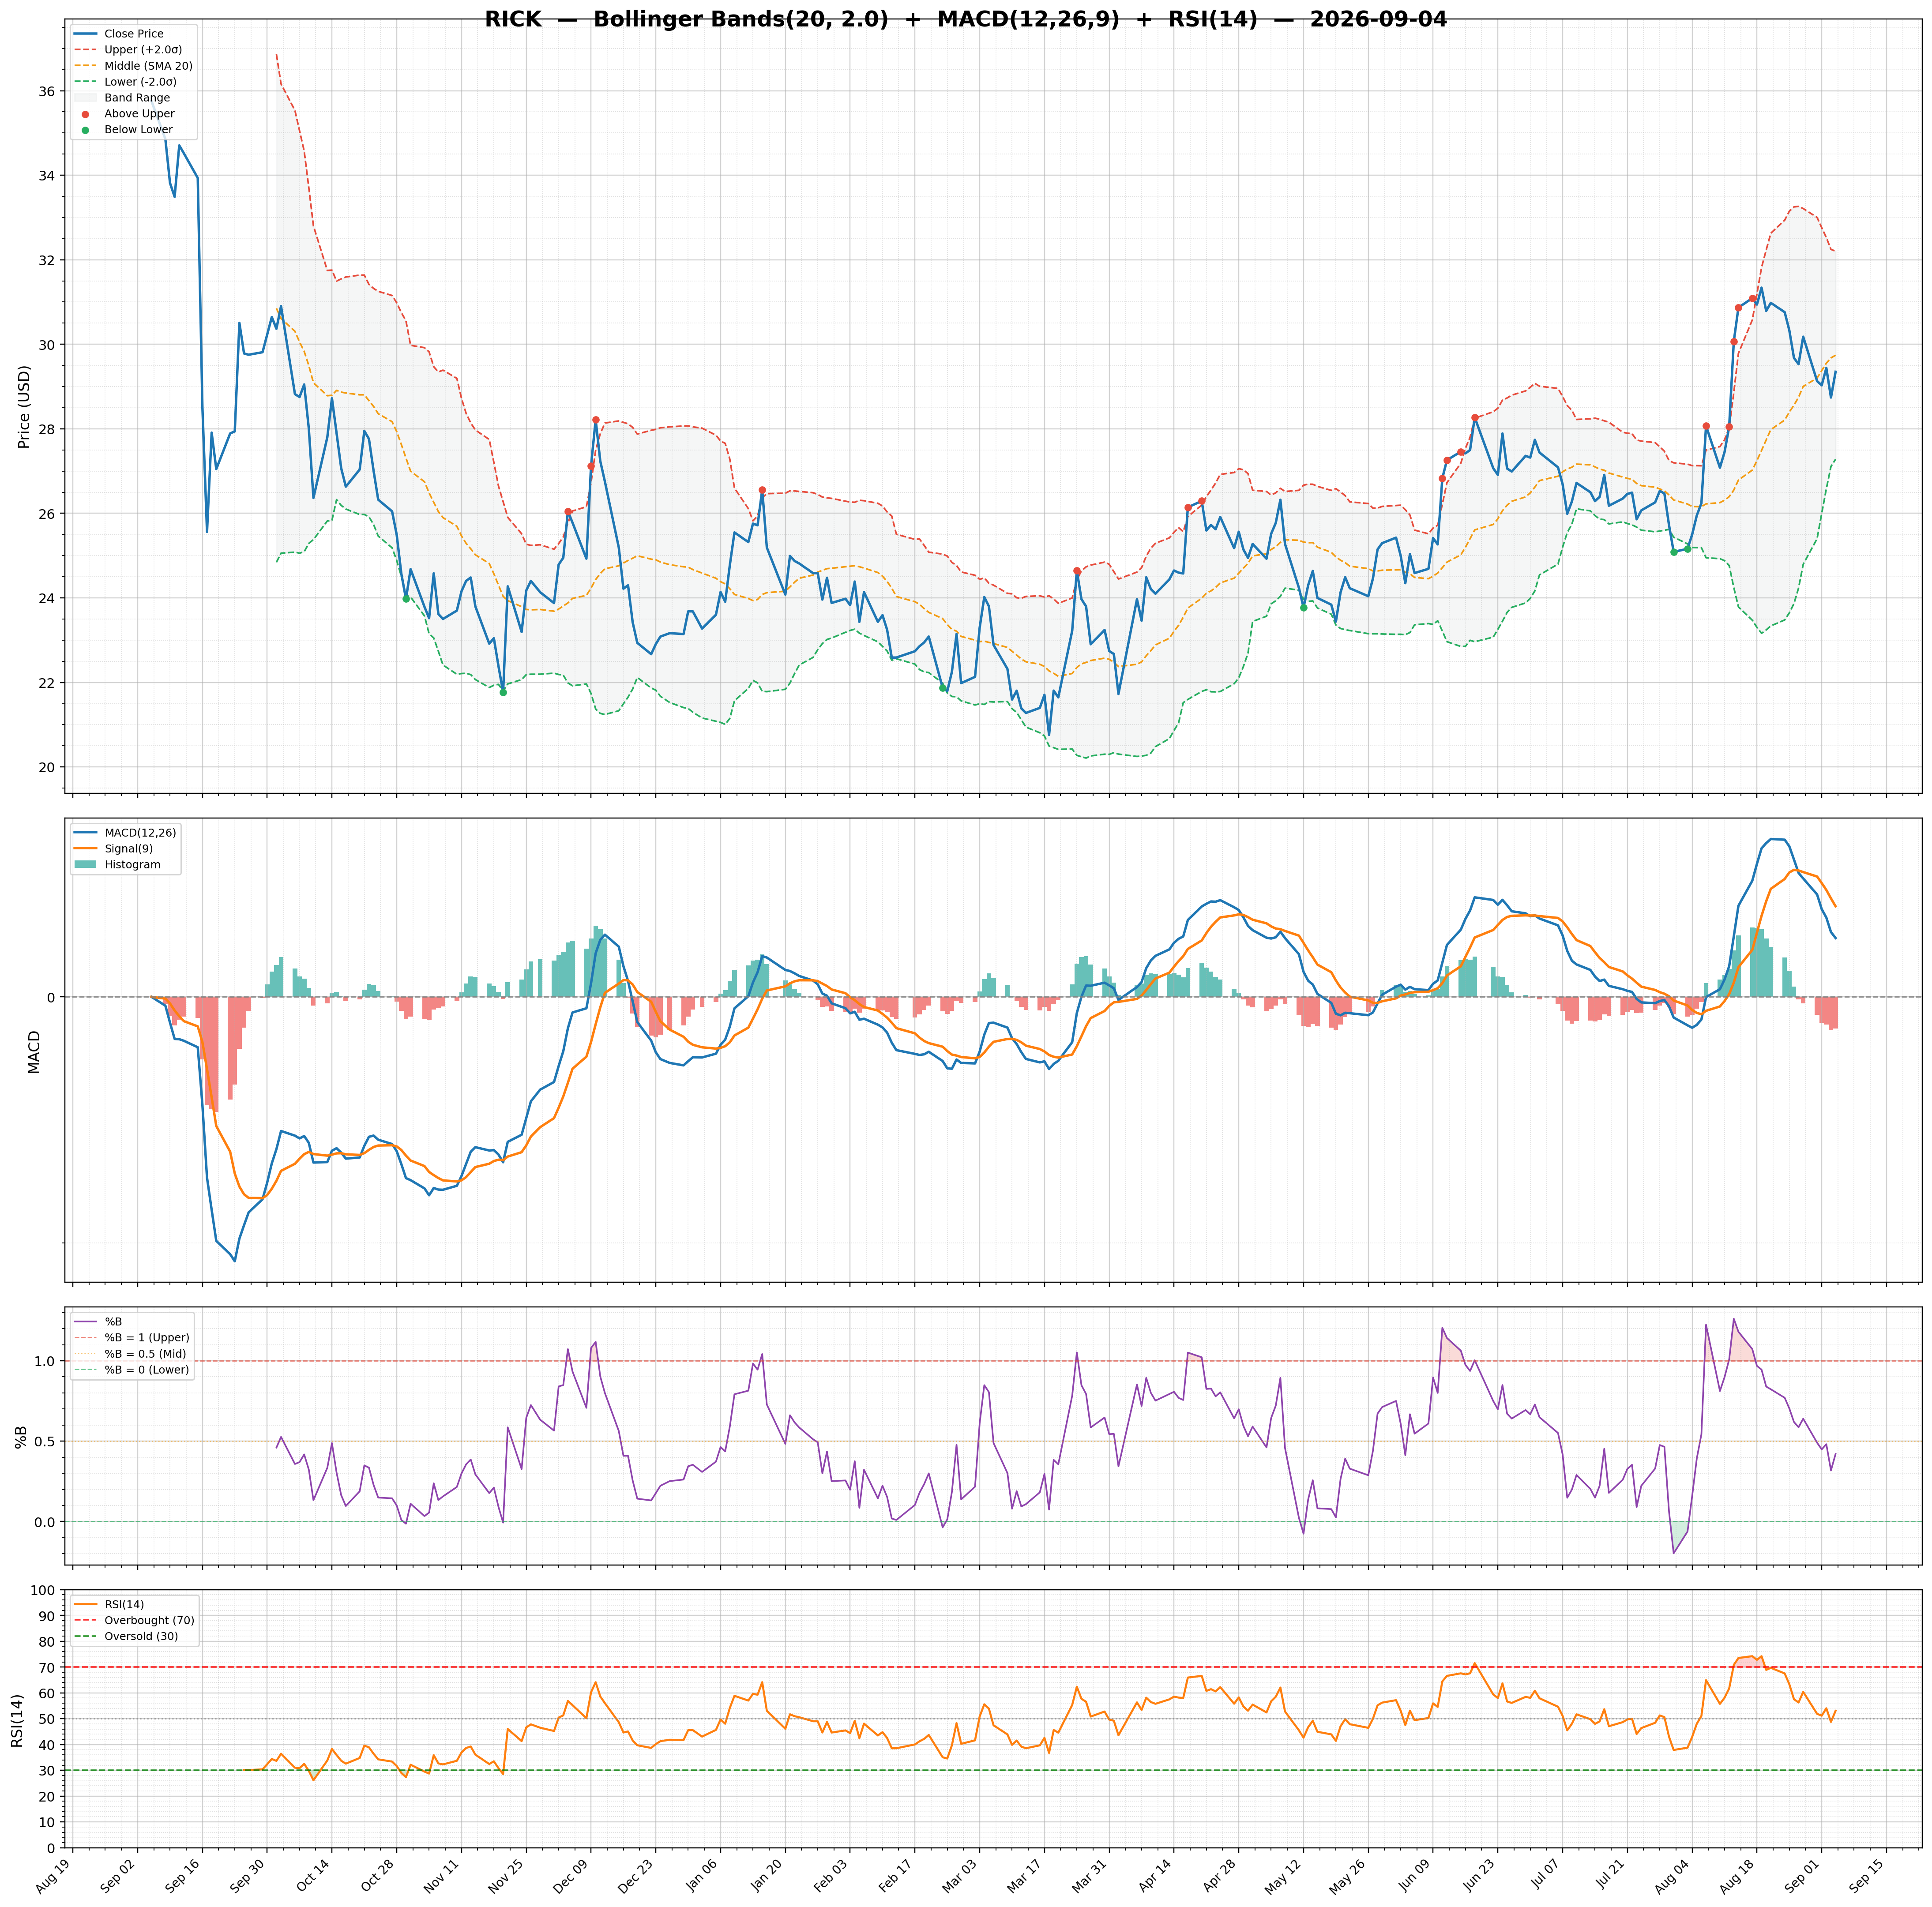
| Technical | Volume & Bollinger Bands | Analyst | |||
|---|---|---|---|---|---|
| RSI | 51.48 | Volume | 0.02M | Rating | none |
| Previous RSI | 42.37 | Avg Volume 20D | 0.03M | Target Mean | N/A |
| RSI Trend | Up | Relative Volume | 0.86 | Target High | N/A |
| MACD | -0.45 | Lower Band | 25.32 | Target Low | N/A |
| MACD Signal | -0.56 | Middle Band | 26.50 | Target Median | N/A |
| Histogram | 0.10 | Upper Band | 27.68 | Analysts | N/A |
| Previous Histogram | 0.03 | Bandwidth | 8.930 | Upside | N/A |
| Histogram Trend | Increasing | %B | 0.71 | ||