Gibraltar Industries, Inc. (ROCK)
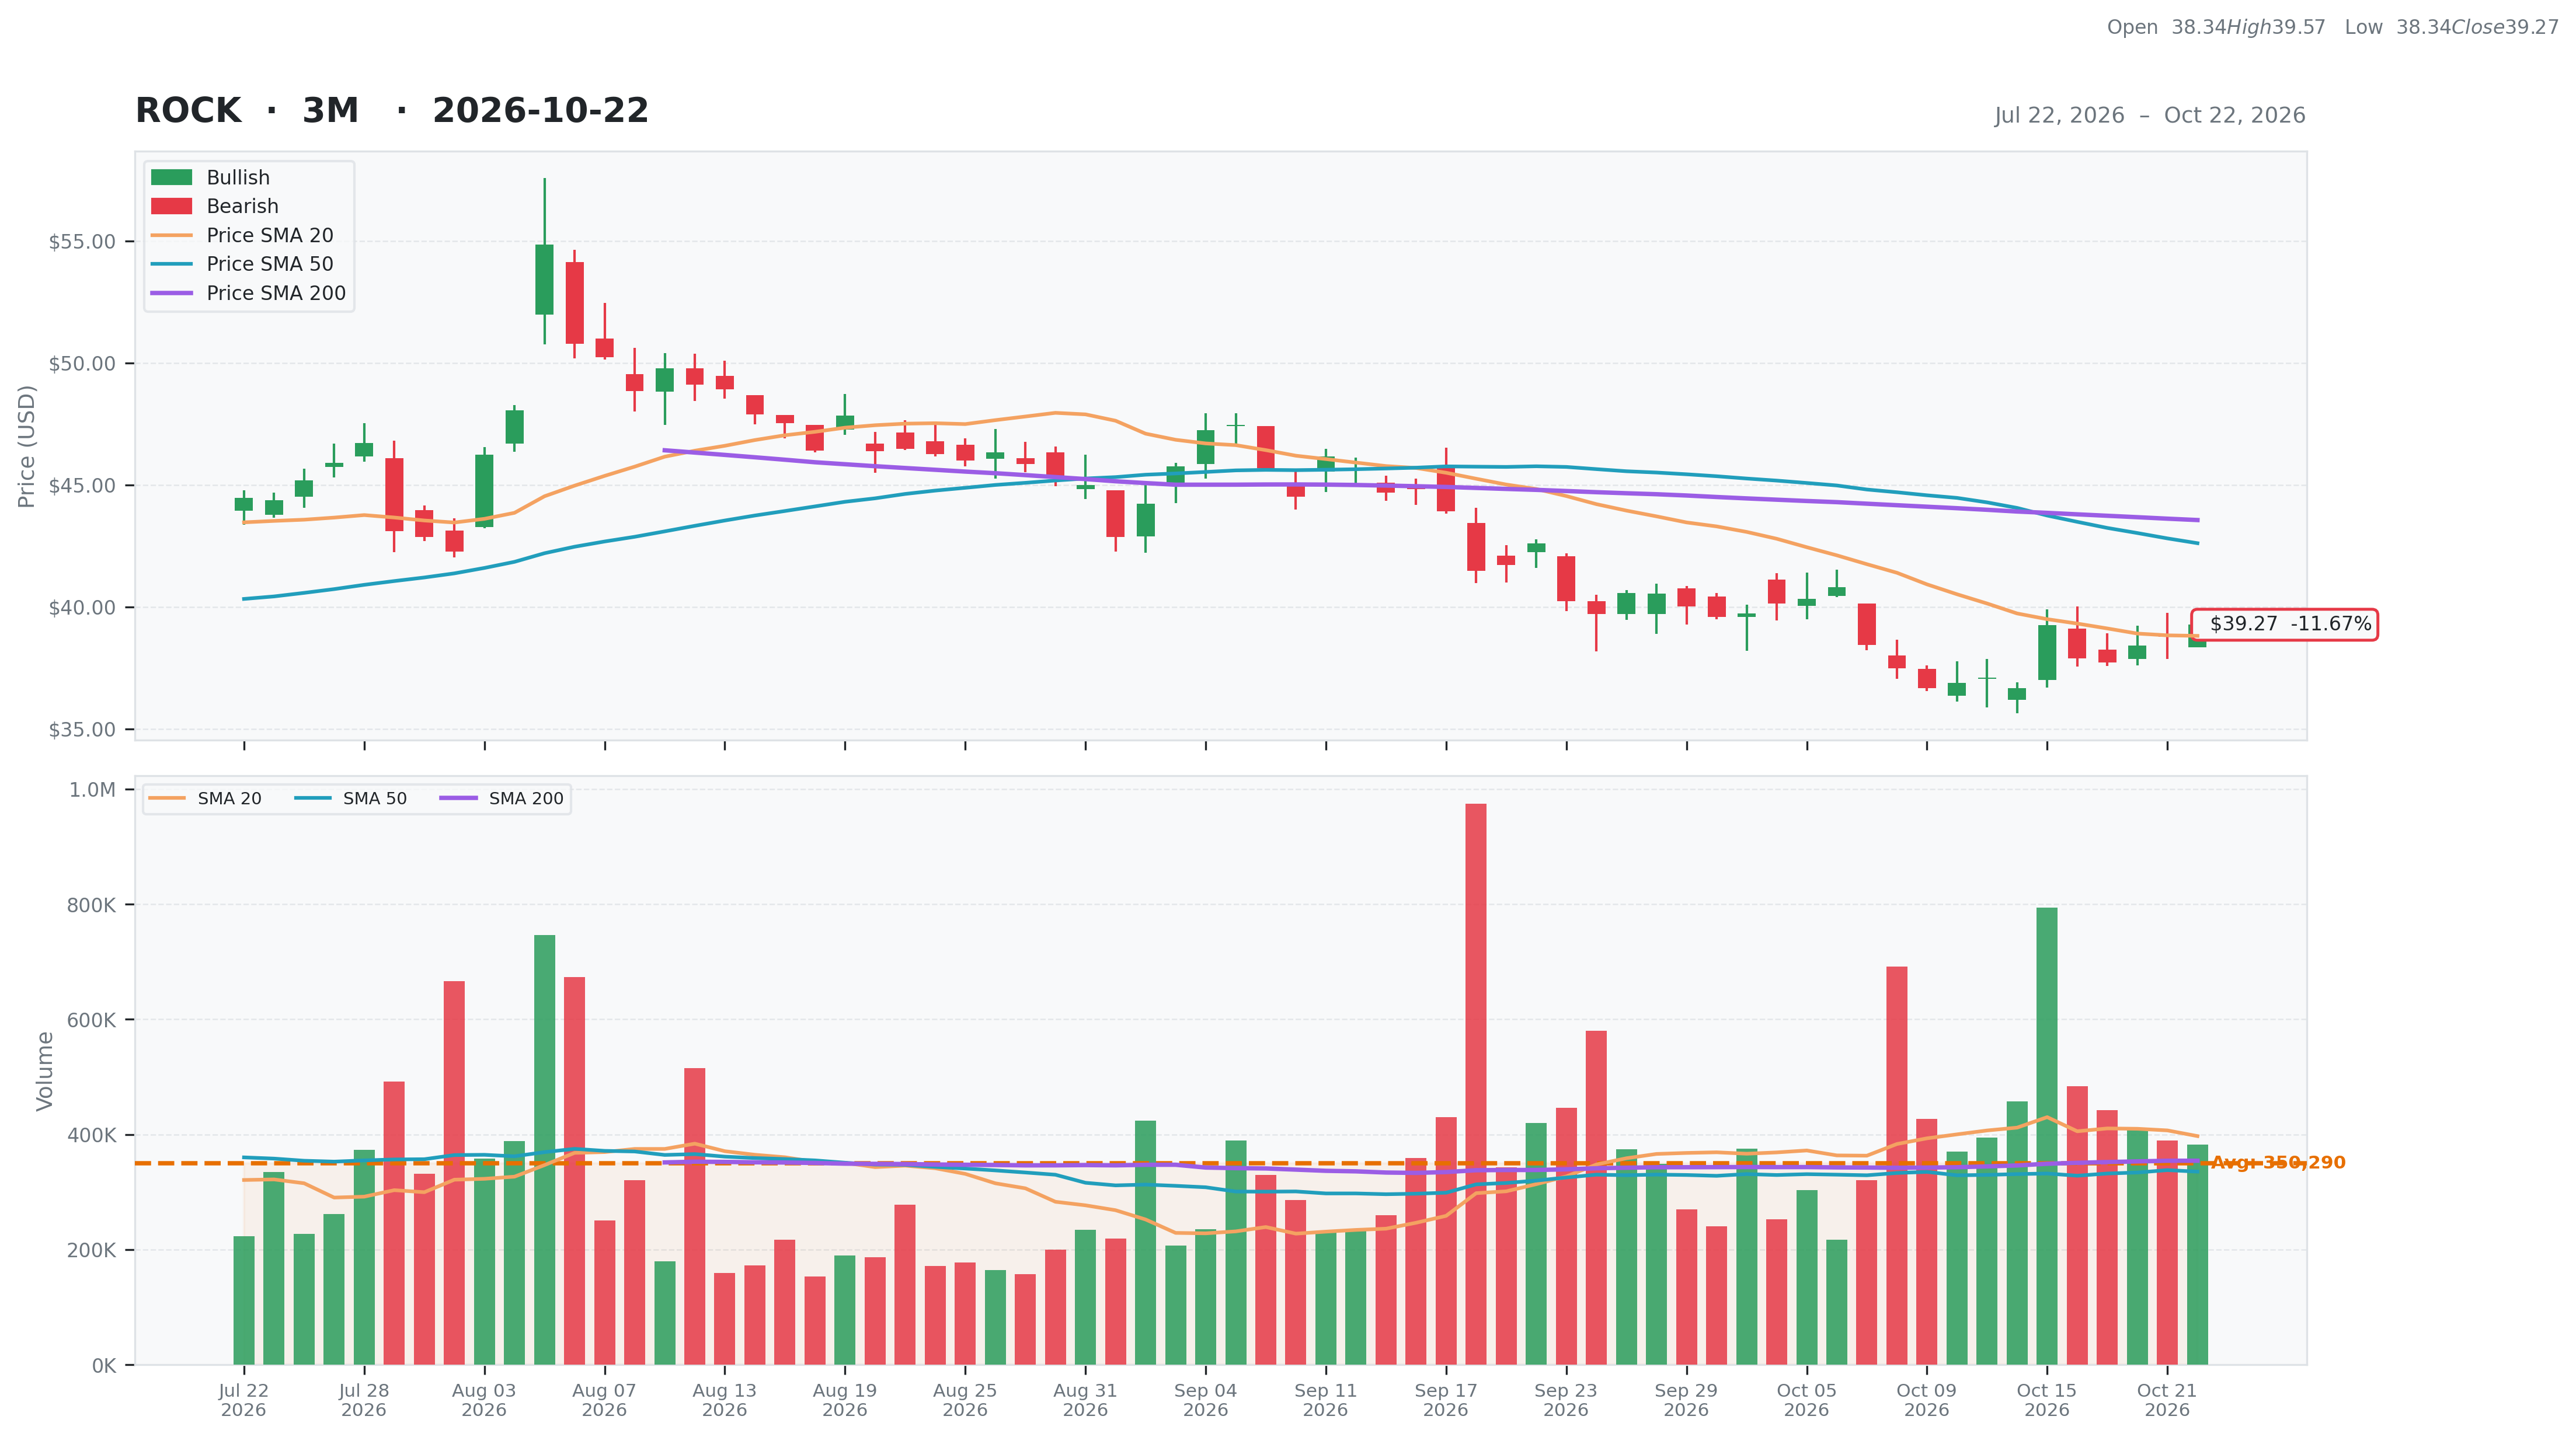
Industrials • Building Products & Equipment • $39.27 • MCap: 1,123,890,176
https://www.gibraltar1.com • Gibraltar Industries, Inc. manufactures and provides products and services for the residential, agtech, and infrastructure markets in the United States and internationally. The company operates through three segments: Residential, Agtech, and Infrastructure. The Residential segment offers roof and foundation ventilation products; mail systems and package solutions, including single mailboxes, and cluster style mail, and parcel boxes for single and multi-family housing; roof edgings and flashings; soffits and trim; drywall corner beads; metal roofing and accessories; rain dispersion products comprising gutters, downspouts and accessories; and exterior retractable awnings. The Agtech segment offers controlled environmental agriculture, and custom greenhouse solutions and structural canopies, including the designing, engineering, manufacturing, construction of the structure, and integration of subsystems for retail, fruits and vegetables, flowers, commercial, institutional and conservatories, and car wash structure applications. The Infrastructure segment offers expansion joints, structural bearings, rubber pre-formed seals and other sealants, elastomeric concrete, and bridge cable protection systems. The company serves home improvement retailers, wholesalers, distributors, and contractors, as well as institutional and commercial growers of fruit, vegetables, flowers, and plants. The company was founded in 1972 and is headquartered in Buffalo, New York.
Google_BUY_Rating
Notes
10/22/2026
Keep an eye.. Looking like a good buy
| Score | Price | 52 Week & Averages | Relative Strength | Risk | |||||
|---|---|---|---|---|---|---|---|---|---|
| Total | 48 | Current | $39.27 | 52W High | $68.16 -42.39% | Relative Strength | -0.19 | Beta | 1.24 |
| Business Quality | 9 | Weekly | $39.25 0.05% | 52W Low | $33.82 16.11% | 3M | -0.13 | Short % | 0.12 |
| Financial Strength | 11 | Monthly | $42.60 -7.82% | Above 50DMA | $42.61 -7.84% | 6M | -0.02 | Risk Score | 2 |
| Growth Outlook | 4 | Quarterly | $45.19 -13.10% | Above 200DMA | $43.56 -9.85% | 9M | -0.23 | ||
| Momentum | 2 | Yearly | $67.31 -41.66% | 12M | -0.42 | ||||
| Valuation | Financial Strength | Growth/Profitability | |||
|---|---|---|---|---|---|
| Trailing P/E | 18.76 | Cash | 15M | Revenue Growth | 0.65% |
| Forward P/E | 7.88 | Debt | 1,369M | Earnings Growth | -0.69% |
| PEG Ratio | 0.53 | Debt/Equity | 153.72 | Qtr Earnings Growth | -0.68% |
| Price/Sales | 0.78 | Current Ratio | 1.46 | Gross Margin | 0.25% |
| Price/Book | 1.26 | Quick Ratio | 0.61 | Operating Margin | 0.12% |
| EV/Revenue | 1.72 | Operating CF | 71M | Profit Margin | -0.10% |
| EV/EBITDA | 12.31 | Free CF | 308M | EBITDA Margin | 0.14% |
| Ent Value | 2,480M | Return on Assets | 0.04% | ||
| Return on Equity | 0.06% | ||||
| Technical | Volume & Bollinger Bands | Analyst | |||
|---|---|---|---|---|---|
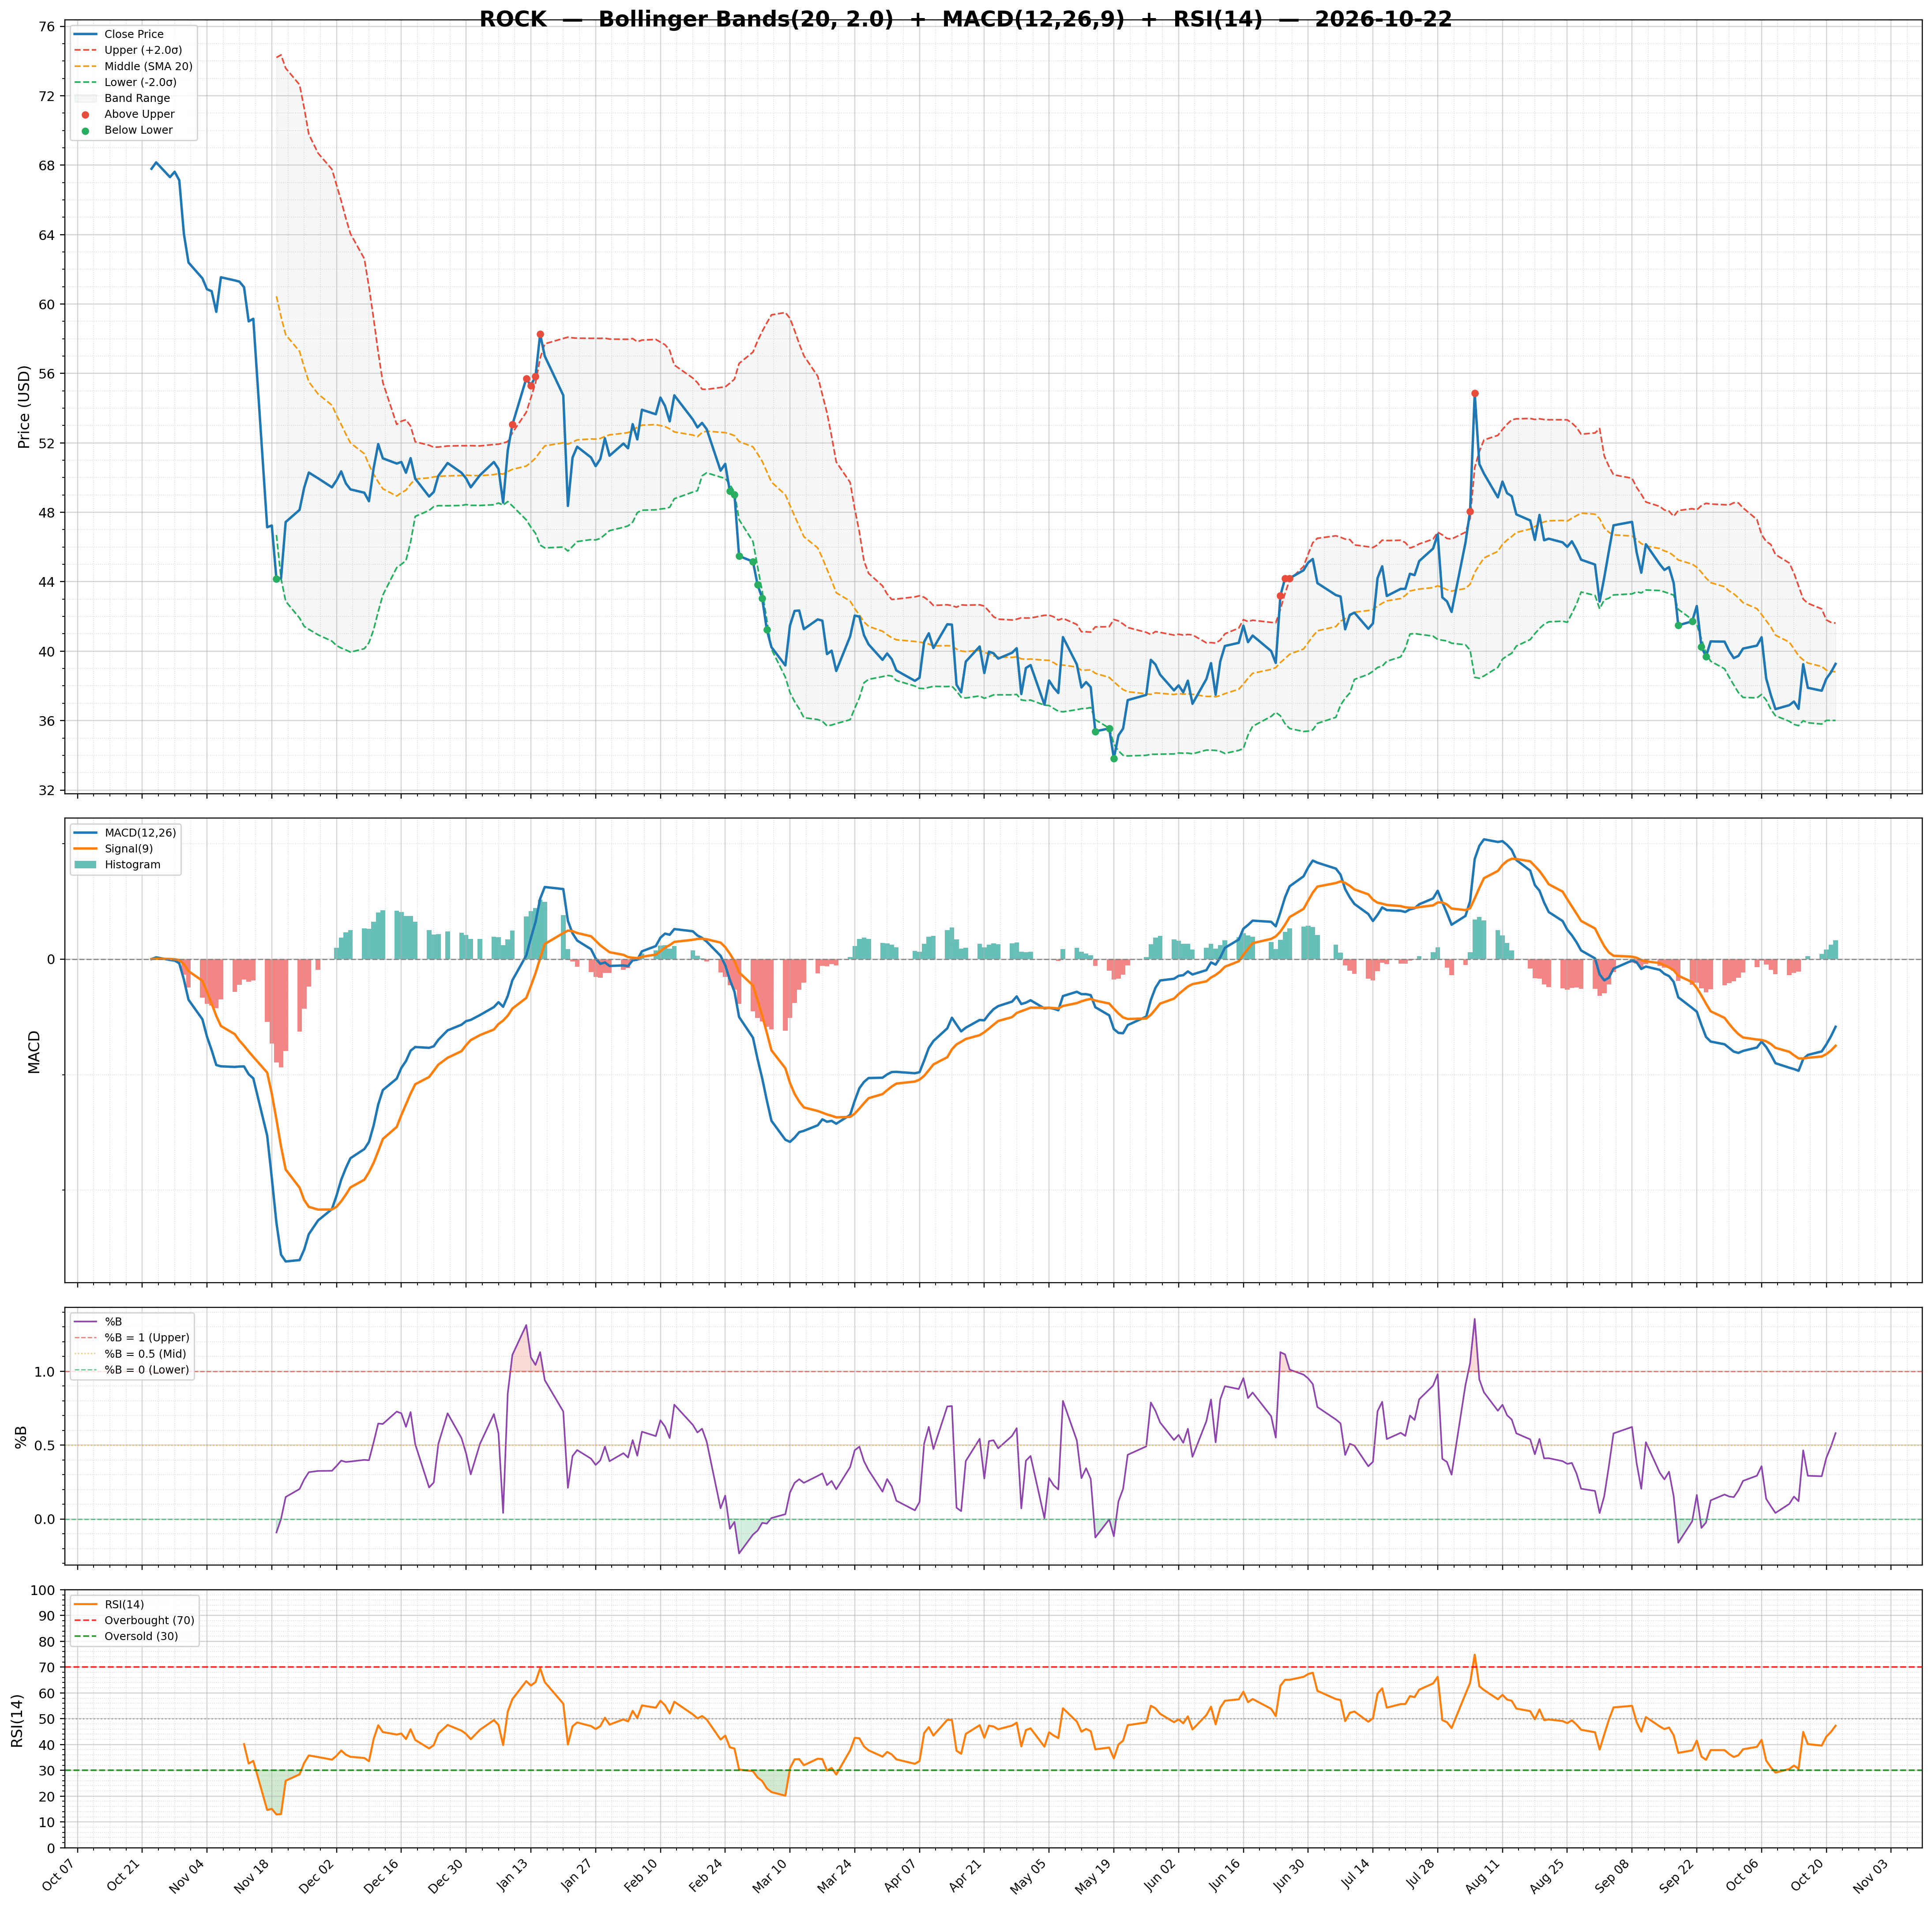
| RSI | 47.31 | Volume | 0.48M | Rating | strong_buy |
| Previous RSI | 44.90 | Avg Volume 20D | 0.4M | Target Mean | $75.25 |
| RSI Trend | Up | Relative Volume | 0.94 | Target High | $86.00 |
| MACD | -1.17 | Lower Band | 36.01 | Target Low | $55.00 |
| MACD Signal | -1.50 | Middle Band | 38.81 | Target Median | $80.00 |
| Histogram | 0.33 | Upper Band | 41.62 | Analysts | 4 |
| Previous Histogram | 0.25 | Bandwidth | 14.440 | Upside | 98.60% |
| Histogram Trend | Increasing | %B | 0.58 | ||