Roadrunner Transportation Syste (RRTS)
Industrials • Trucking • $2.52 • MCap: 97,733,048
https://www.shiproadrunnerfreight.com • Roadrunner Transportation Systems, Inc. provides asset-right transportation and asset-light logistics services. It operates through four segments: Ascent Transportation Management (Ascent TM), Ascent On-Demand (Ascent OD), Less-than-Truckload (LTL), and Truckload (TL). The company offers domestic freight management solutions, including asset-backed truckload brokerage, specialized/heavy haul, LTL shipment execution, LTL carrier rate negotiations, access to its transportation management system, and freight audit/payment. It also provides air and ground expedite services for the transportation of automotive and industrial parts, paper products, and steel, as well as frozen and refrigerated foods, including dairy, poultry and meat, and consumers products, such as foods and beverages. In addition, the company arranges the pickup and delivery of TL freight through its 30 TL service centers in the United States; offers dry van truckload, temperature-controlled truckload, and logistics and warehouse services; and provides pickup, consolidation, linehaul, deconsolidation, and delivery of LTL shipments in the United States and Canada through 27 LTL service centers and approximately 140 third-party delivery agents. Further, the company provides international air and ocean freight forwarding, customs brokerage, regulatory compliance, project and order management, and retail consolidation services. It operates through a network of independent brokerage agents, direct sales force, company brokers, and commissioned sales representatives. The company offers its services under the Roadrunner and Ascent Global Logistics brands. Roadrunner Transportation Systems, Inc. was incorporated in 2005 and is headquartered in Downers Grove, Illinois.
Ex-AAII
| Score | Price | 52 Week & Averages | Relative Strength | Risk | |||||
|---|---|---|---|---|---|---|---|---|---|
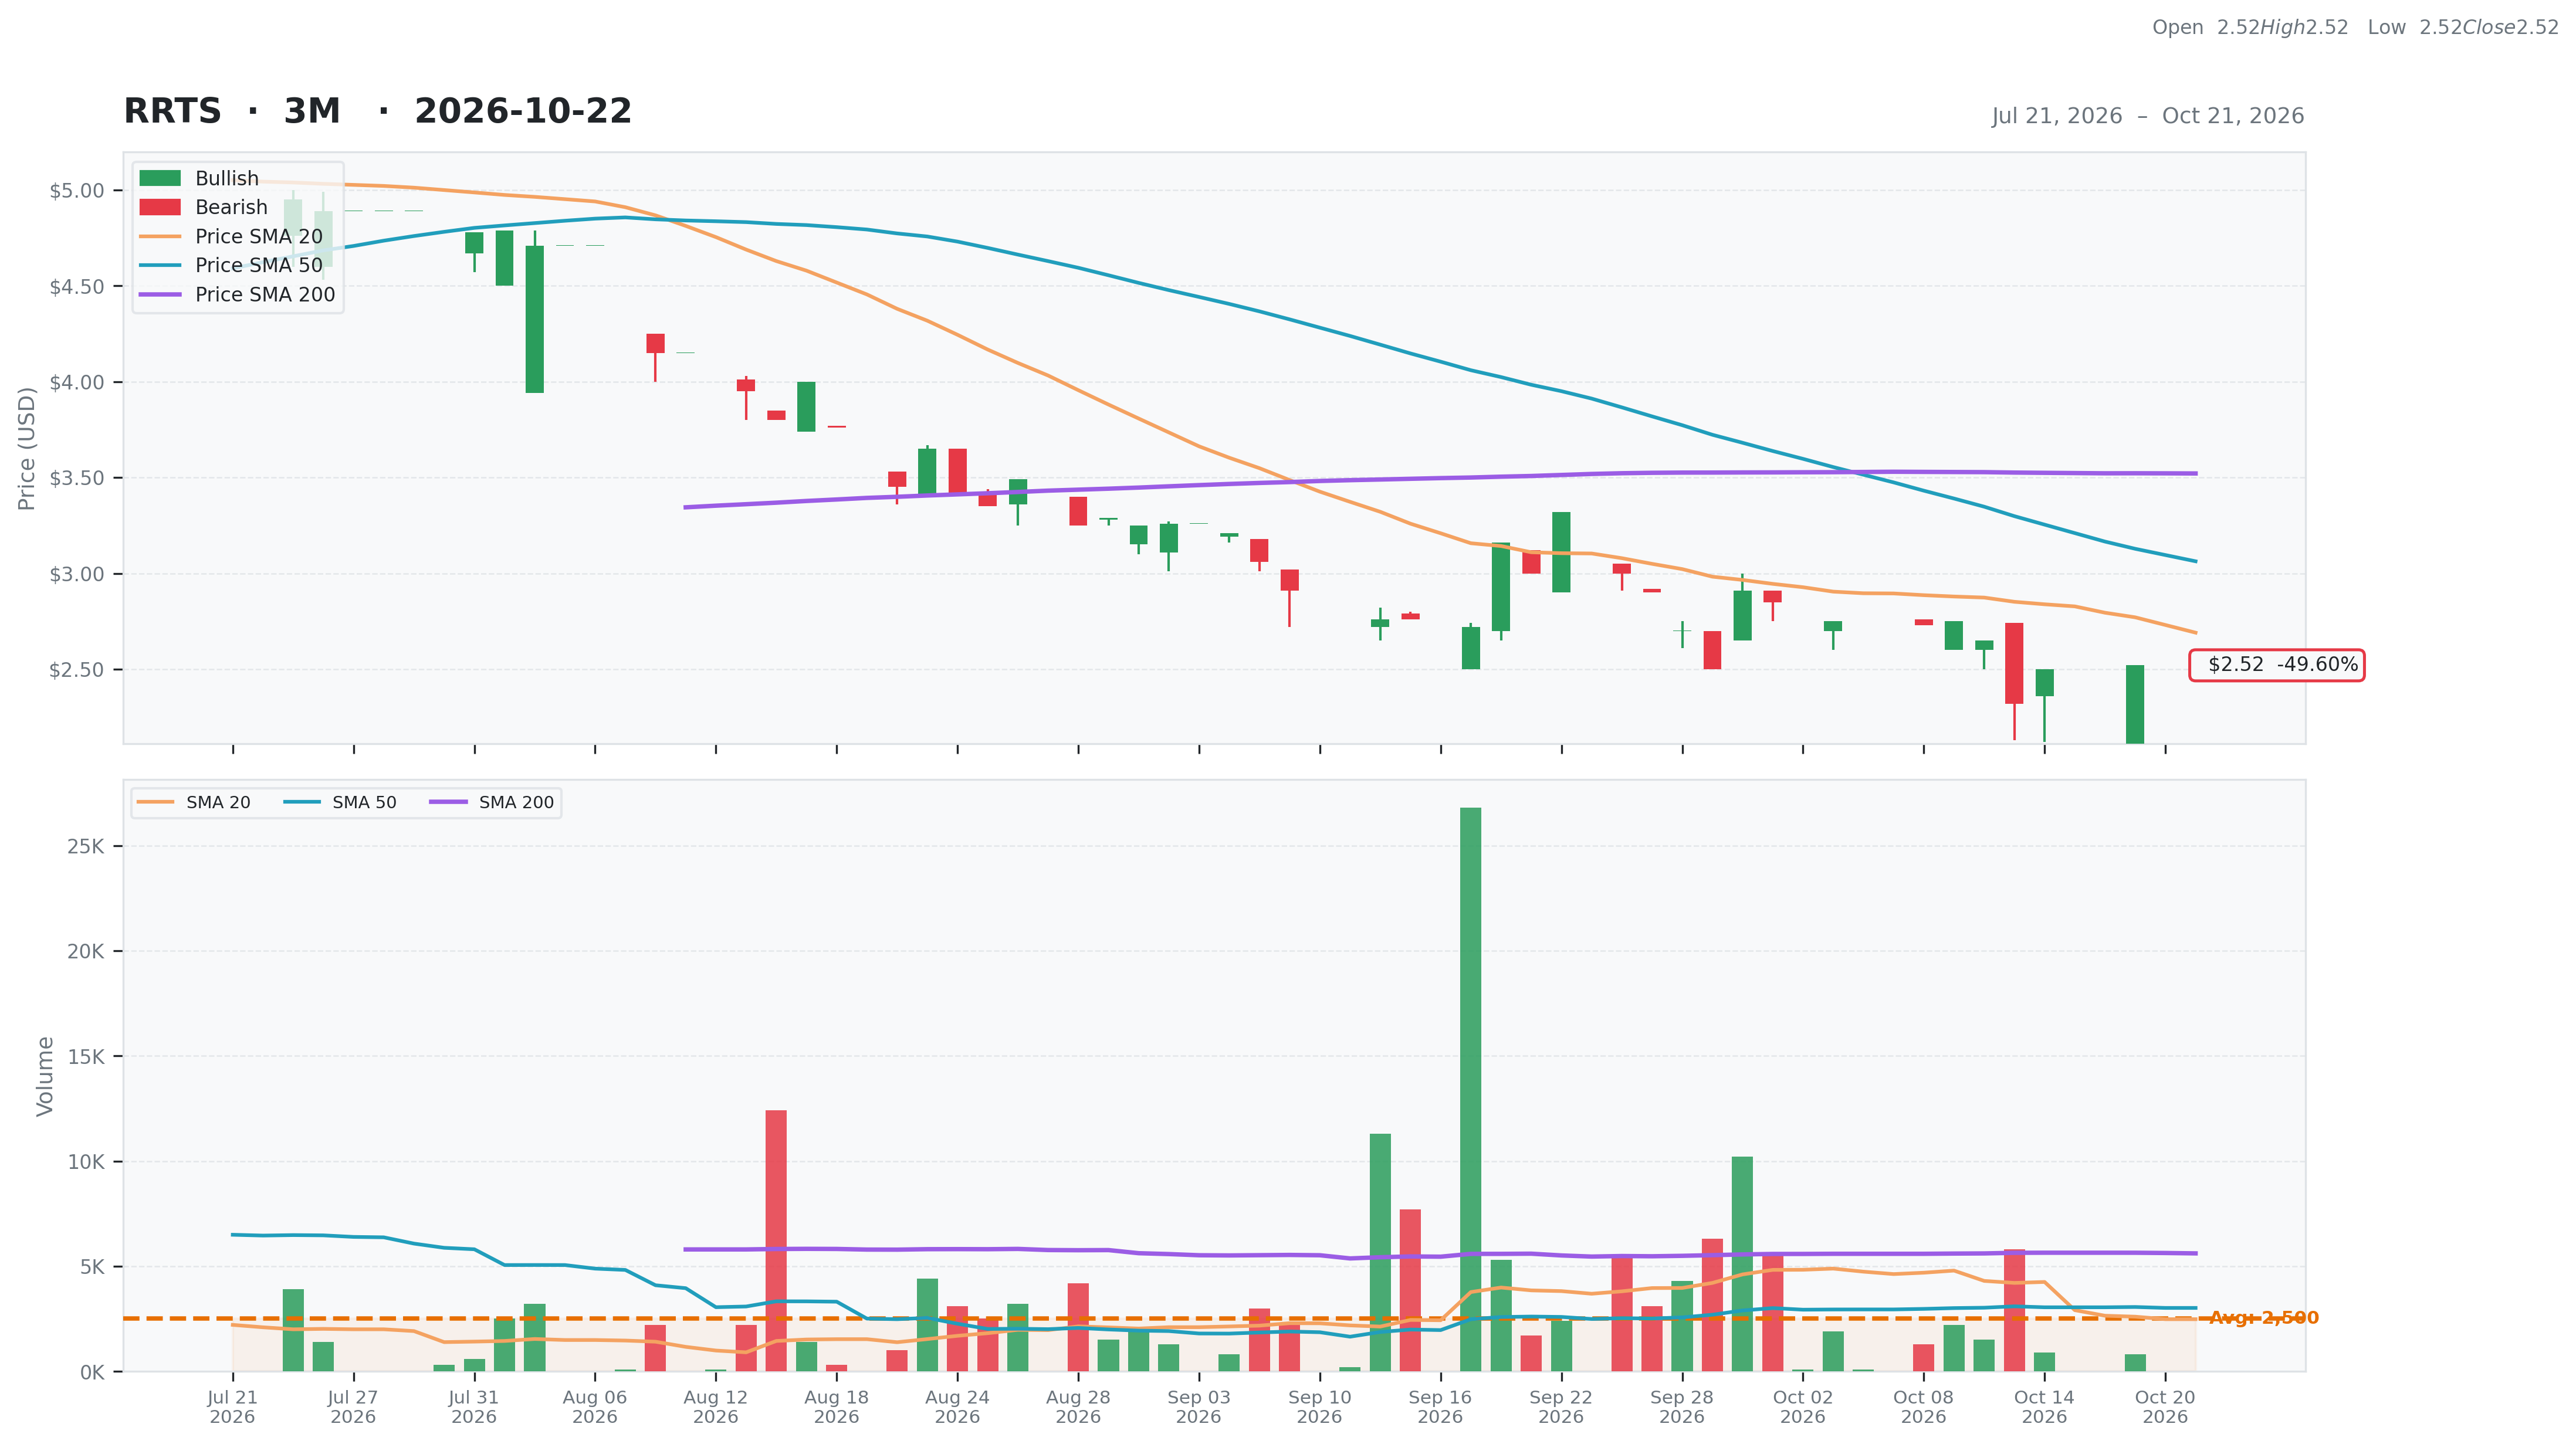
| Total | 18 | Current | $2.52 | 52W High | $5.29 -52.36% | Relative Strength | -0.22 | Beta | 3.92 |
| Business Quality | 1 | Weekly | $2.50 0.80% | 52W Low | $1.76 43.18% | 3M | -0.49 | Short % | 0.06 |
| Financial Strength | 0 | Monthly | $3.00 -16.00% | Above 50DMA | $3.06 -17.72% | 6M | -0.24 | Risk Score | |
| Growth Outlook | 1 | Quarterly | $4.95 -49.09% | Above 200DMA | $3.52 -28.43% | 9M | 0.05 | ||
| Momentum | 0 | Yearly | $2.41 4.56% | 12M | 0.05 | ||||
| Valuation | Financial Strength | Growth/Profitability | |||
|---|---|---|---|---|---|
| Trailing P/E | N/A | Cash | 5M | Revenue Growth | -0.27% |
| Forward P/E | -6.76 | Debt | 415M | Earnings Growth | N/A |
| PEG Ratio | 0.21 | Debt/Equity | 743.96 | Qtr Earnings Growth | N/A |
| Price/Sales | 0.05 | Current Ratio | 0.96 | Gross Margin | 0.16% |
| Price/Book | 1.70 | Quick Ratio | 0.82 | Operating Margin | -0.12% |
| EV/Revenue | 0.27 | Operating CF | -97M | Profit Margin | -0.18% |
| EV/EBITDA | -7.43 | Free CF | -32M | EBITDA Margin | -0.04% |
| Ent Value | 505M | Return on Assets | -0.10% | ||
| Return on Equity | -185.44% | ||||
| Technical | Volume & Bollinger Bands | Analyst | |||
|---|---|---|---|---|---|
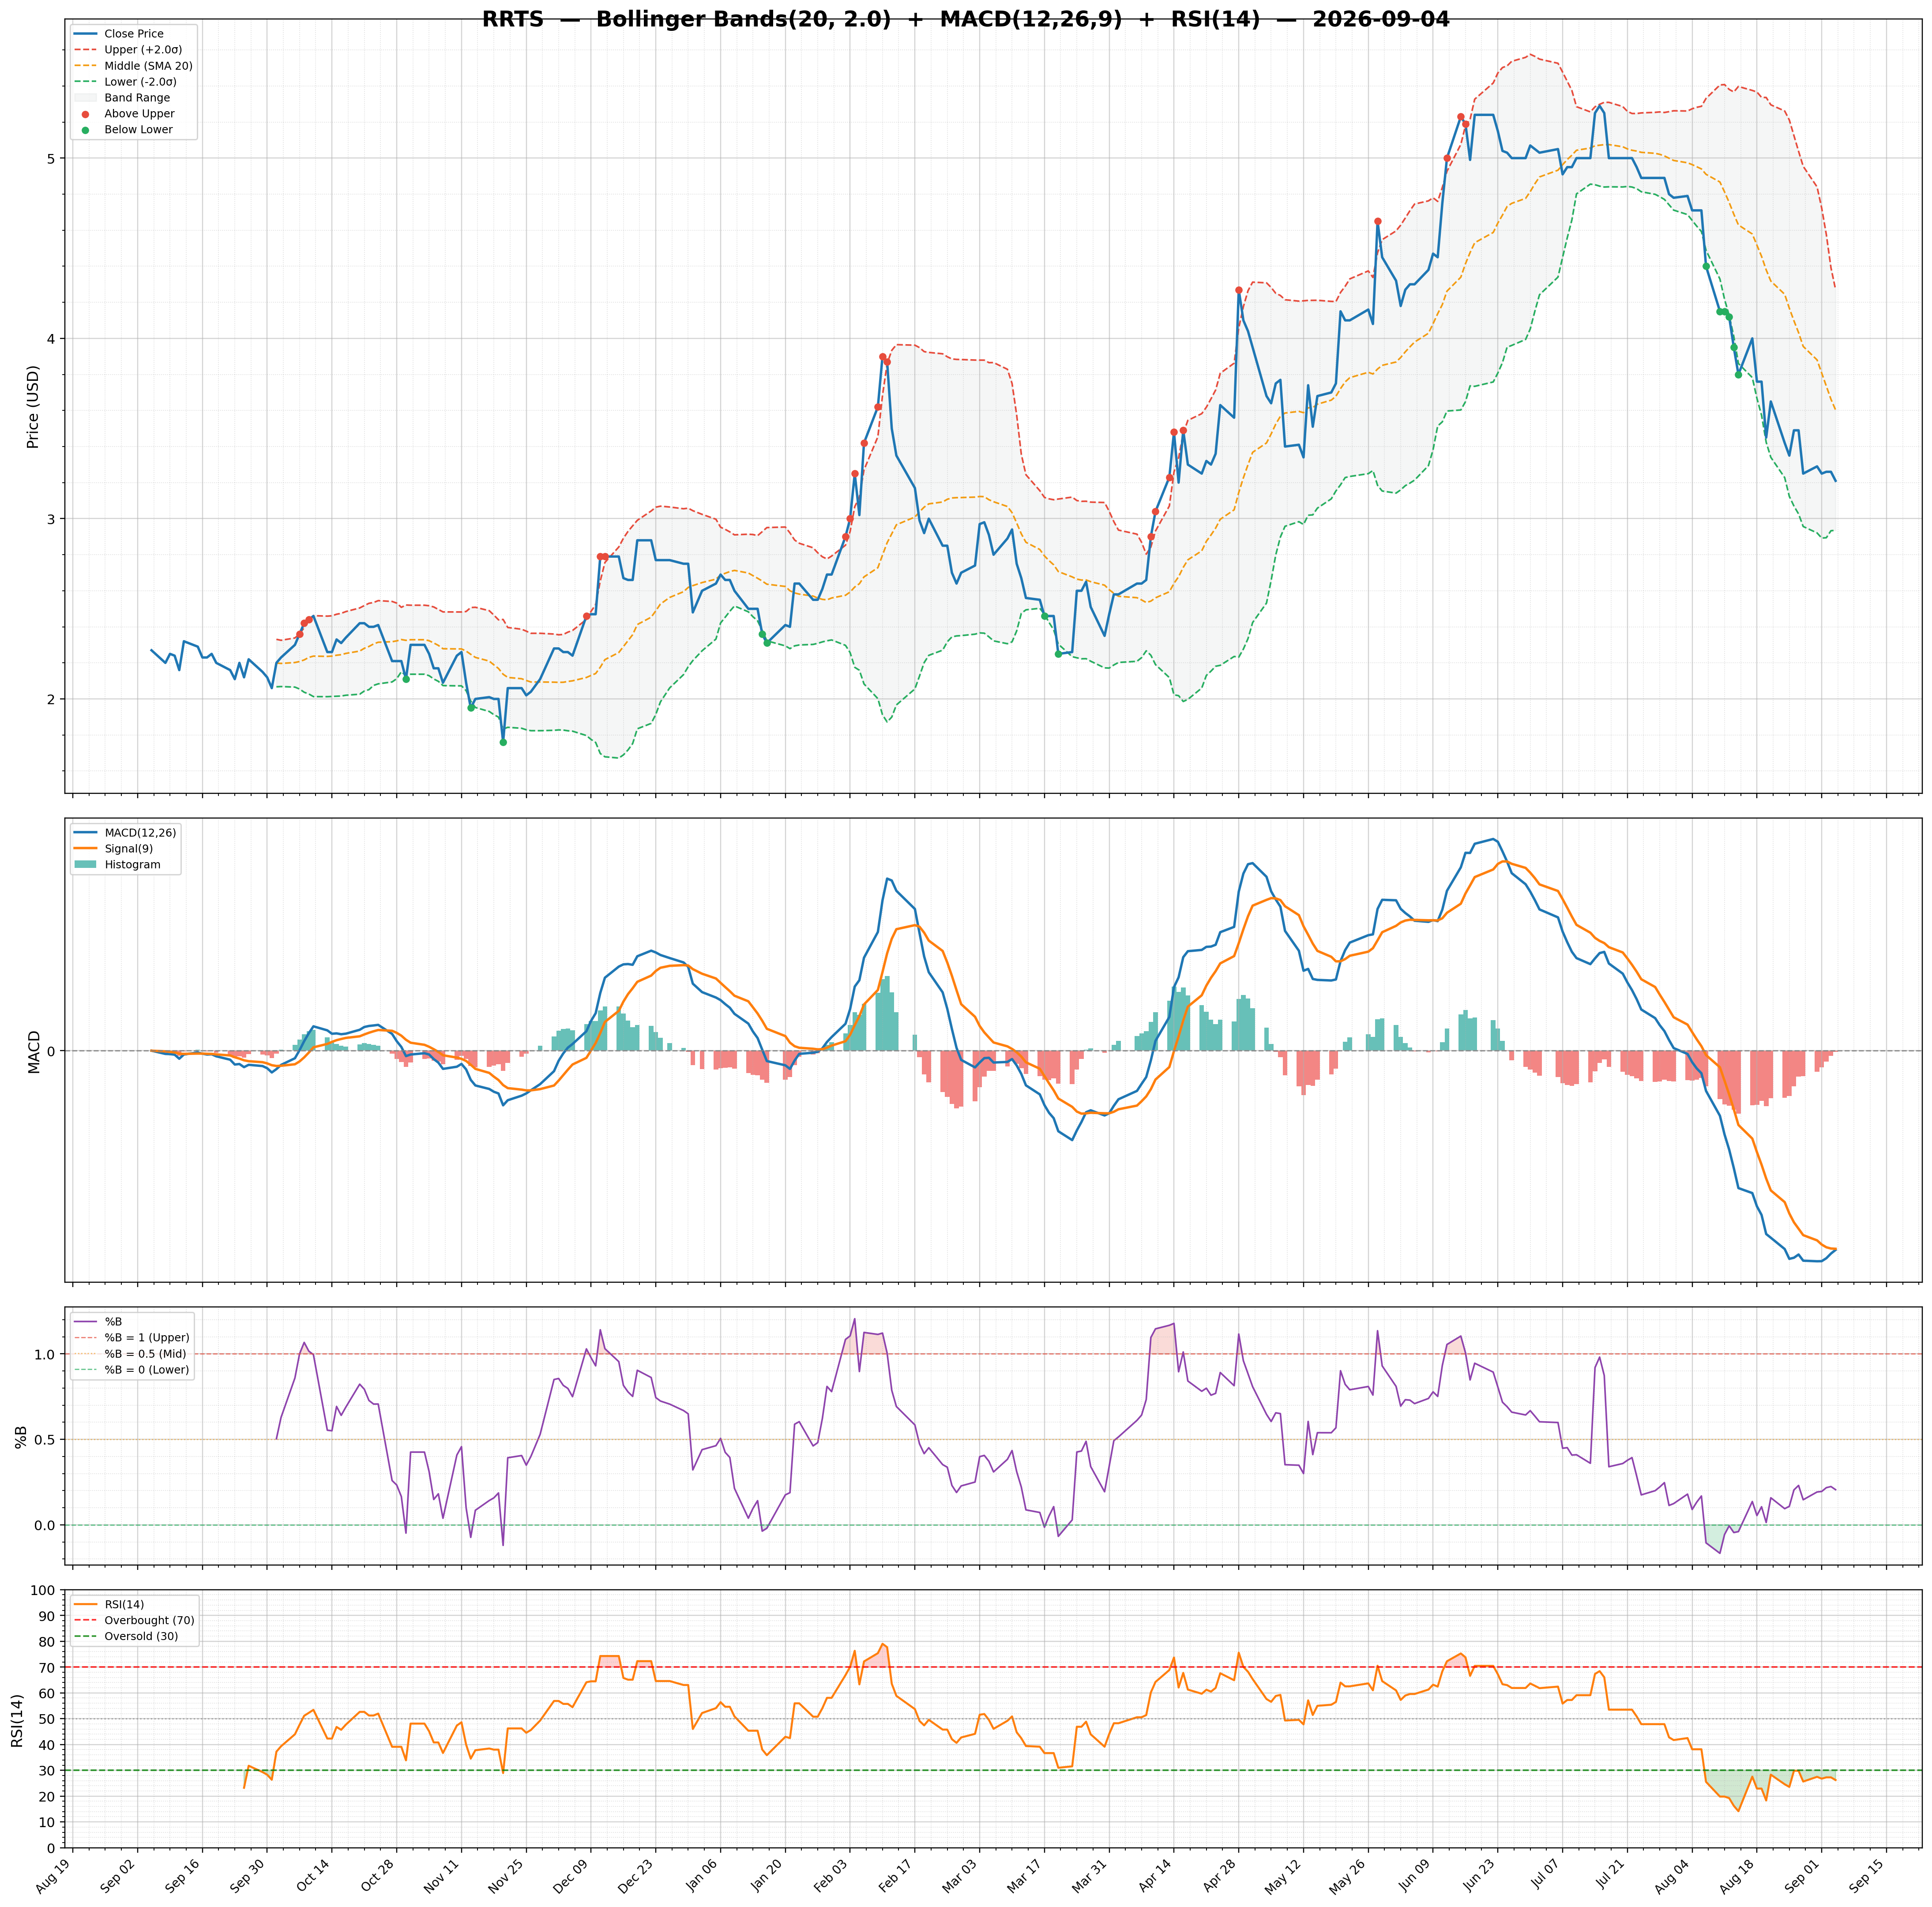
| RSI | 39.59 | Volume | 0M | Rating | none |
| Previous RSI | 39.59 | Avg Volume 20D | 0M | Target Mean | N/A |
| RSI Trend | Down | Relative Volume | N/A | Target High | N/A |
| MACD | -0.18 | Lower Band | 2.30 | Target Low | N/A |
| MACD Signal | -0.19 | Middle Band | 2.69 | Target Median | N/A |
| Histogram | 0.01 | Upper Band | 3.08 | Analysts | N/A |
| Previous Histogram | 0.00 | Bandwidth | 28.960 | Upside | N/A |
| Histogram Trend | Increasing | %B | 0.28 | ||