Rayonier Advanced Materials Inc (RYAM)
Basic Materials • Chemicals • $6.83 • MCap: 472,832,992
https://ryam.com • Rayonier Advanced Materials Inc. manufactures and sells cellulose specialty products in the United States, China, Europe, Japan, rest of Asia, Canada, Latin America, and internationally. It operates through Cellulose Specialties, Biomaterials, Cellulose Commodities, Paperboard, and High-Yield Pulp. The company's products include cellulose specialties, which are natural polymers that are used as raw materials to manufacture a range of consumer-oriented products, such as liquid crystal displays, impact-resistant plastics, thickeners for food products, pharmaceuticals, cosmetics, cigarette filters, high-tenacity rayon tire cords and industrial hoses, food casings, paints, lacquers, munitions, and explosives; and biomaterials, including biofuels, lignosulfonates, prebiotics, tall oil soap, and HCE and turpentine. It also offers commodity products, such as commodity viscose used in woven applications, including rayon textiles for clothing and other fabrics, as well as in non-woven applications comprising baby wipes, cosmetic and personal wipes, industrial wipes, and mattress ticking; and absorbent materials consisting of fluff that are used as an absorbent medium in disposable baby diapers, feminine hygiene products, incontinence pads, convalescent bed pads, industrial towels and wipes, and non-woven fabrics. In addition, the company provides paperboards for packaging, printing documents, brochures, promotional materials, paperback books and catalog covers, file folders, freezer, tags, and lottery tickets; and high-yield pulps to produce hardwood aspen, maple, and birch species for paperboard, packaging, printing and writing papers, and various other paper products. Rayonier Advanced Materials Inc. was founded in 1926 and is headquartered in Jacksonville, Florida.
Ex-AAII
| Score | Price | 52 Week & Averages | Relative Strength | Risk | |||||
|---|---|---|---|---|---|---|---|---|---|
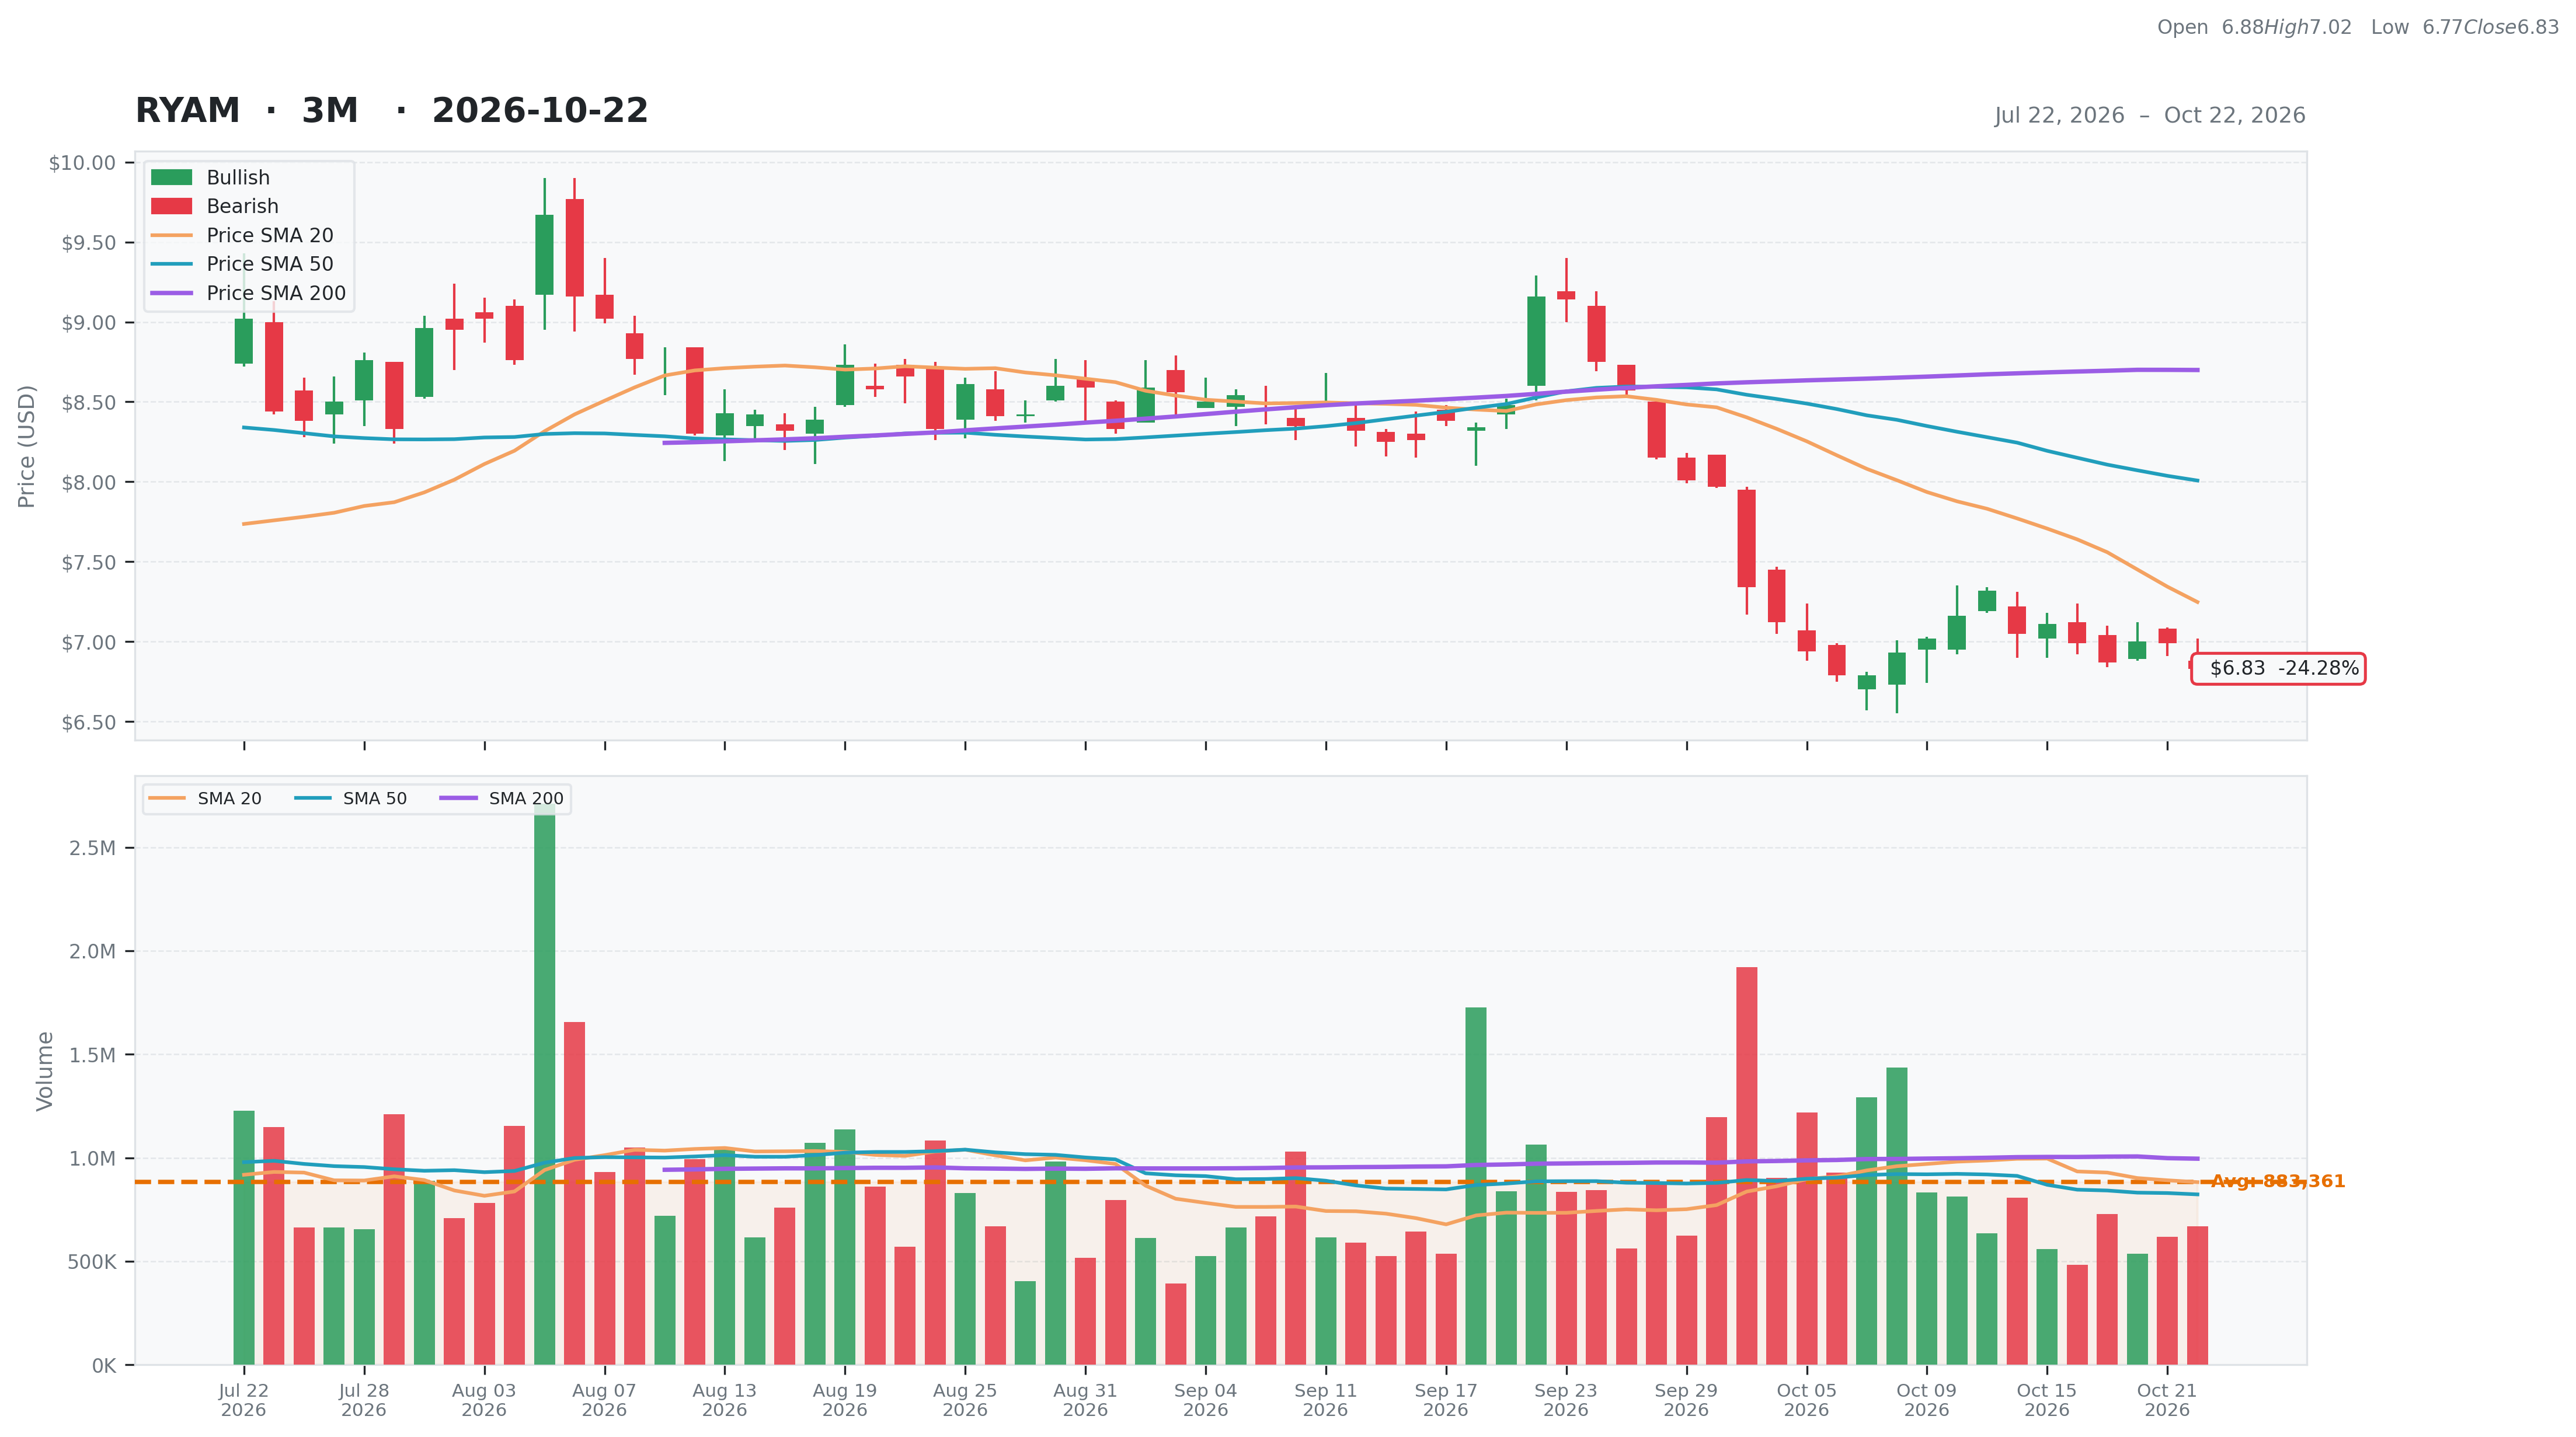
| Total | 25 | Current | $6.83 | 52W High | $11.75 -41.87% | Relative Strength | -0.19 | Beta | 1.84 |
| Business Quality | 1 | Weekly | $7.11 -3.94% | 52W Low | $5.52 23.73% | 3M | -0.18 | Short % | 0.08 |
| Financial Strength | 8 | Monthly | $9.16 -25.44% | Above 50DMA | $8.01 -14.71% | 6M | -0.30 | Risk Score | 3 |
| Growth Outlook | 1 | Quarterly | $8.38 -18.50% | Above 200DMA | $8.70 -21.49% | 9M | -0.20 | ||
| Momentum | 2 | Yearly | $7.20 -5.14% | 12M | -0.07 | ||||
| Valuation | Financial Strength | Growth/Profitability | |||
|---|---|---|---|---|---|
| Trailing P/E | N/A | Cash | 57M | Revenue Growth | 0.11% |
| Forward P/E | 5.92 | Debt | 775M | Earnings Growth | N/A |
| PEG Ratio | 2.63 | Debt/Equity | 374.42 | Qtr Earnings Growth | N/A |
| Price/Sales | 0.32 | Current Ratio | 1.37 | Gross Margin | 0.06% |
| Price/Book | 2.43 | Quick Ratio | 0.64 | Operating Margin | 0.02% |
| EV/Revenue | 0.82 | Operating CF | 51M | Profit Margin | -0.10% |
| EV/EBITDA | 8.86 | Free CF | 23M | EBITDA Margin | 0.09% |
| Ent Value | 1,203M | Return on Assets | 0.00% | ||
| Return on Equity | -0.50% | ||||
| Technical | Volume & Bollinger Bands | Analyst | |||
|---|---|---|---|---|---|
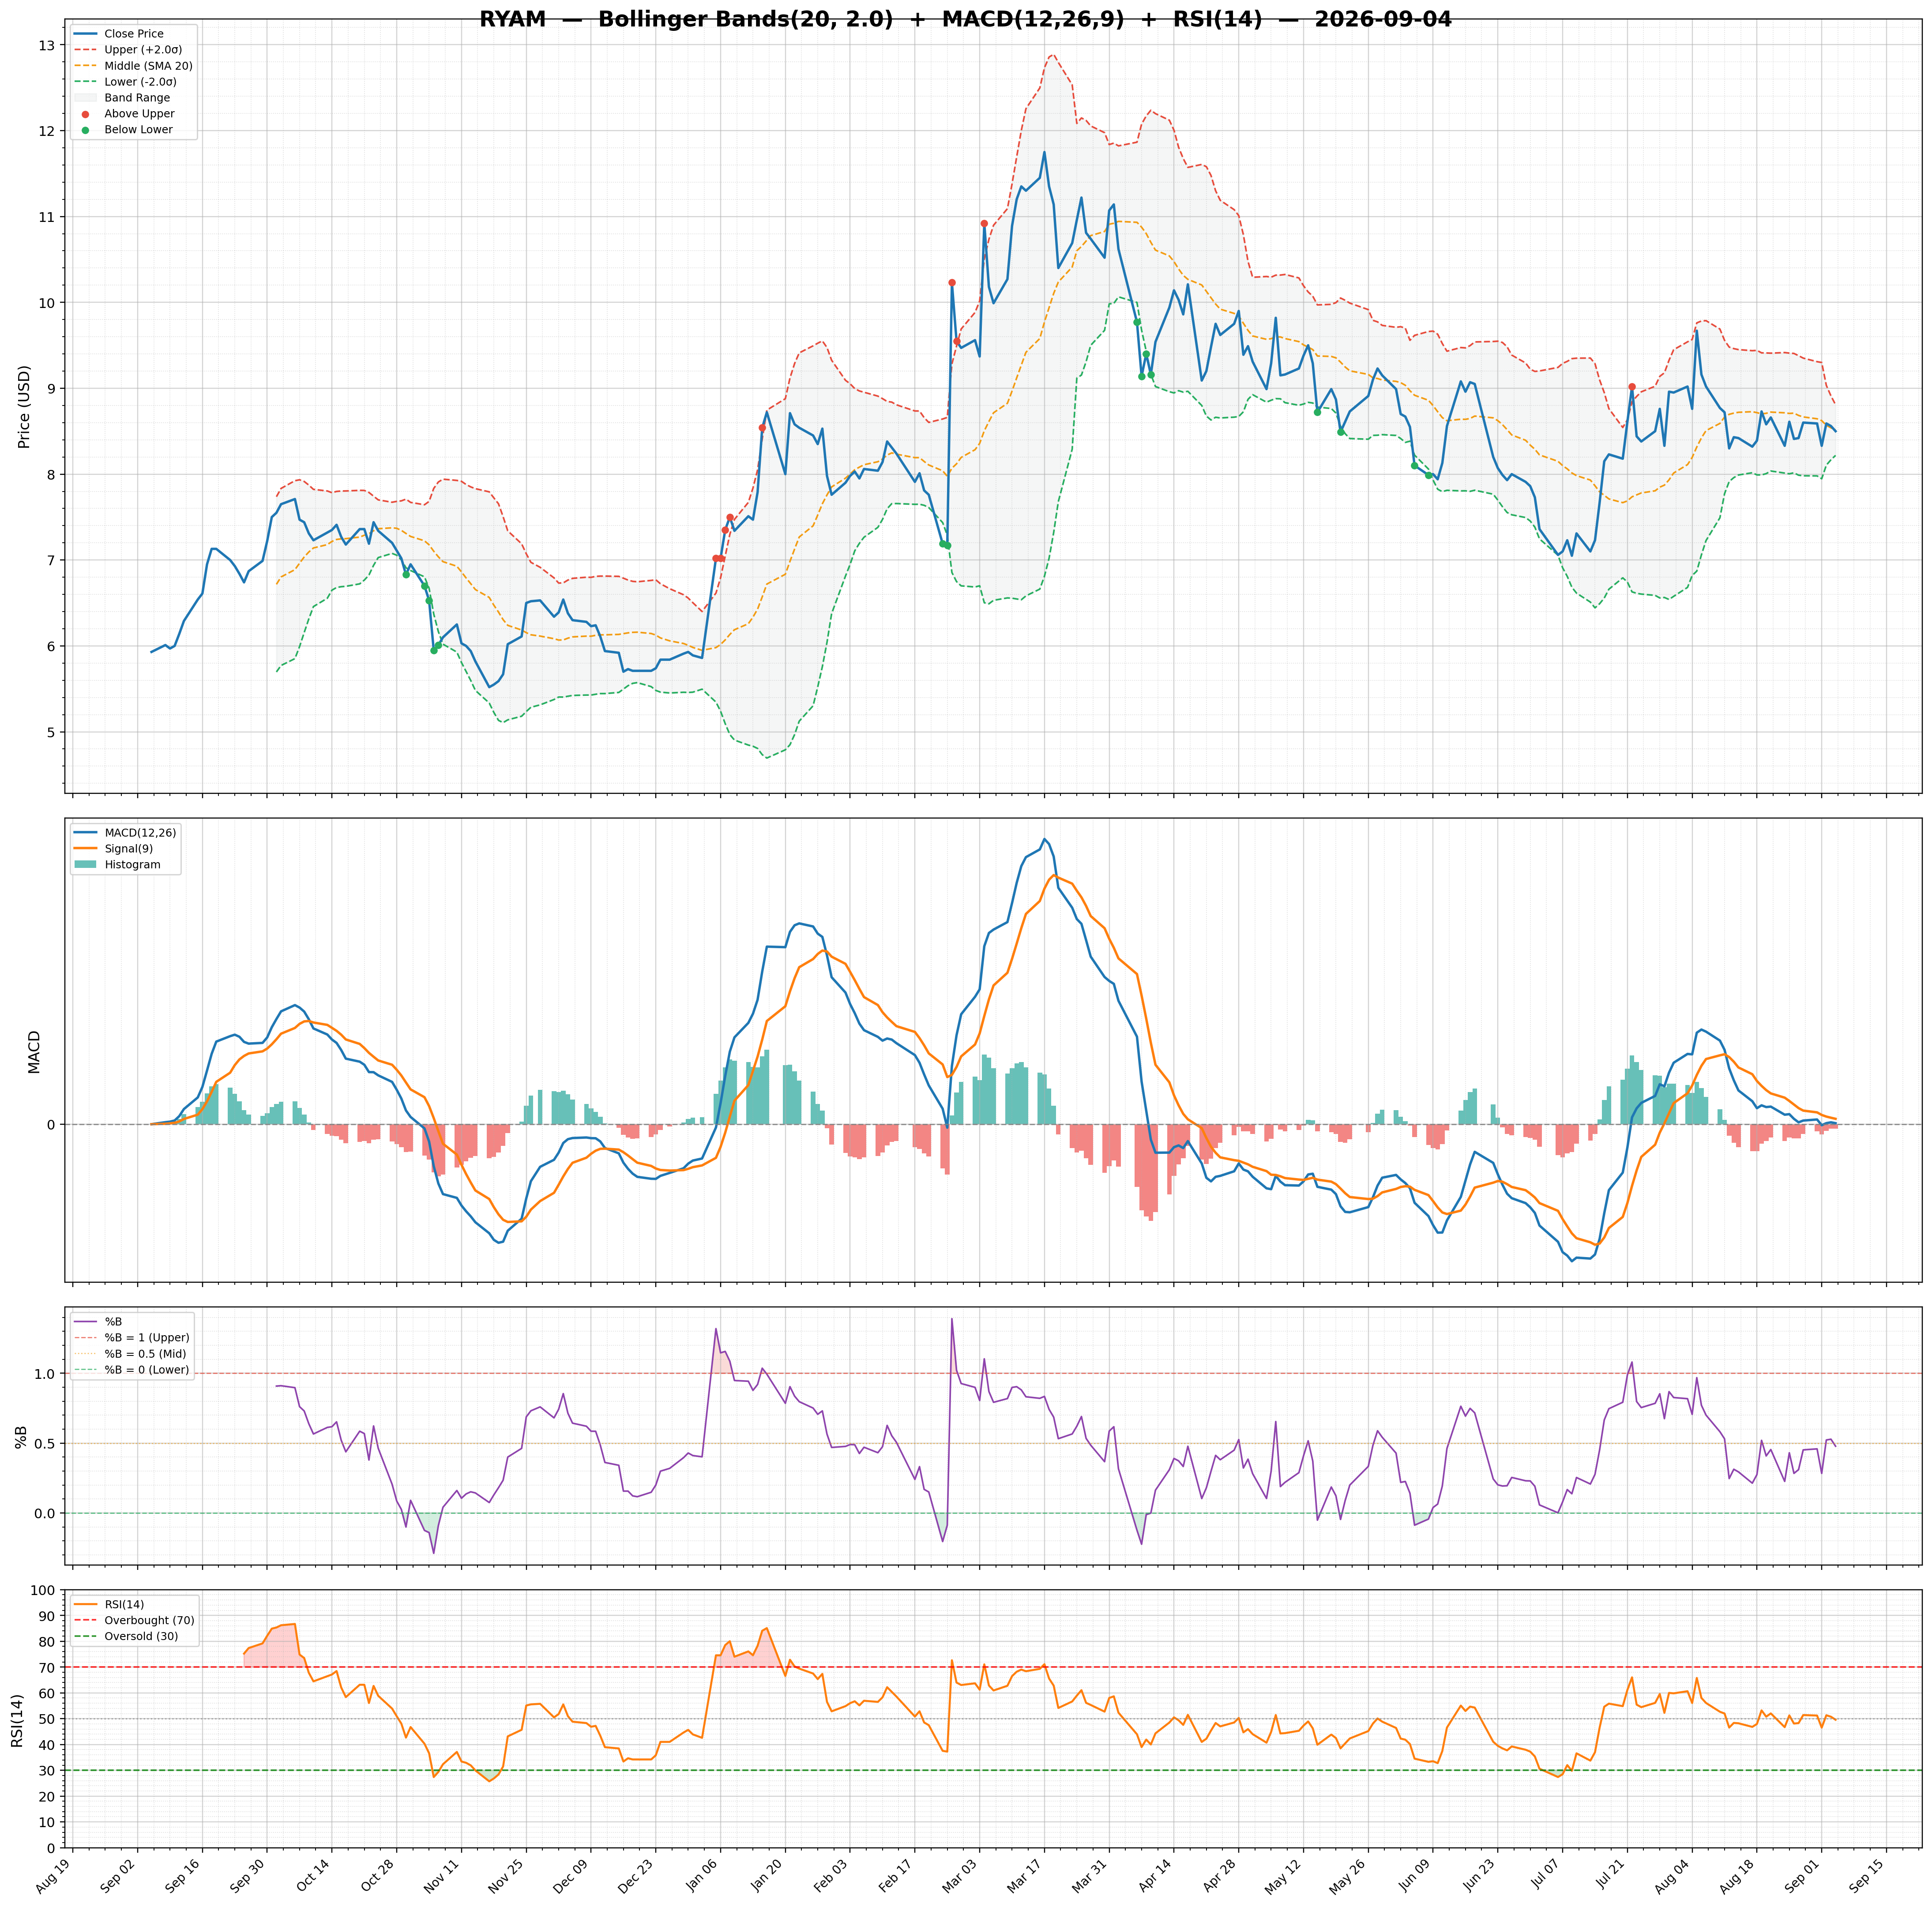
| RSI | 34.66 | Volume | 0.48M | Rating | buy |
| Previous RSI | 37.43 | Avg Volume 20D | 0.88M | Target Mean | $14.00 |
| RSI Trend | Down | Relative Volume | 0.78 | Target High | $15.00 |
| MACD | -0.34 | Lower Band | 6.23 | Target Low | $13.00 |
| MACD Signal | -0.35 | Middle Band | 7.25 | Target Median | $14.00 |
| Histogram | 0.01 | Upper Band | 8.27 | Analysts | 2 |
| Previous Histogram | 0.01 | Bandwidth | 28.140 | Upside | 100.29% |
| Histogram Trend | Decreasing | %B | 0.30 | ||