Ryerson Holding Corporation (RYZ)
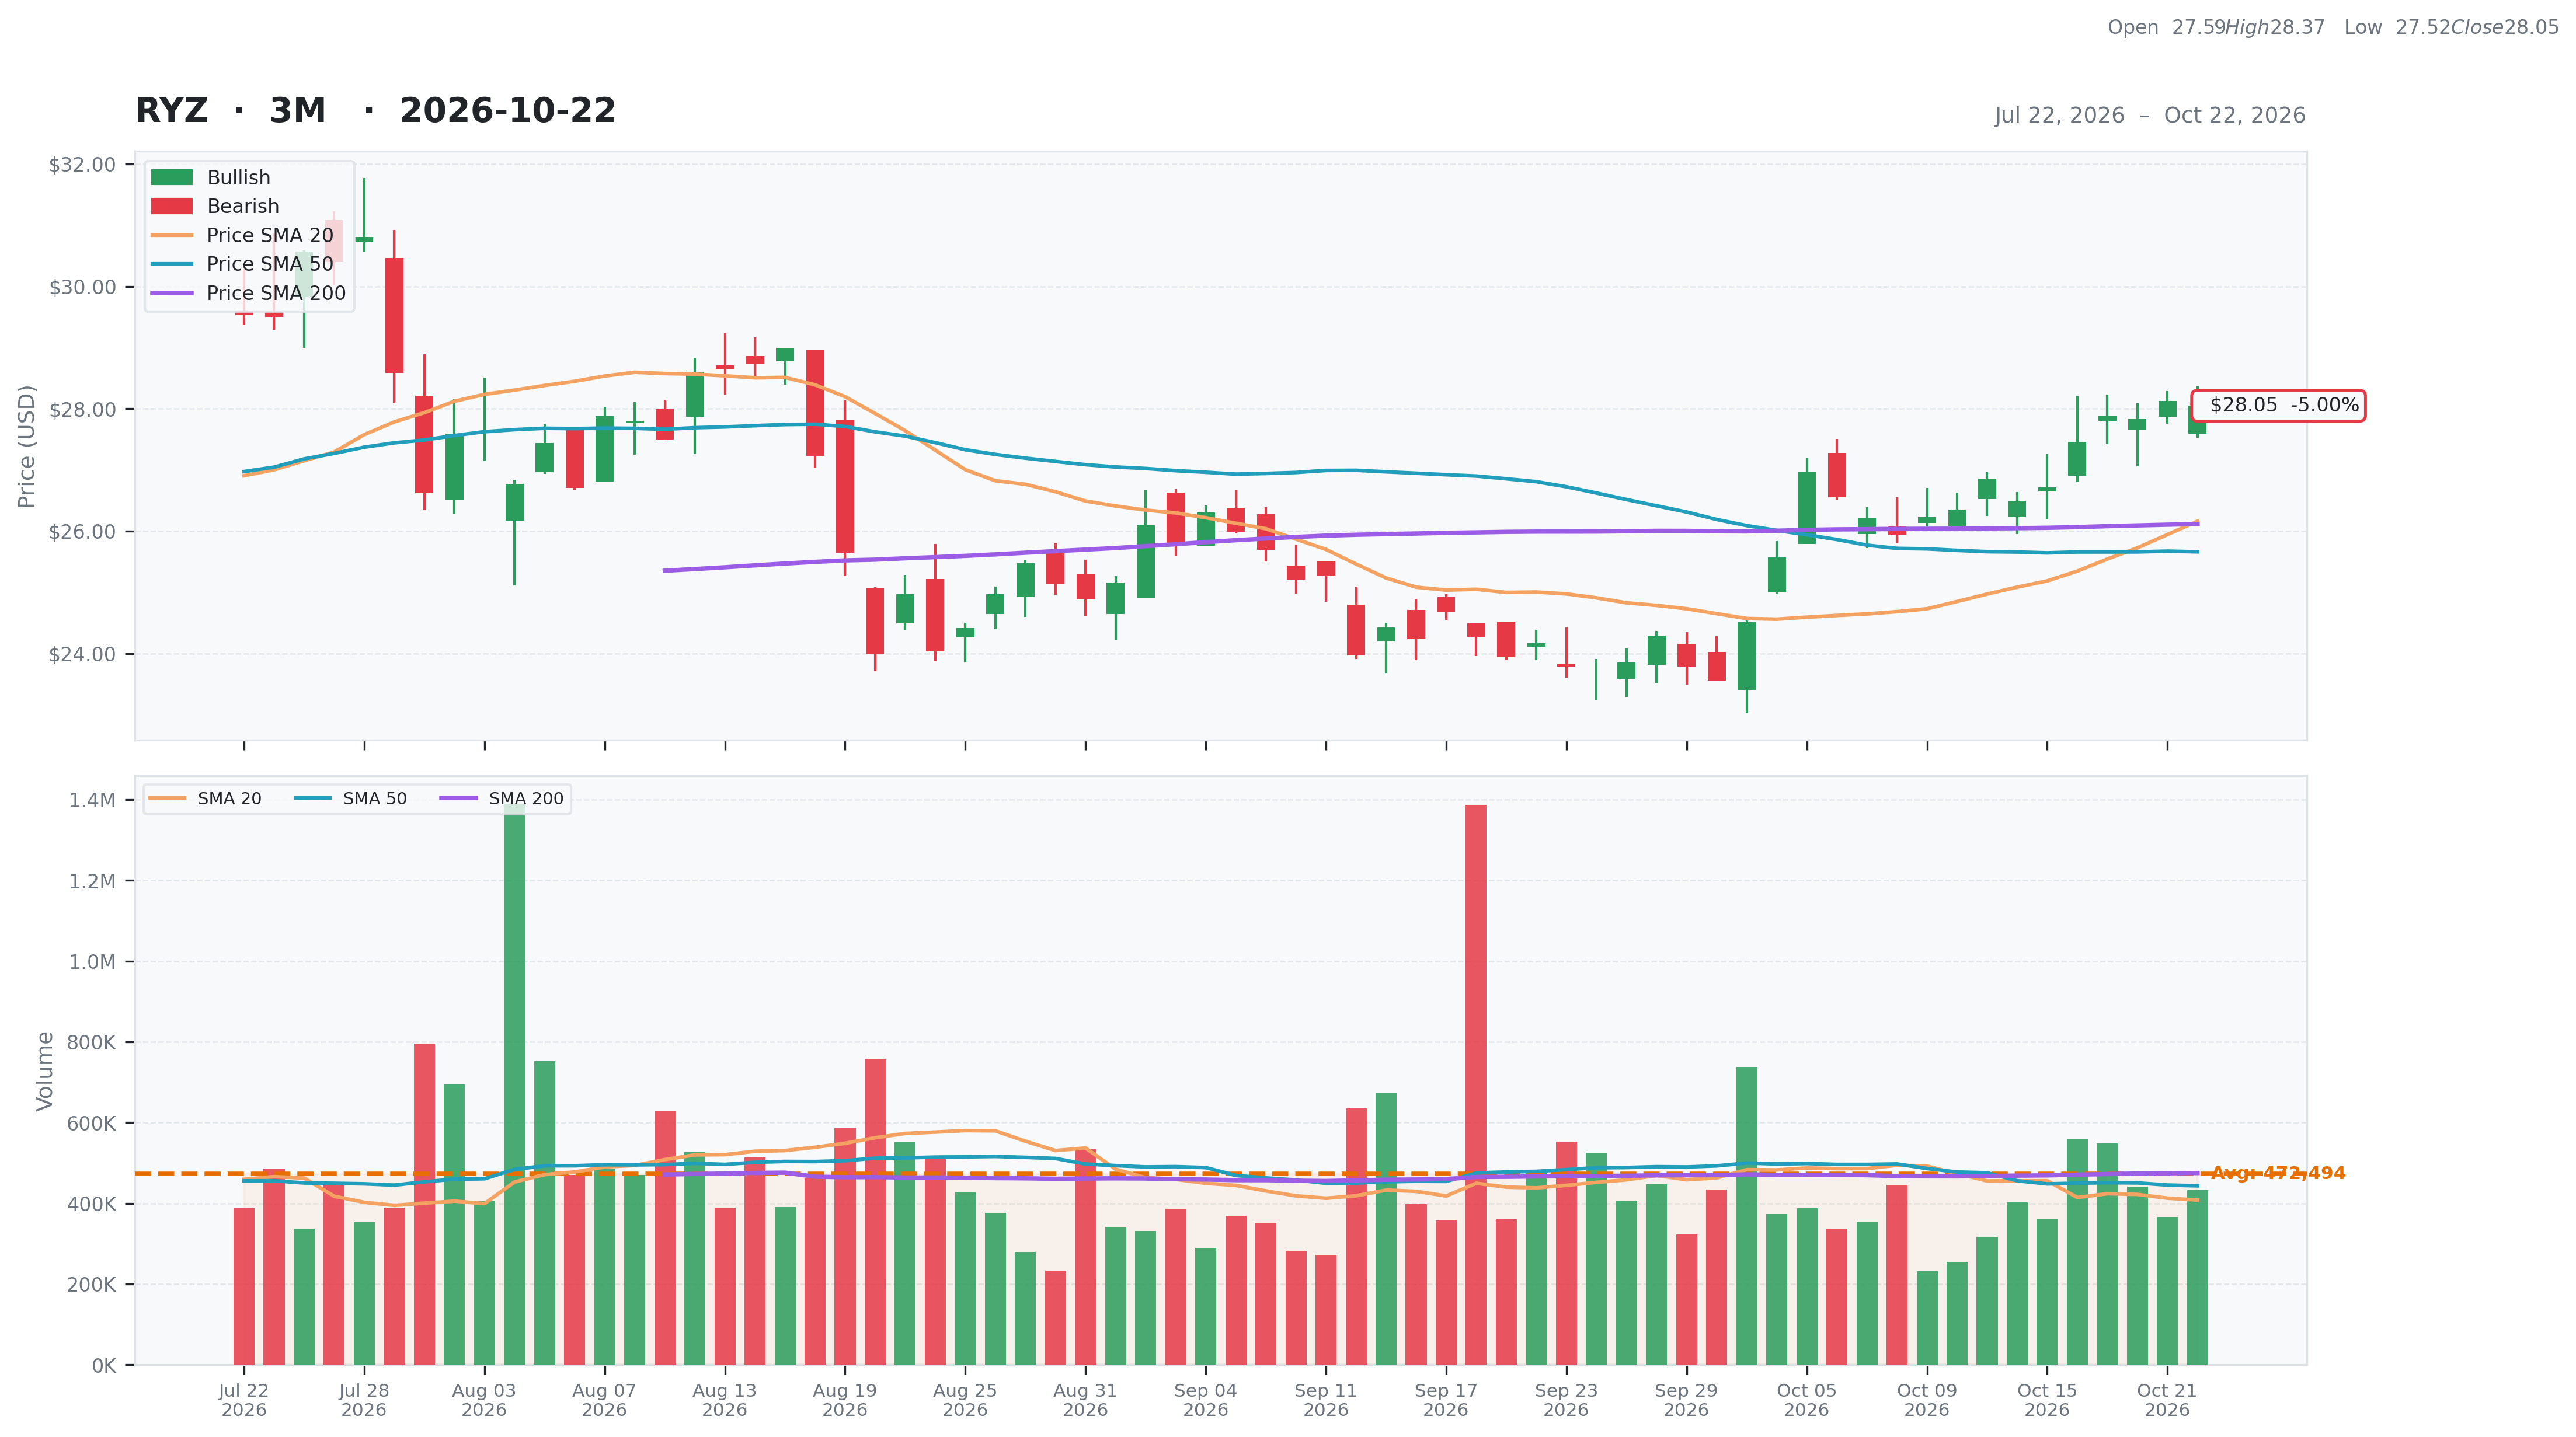
Industrials • Metal Fabrication • $28.05 • MCap: 1,425,136,896
https://www.ryerson.com • Ryerson Holding Corporation, together with its subsidiaries, processes and distributes industrial metals in the United States and internationally. It offers a line of products in carbon steel, stainless steel, alloy steels, and aluminum, as well as nickel and red metals in various shapes and forms, including coils, sheets, rounds, hexagons, square and flat bars, plates, structural, and tubing. The company also provides processing services. It serves commercial transportation, fabrication and welding, machinery and equipment, consumer products, heavy equipment, climate, power, and machine shop industries. Ryerson Holding Corporation was founded in 1842 and is headquartered in Chicago, Illinois.
Ex-AAII
| Score | Price | 52 Week & Averages | Relative Strength | Risk | |||||
|---|---|---|---|---|---|---|---|---|---|
| Total | 47 | Current | $28.05 | 52W High | $30.81 -8.95% | Relative Strength | 0.03 | Beta | 1.61 |
| Business Quality | 1 | Weekly | $26.72 4.98% | 52W Low | $19.43 44.35% | 3M | -0.08 | Short % | 0.03 |
| Financial Strength | 11 | Monthly | $24.17 16.05% | Above 50DMA | $25.66 9.30% | 6M | 0.12 | Risk Score | 7 |
| Growth Outlook | 11 | Quarterly | $30.57 -8.24% | Above 200DMA | $26.12 7.40% | 9M | -0.05 | ||
| Momentum | 4 | Yearly | $22.38 25.35% | 12M | 0.22 | ||||
| Valuation | Financial Strength | Growth/Profitability | |||
|---|---|---|---|---|---|
| Trailing P/E | N/A | Cash | 42M | Revenue Growth | 0.72% |
| Forward P/E | 11.64 | Debt | 1,349M | Earnings Growth | 4.06% |
| PEG Ratio | N/A | Debt/Equity | 103.86 | Qtr Earnings Growth | 7.16% |
| Price/Sales | 0.24 | Current Ratio | 2.21 | Gross Margin | 0.17% |
| Price/Book | 1.11 | Quick Ratio | 0.96 | Operating Margin | 0.02% |
| EV/Revenue | 0.47 | Operating CF | -68M | Profit Margin | -0.01% |
| EV/EBITDA | 22.32 | Free CF | -532M | EBITDA Margin | 0.02% |
| Ent Value | 2,743M | Return on Assets | 0.01% | ||
| Return on Equity | -0.03% | ||||
| Technical | Volume & Bollinger Bands | Analyst | |||
|---|---|---|---|---|---|
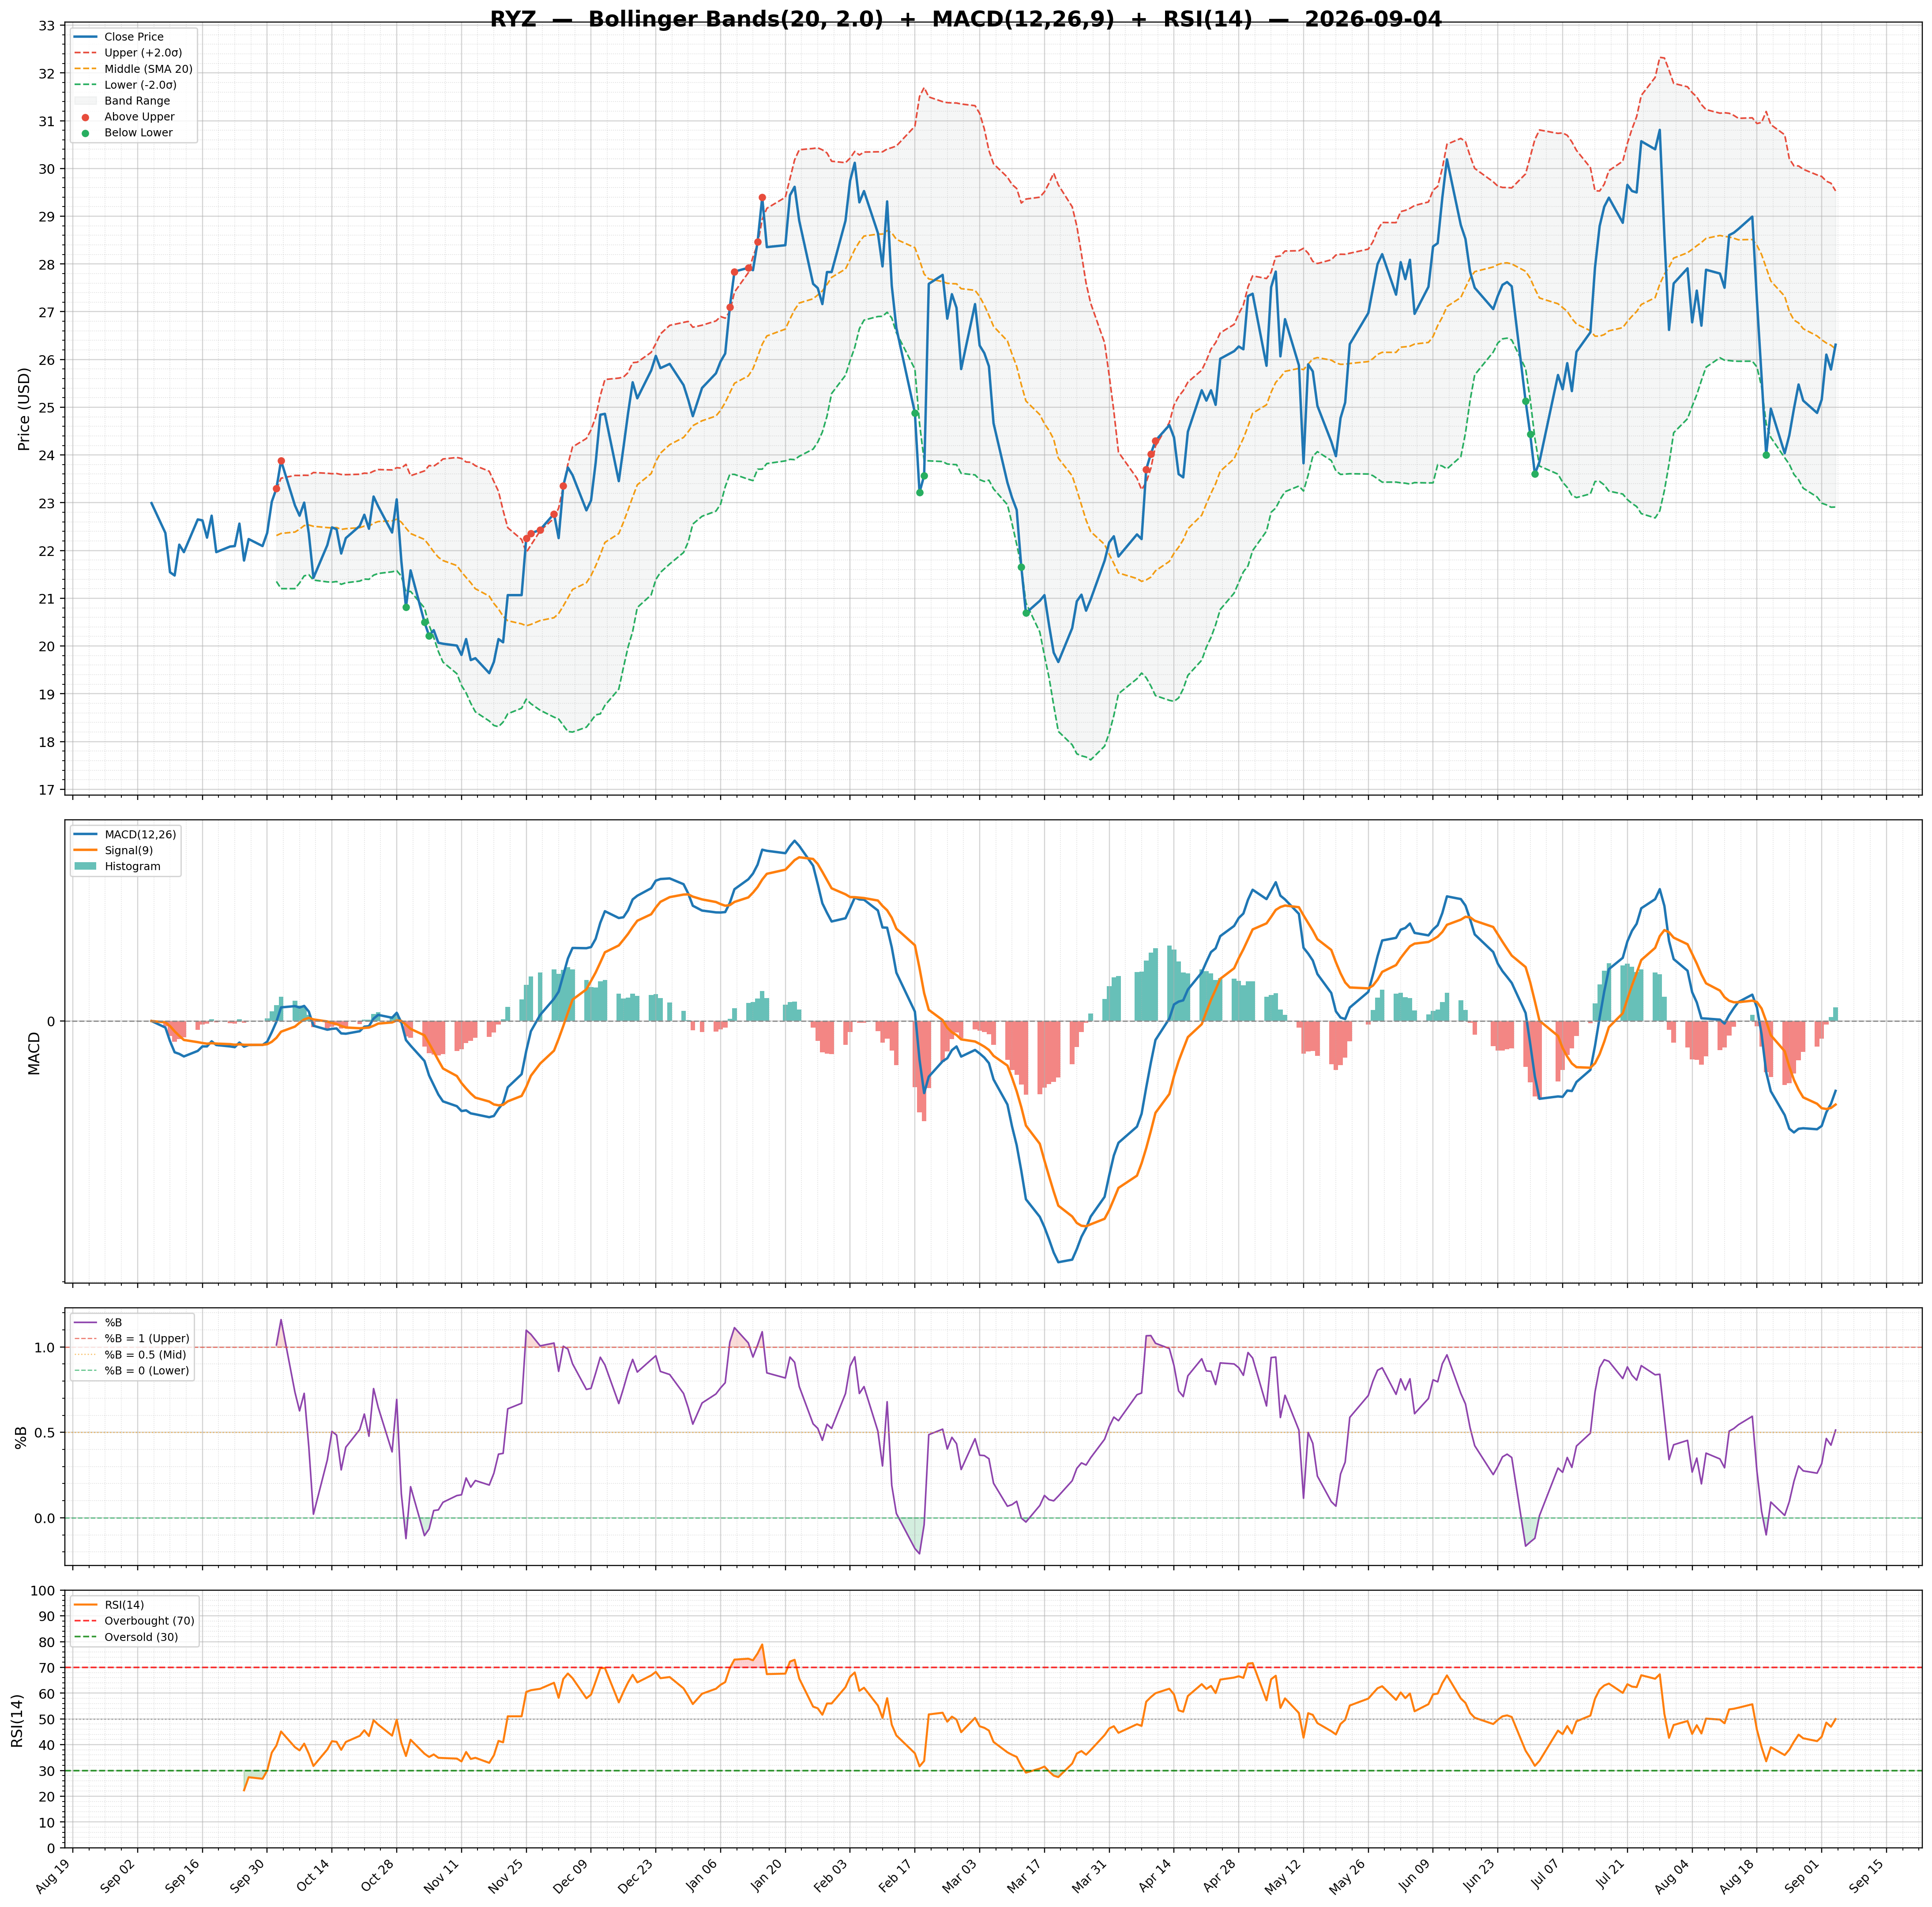
| RSI | 65.96 | Volume | 0.56M | Rating | hold |
| Previous RSI | 66.89 | Avg Volume 20D | 0.41M | Target Mean | $29.00 |
| RSI Trend | Down | Relative Volume | 0.94 | Target High | $29.00 |
| MACD | 0.74 | Lower Band | 23.22 | Target Low | $29.00 |
| MACD Signal | 0.48 | Middle Band | 26.16 | Target Median | $29.00 |
| Histogram | 0.25 | Upper Band | 29.10 | Analysts | 1 |
| Previous Histogram | 0.28 | Bandwidth | 22.470 | Upside | 5.61% |
| Histogram Trend | Decreasing | %B | 0.82 | ||