Silvercrest Asset Management Gr (SAMG)
Financial Services • Asset Management • $10.63 • MCap: 83,028,216
https://www.silvercrestgroup.com • Silvercrest Asset Management Group Inc., a wealth management firm, provides financial advisory and related family office services in the United States. The company serves ultra-high net worth individuals and families, as well as their trusts; endowments; foundations; and other institutional investors. It also manages funds of funds and other investment funds. The company was founded in 2002 and is headquartered in New York, New York.
ET
| Score | Price | 52 Week & Averages | Relative Strength | Risk | |||||
|---|---|---|---|---|---|---|---|---|---|
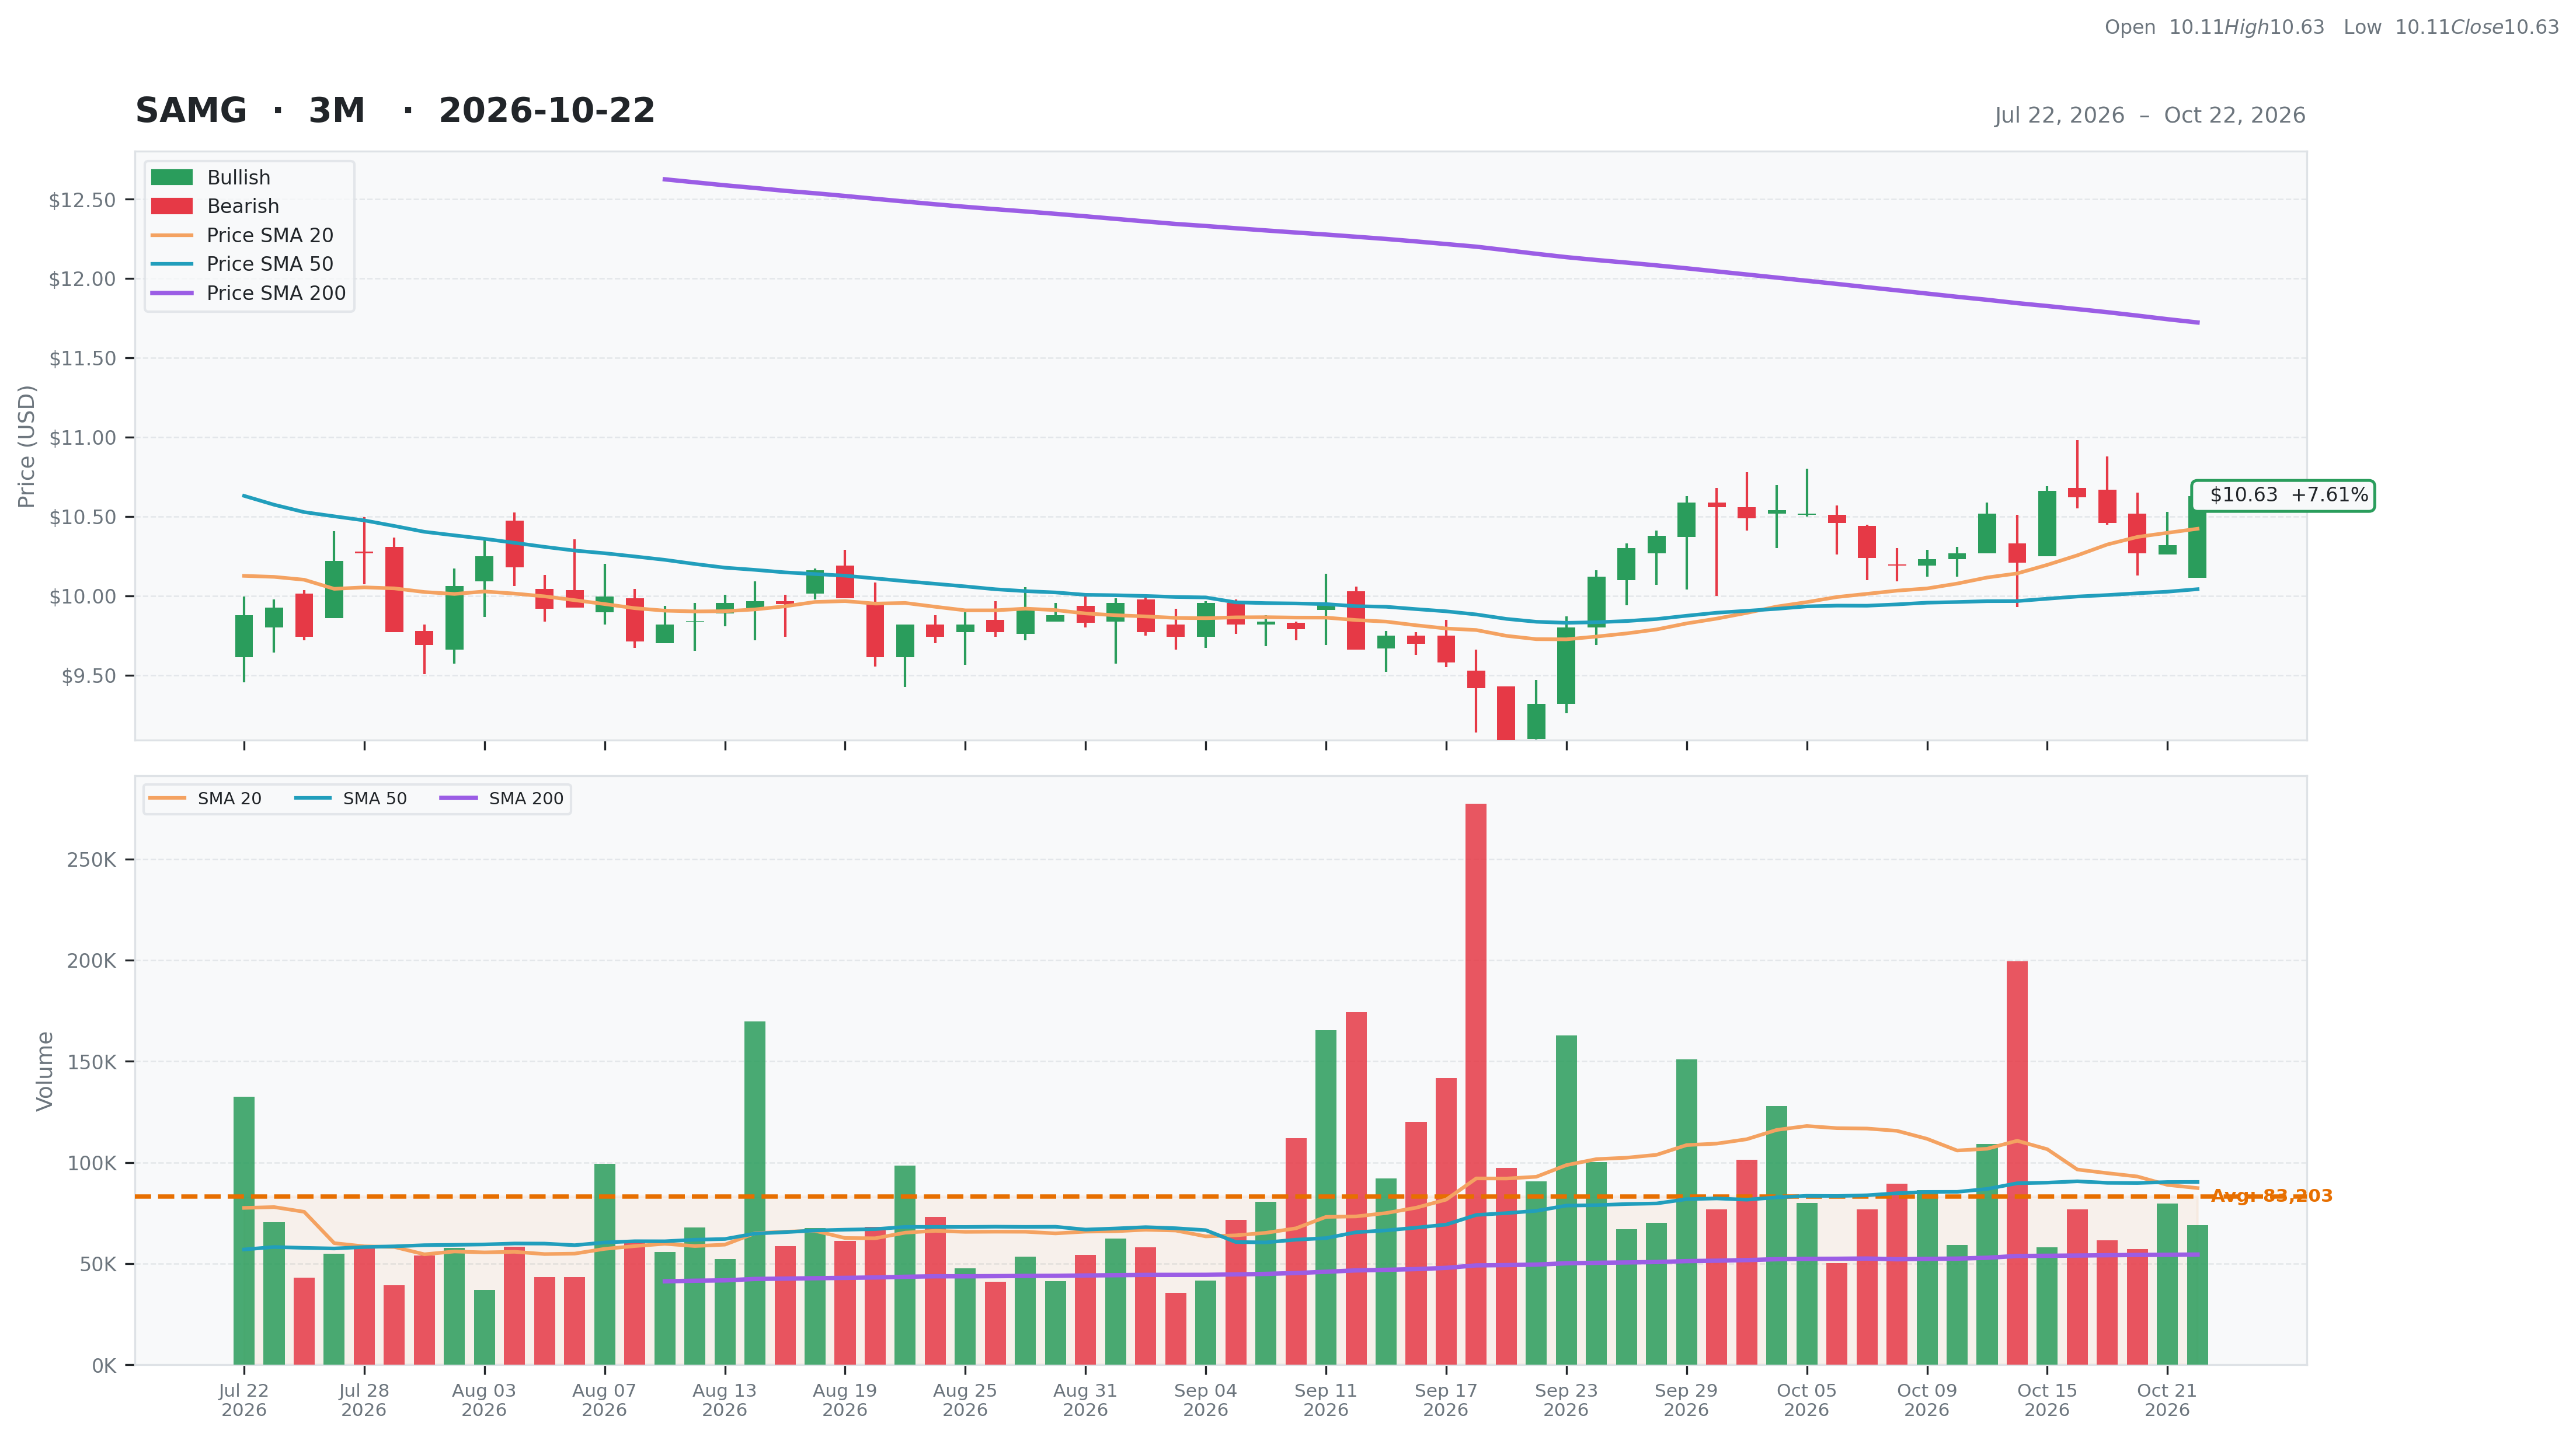
| Total | 40 | Current | $10.63 | 52W High | $14.96 -28.95% | Relative Strength | -0.10 | Beta | 0.66 |
| Business Quality | 4 | Weekly | $10.66 -0.28% | 52W Low | $9.09 16.94% | 3M | 0.09 | Short % | 0.05 |
| Financial Strength | 8 | Monthly | $9.32 14.06% | Above 50DMA | $10.04 5.85% | 6M | -0.17 | Risk Score | 10 |
| Growth Outlook | 4 | Quarterly | $9.74 9.13% | Above 200DMA | $11.72 -9.32% | 9M | -0.29 | ||
| Momentum | 2 | Yearly | $13.33 -20.26% | 12M | -0.23 | ||||
| Valuation | Financial Strength | Growth/Profitability | |||
|---|---|---|---|---|---|
| Trailing P/E | 88.46 | Cash | 21M | Revenue Growth | 0.00% |
| Forward P/E | 11.29 | Debt | 28M | Earnings Growth | -0.90% |
| PEG Ratio | N/A | Debt/Equity | 35.67 | Qtr Earnings Growth | -0.91% |
| Price/Sales | 0.66 | Current Ratio | 1.29 | Gross Margin | 0.30% |
| Price/Book | 1.79 | Quick Ratio | 1.09 | Operating Margin | 0.03% |
| EV/Revenue | 0.97 | Operating CF | 13M | Profit Margin | 0.01% |
| EV/EBITDA | 23.43 | Free CF | 8M | EBITDA Margin | 0.04% |
| Ent Value | 122M | Return on Assets | 0.01% | ||
| Return on Equity | 0.02% | ||||
| Technical | Volume & Bollinger Bands | Analyst | |||
|---|---|---|---|---|---|
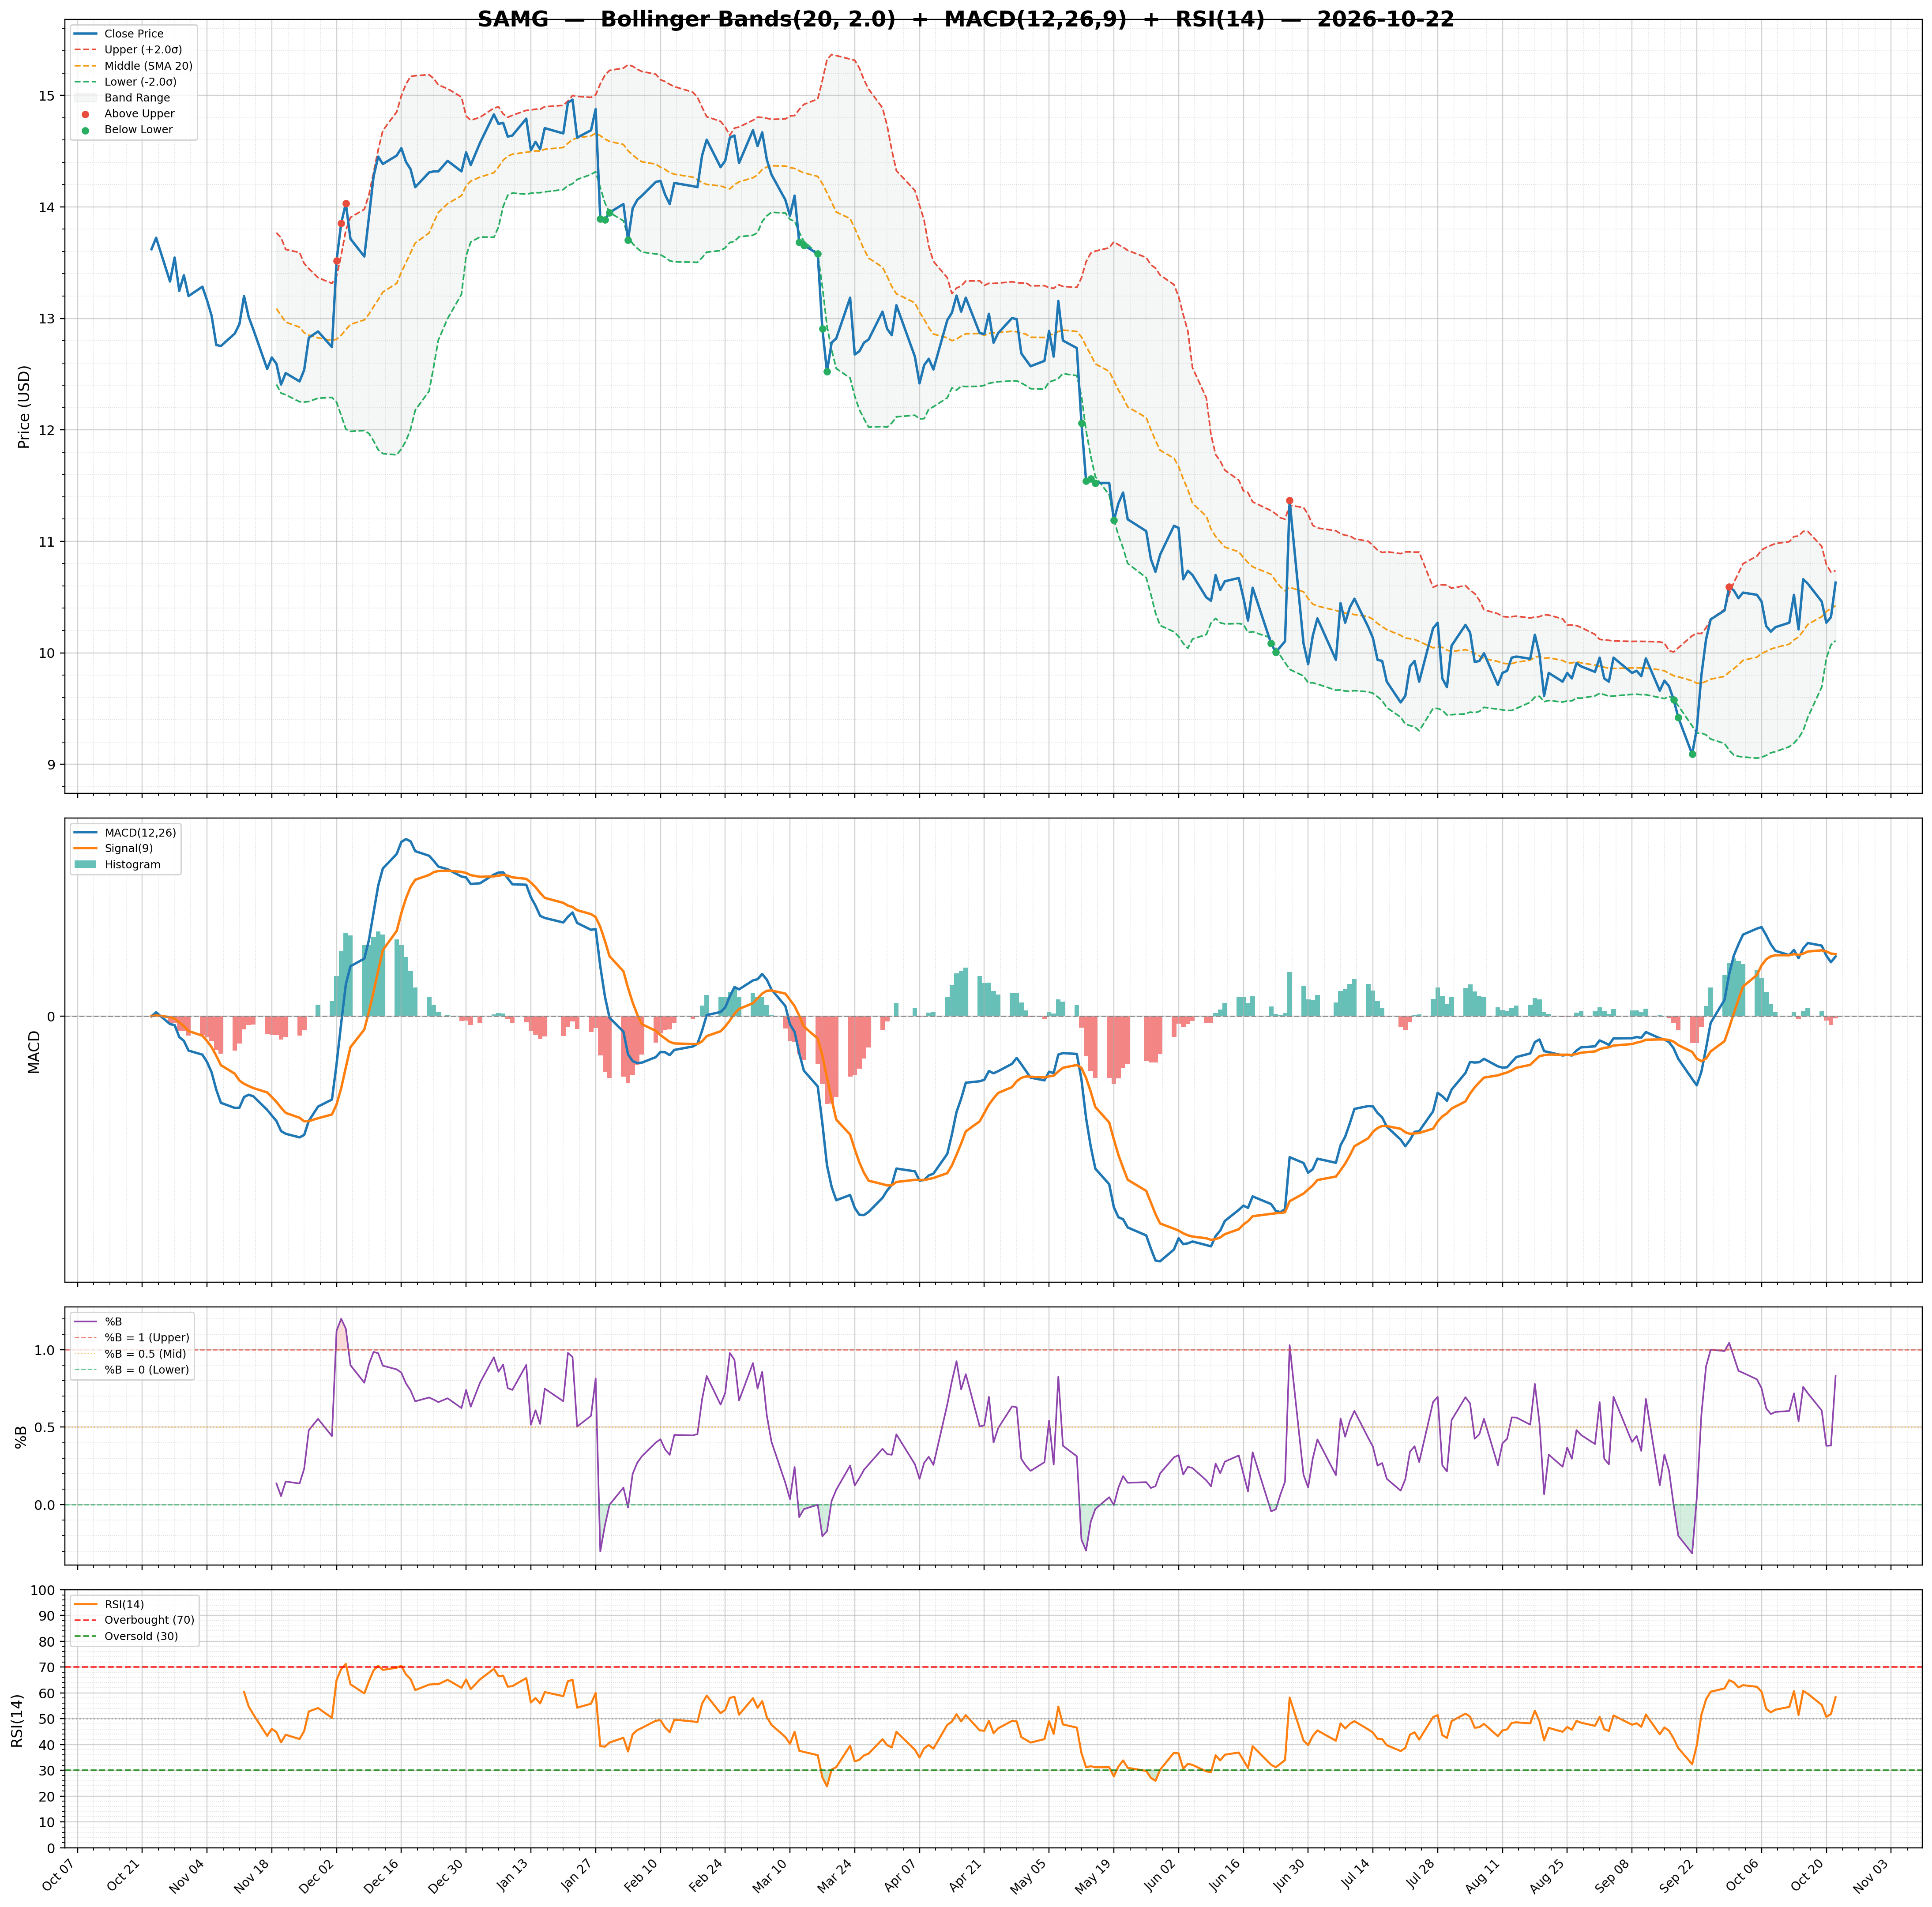
| RSI | 58.35 | Volume | 0.08M | Rating | none |
| Previous RSI | 51.84 | Avg Volume 20D | 0.09M | Target Mean | $18.00 |
| RSI Trend | Up | Relative Volume | 0.65 | Target High | $18.00 |
| MACD | 0.13 | Lower Band | 10.11 | Target Low | $18.00 |
| MACD Signal | 0.13 | Middle Band | 10.42 | Target Median | $18.00 |
| Histogram | -0.00 | Upper Band | 10.74 | Analysts | 1 |
| Previous Histogram | -0.02 | Bandwidth | 6.030 | Upside | 69.57% |
| Histogram Trend | Increasing | %B | 0.83 | ||