Smith Douglas Homes Corp. (SDHC)
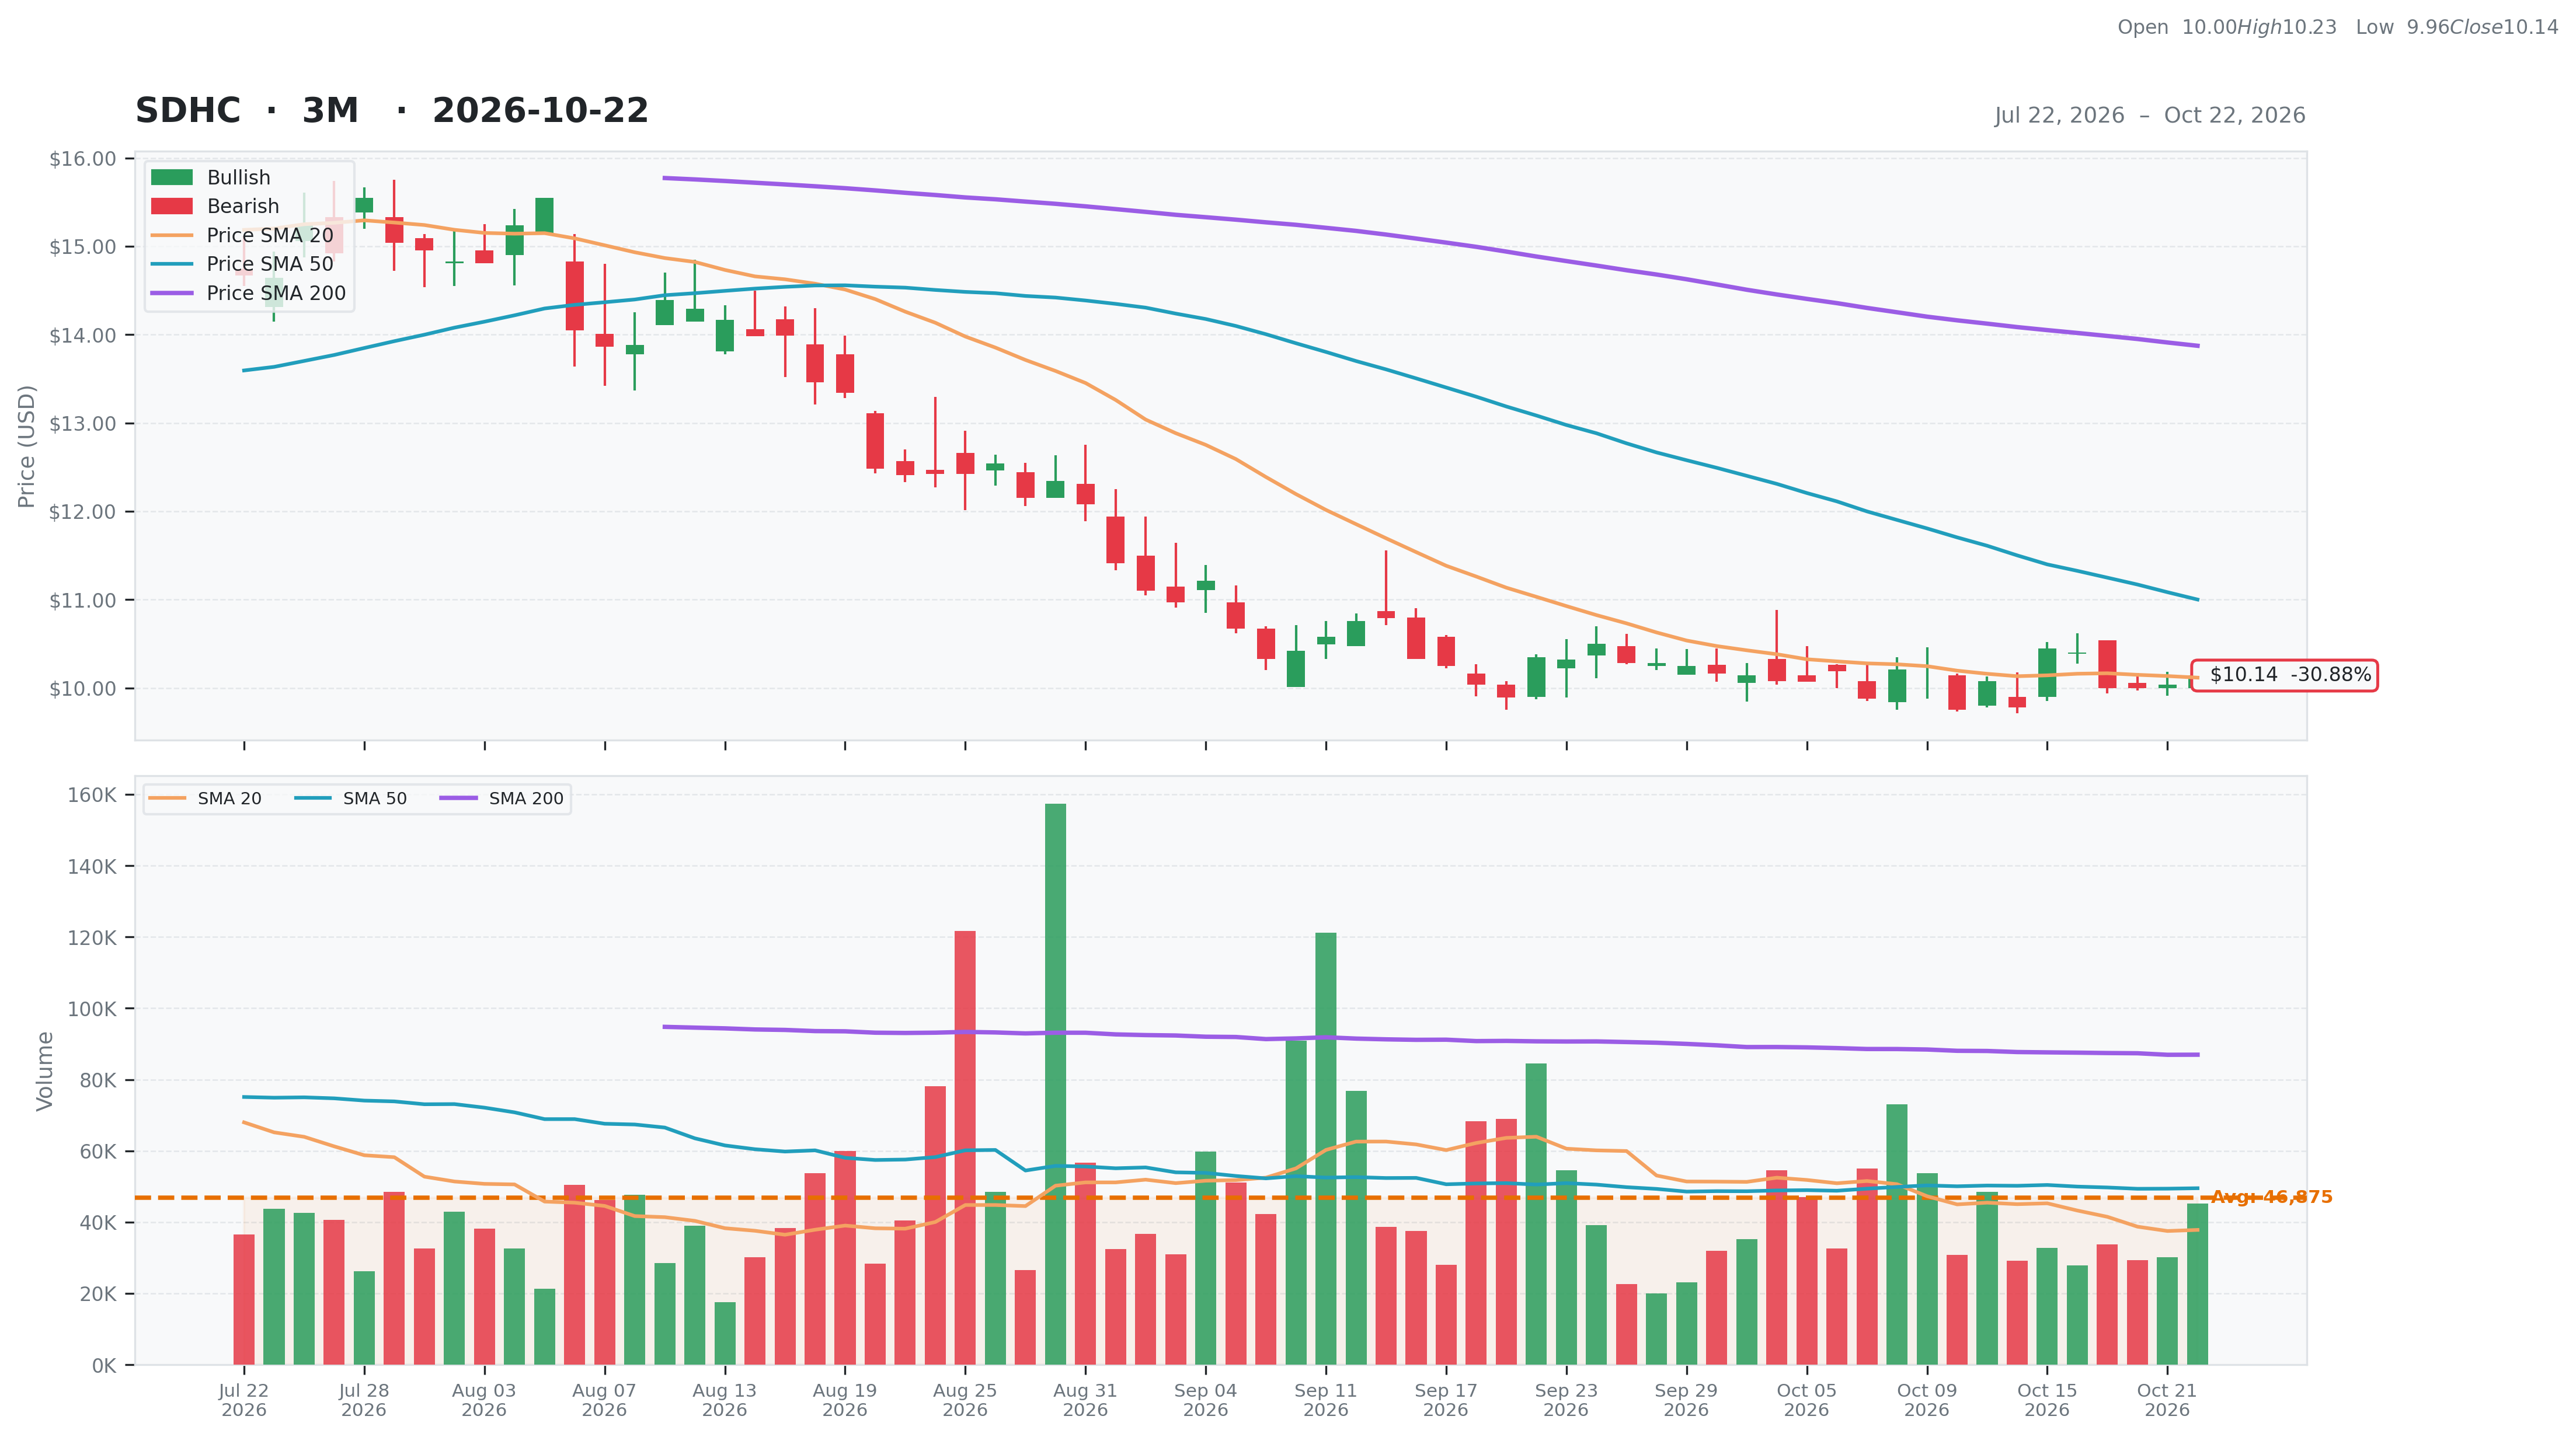
Real Estate • Real Estate - Development • $10.14 • MCap: 87,281,832
https://www.smithdouglas.com • Smith Douglas Homes Corp. engages in designing, constructing, and sale of single-family homes. The company offers title insurance and mortgage brokerage services. It targets and markets homes and communities to entry-level and empty-nest homebuyers. Smith Douglas Homes Corp. was founded in 2008 and is headquartered in Woodstock, Georgia
AAII
Ani
| Score | Price | 52 Week & Averages | Relative Strength | Risk | |||||
|---|---|---|---|---|---|---|---|---|---|
| Total | 41 | Current | $10.14 | 52W High | $22.16 -54.24% | Relative Strength | -0.38 | Beta | 0.90 |
| Business Quality | 1 | Weekly | $10.45 -2.97% | 52W Low | $9.75 4.00% | 3M | -0.34 | Short % | 0.24 |
| Financial Strength | 19 | Monthly | $10.35 -2.03% | Above 50DMA | $11.00 -7.82% | 6M | -0.30 | Risk Score | |
| Growth Outlook | 0 | Quarterly | $15.26 -33.55% | Above 200DMA | $13.87 -26.91% | 9M | -0.50 | ||
| Momentum | 1 | Yearly | $17.90 -43.35% | 12M | -0.43 | ||||
| Valuation | Financial Strength | Growth/Profitability | |||
|---|---|---|---|---|---|
| Trailing P/E | 14.44 | Cash | 14M | Revenue Growth | 0.22% |
| Forward P/E | 24.00 | Debt | 69M | Earnings Growth | -0.89% |
| PEG Ratio | N/A | Debt/Equity | 15.87 | Qtr Earnings Growth | -0.90% |
| Price/Sales | 0.09 | Current Ratio | 6.80 | Gross Margin | 0.19% |
| Price/Book | 1.10 | Quick Ratio | 0.28 | Operating Margin | 0.02% |
| EV/Revenue | 0.49 | Operating CF | 37M | Profit Margin | 0.01% |
| EV/EBITDA | 10.23 | Free CF | 36M | EBITDA Margin | 0.05% |
| Ent Value | 495M | Return on Assets | 0.05% | ||
| Return on Equity | 0.09% | ||||
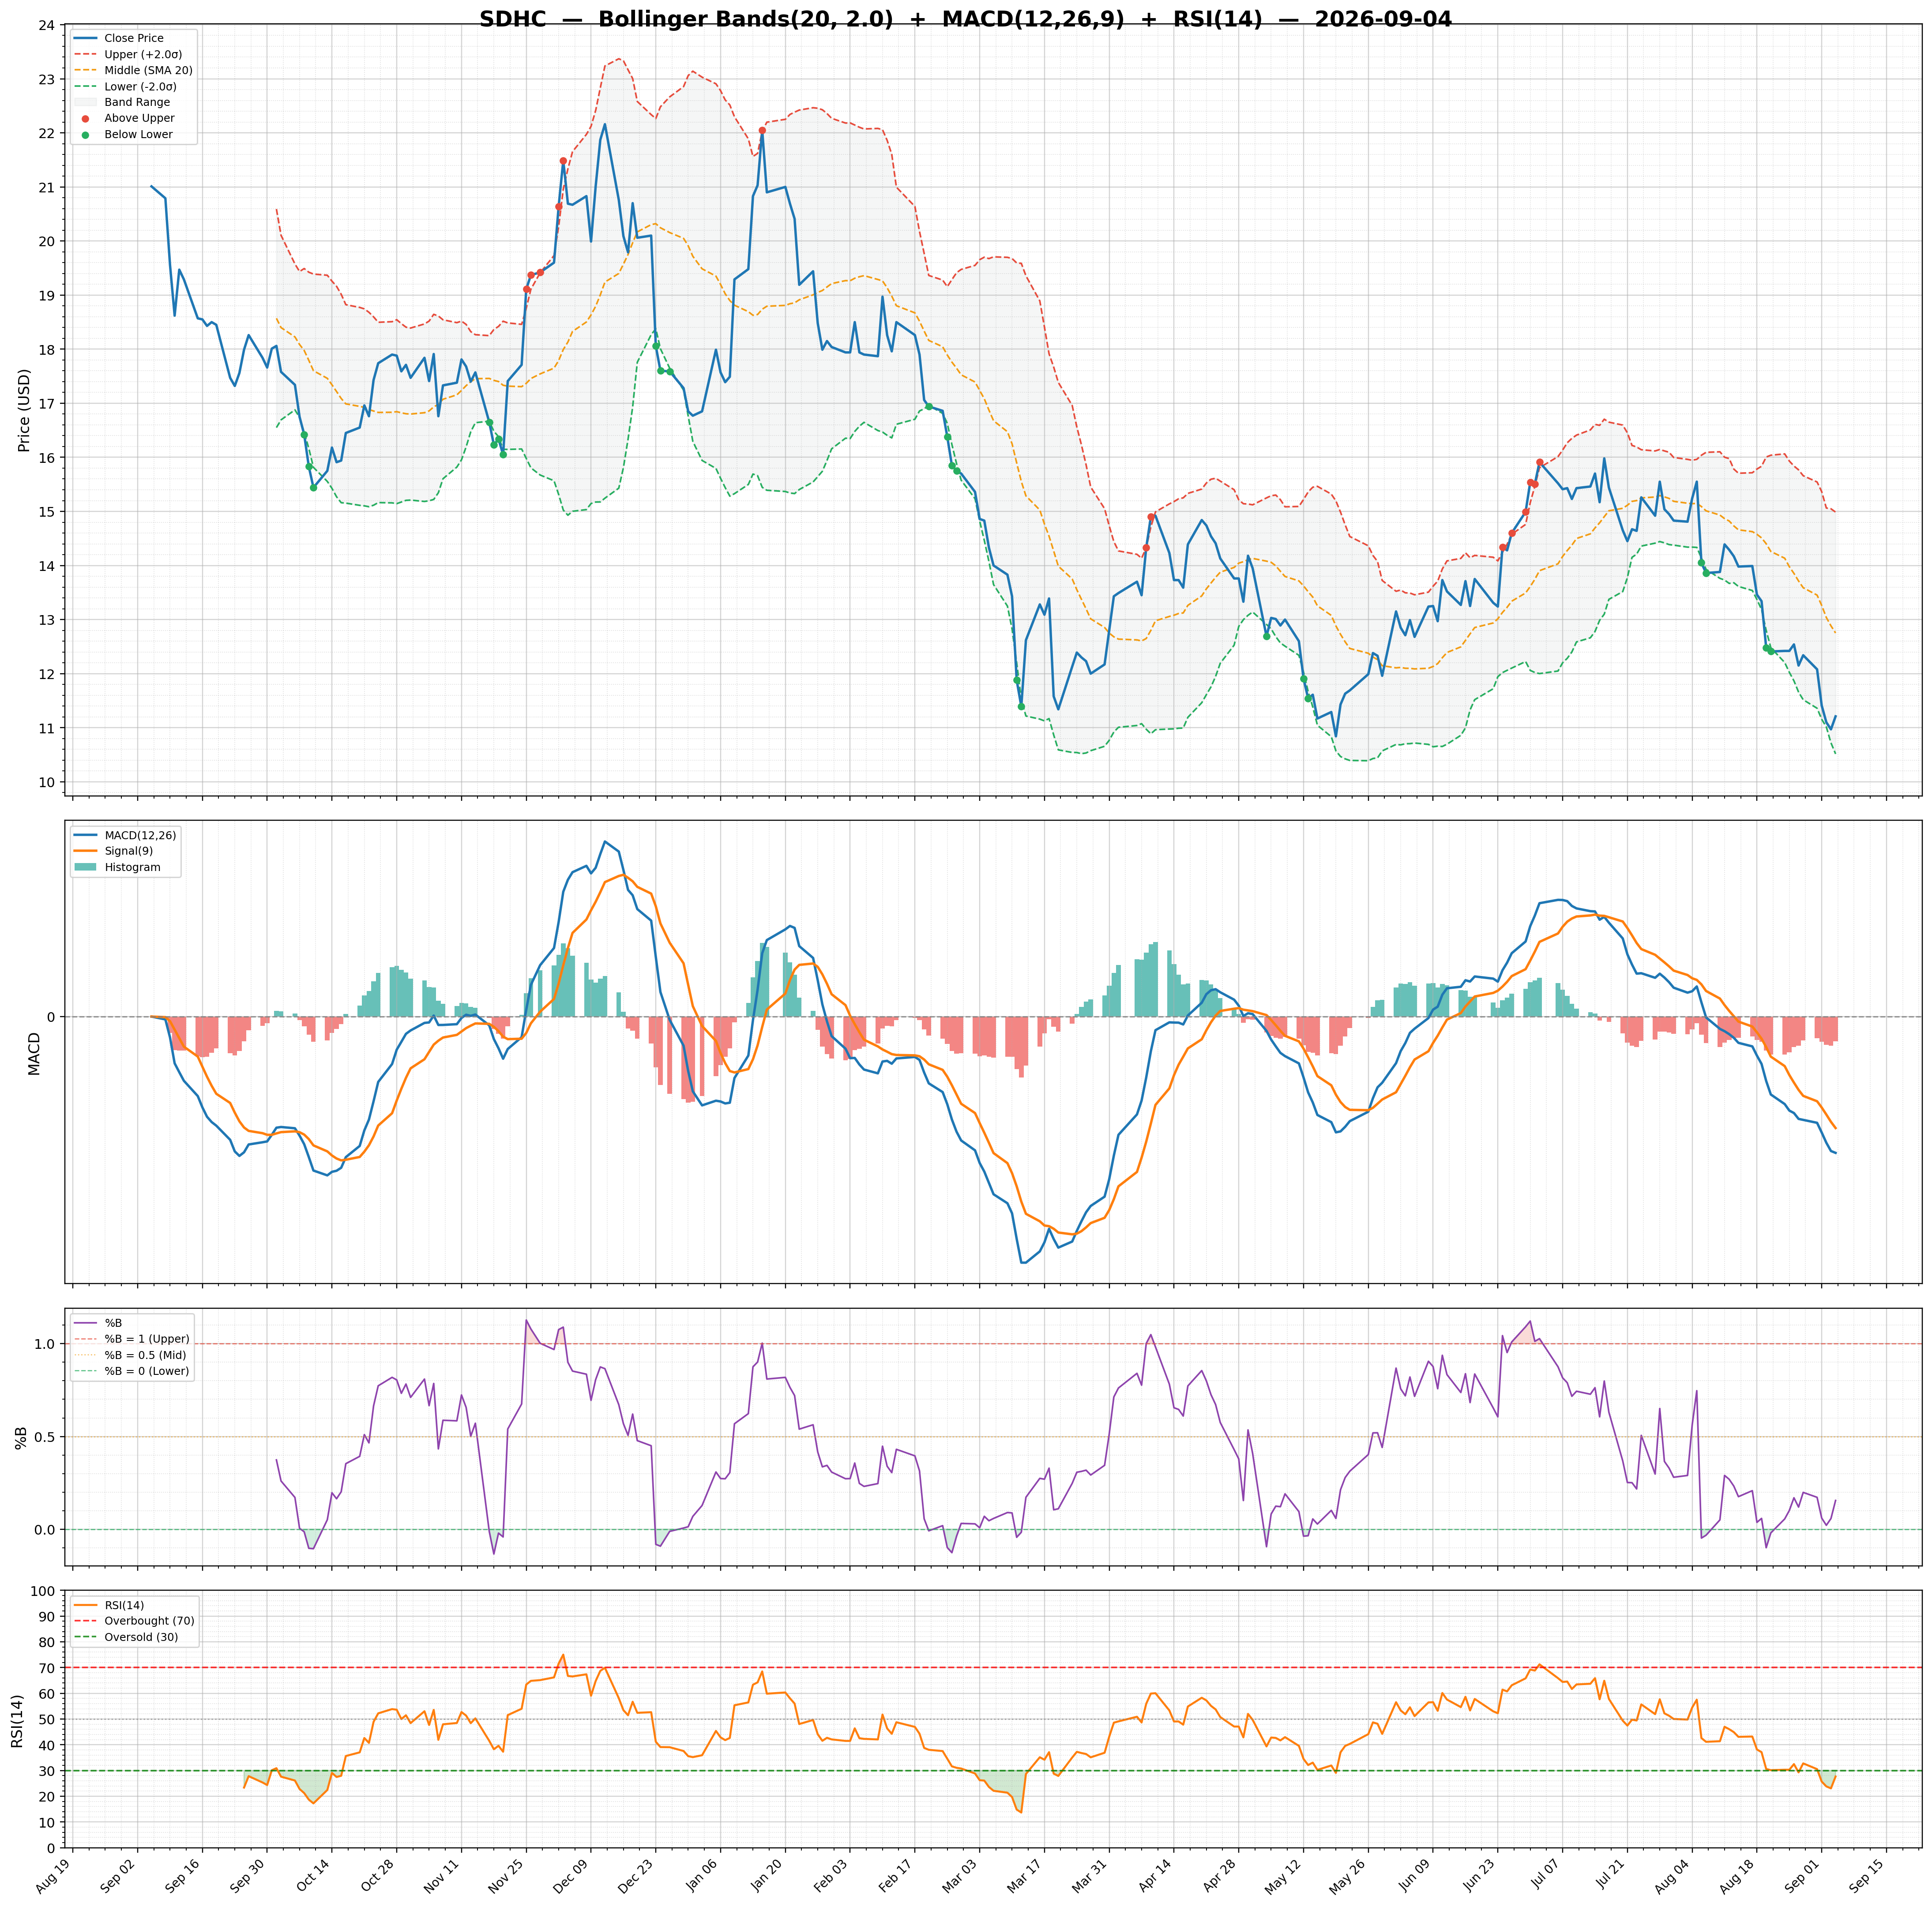
| Technical | Volume & Bollinger Bands | Analyst | |||
|---|---|---|---|---|---|
| RSI | 45.40 | Volume | 0.03M | Rating | hold |
| Previous RSI | 43.40 | Avg Volume 20D | 0.04M | Target Mean | $11.33 |
| RSI Trend | Up | Relative Volume | 0.99 | Target High | $14.00 |
| MACD | -0.24 | Lower Band | 9.76 | Target Low | $10.00 |
| MACD Signal | -0.33 | Middle Band | 10.12 | Target Median | $10.00 |
| Histogram | 0.09 | Upper Band | 10.48 | Analysts | 3 |
| Previous Histogram | 0.09 | Bandwidth | 7.160 | Upside | 8.97% |
| Histogram Trend | Increasing | %B | 0.53 | ||