Seneca Foods Corp. (SENEA)
Consumer Defensive • Packaged Foods • $164.36 • MCap: 1,152,670,336
https://www.senecafoods.com • Seneca Foods Corporation provides packaged fruits and vegetables in the United States and internationally. The company offers canned, frozen, and jarred fruits and vegetables; and packaged snack chips and other food products under the private label, as well as under various national and regional brands that the company owns or licenses, including Aunt Nellie's, CherryMan, Green Giant, Green Valley, Libby's, READ, and Seneca. In addition, it packs canned and frozen vegetables. Further, the company engages in the sale of cans, ends, and seeds, as well as aircraft operations. It provides its products to grocery outlets, including supermarkets, mass merchandisers, limited assortment stores, club stores, and dollar stores; specialty retailers; and food service distributors, restaurant chains, industrial markets, other food packagers, and export customers in approximately 55 countries, as well as federal, state, and local governments for school and other feeding programs. Seneca Foods Corporation was incorporated in 1949 and is headquartered in Fairport, New York.
Ex-AAII
| Score | Price | 52 Week & Averages | Relative Strength | Risk | |||||
|---|---|---|---|---|---|---|---|---|---|
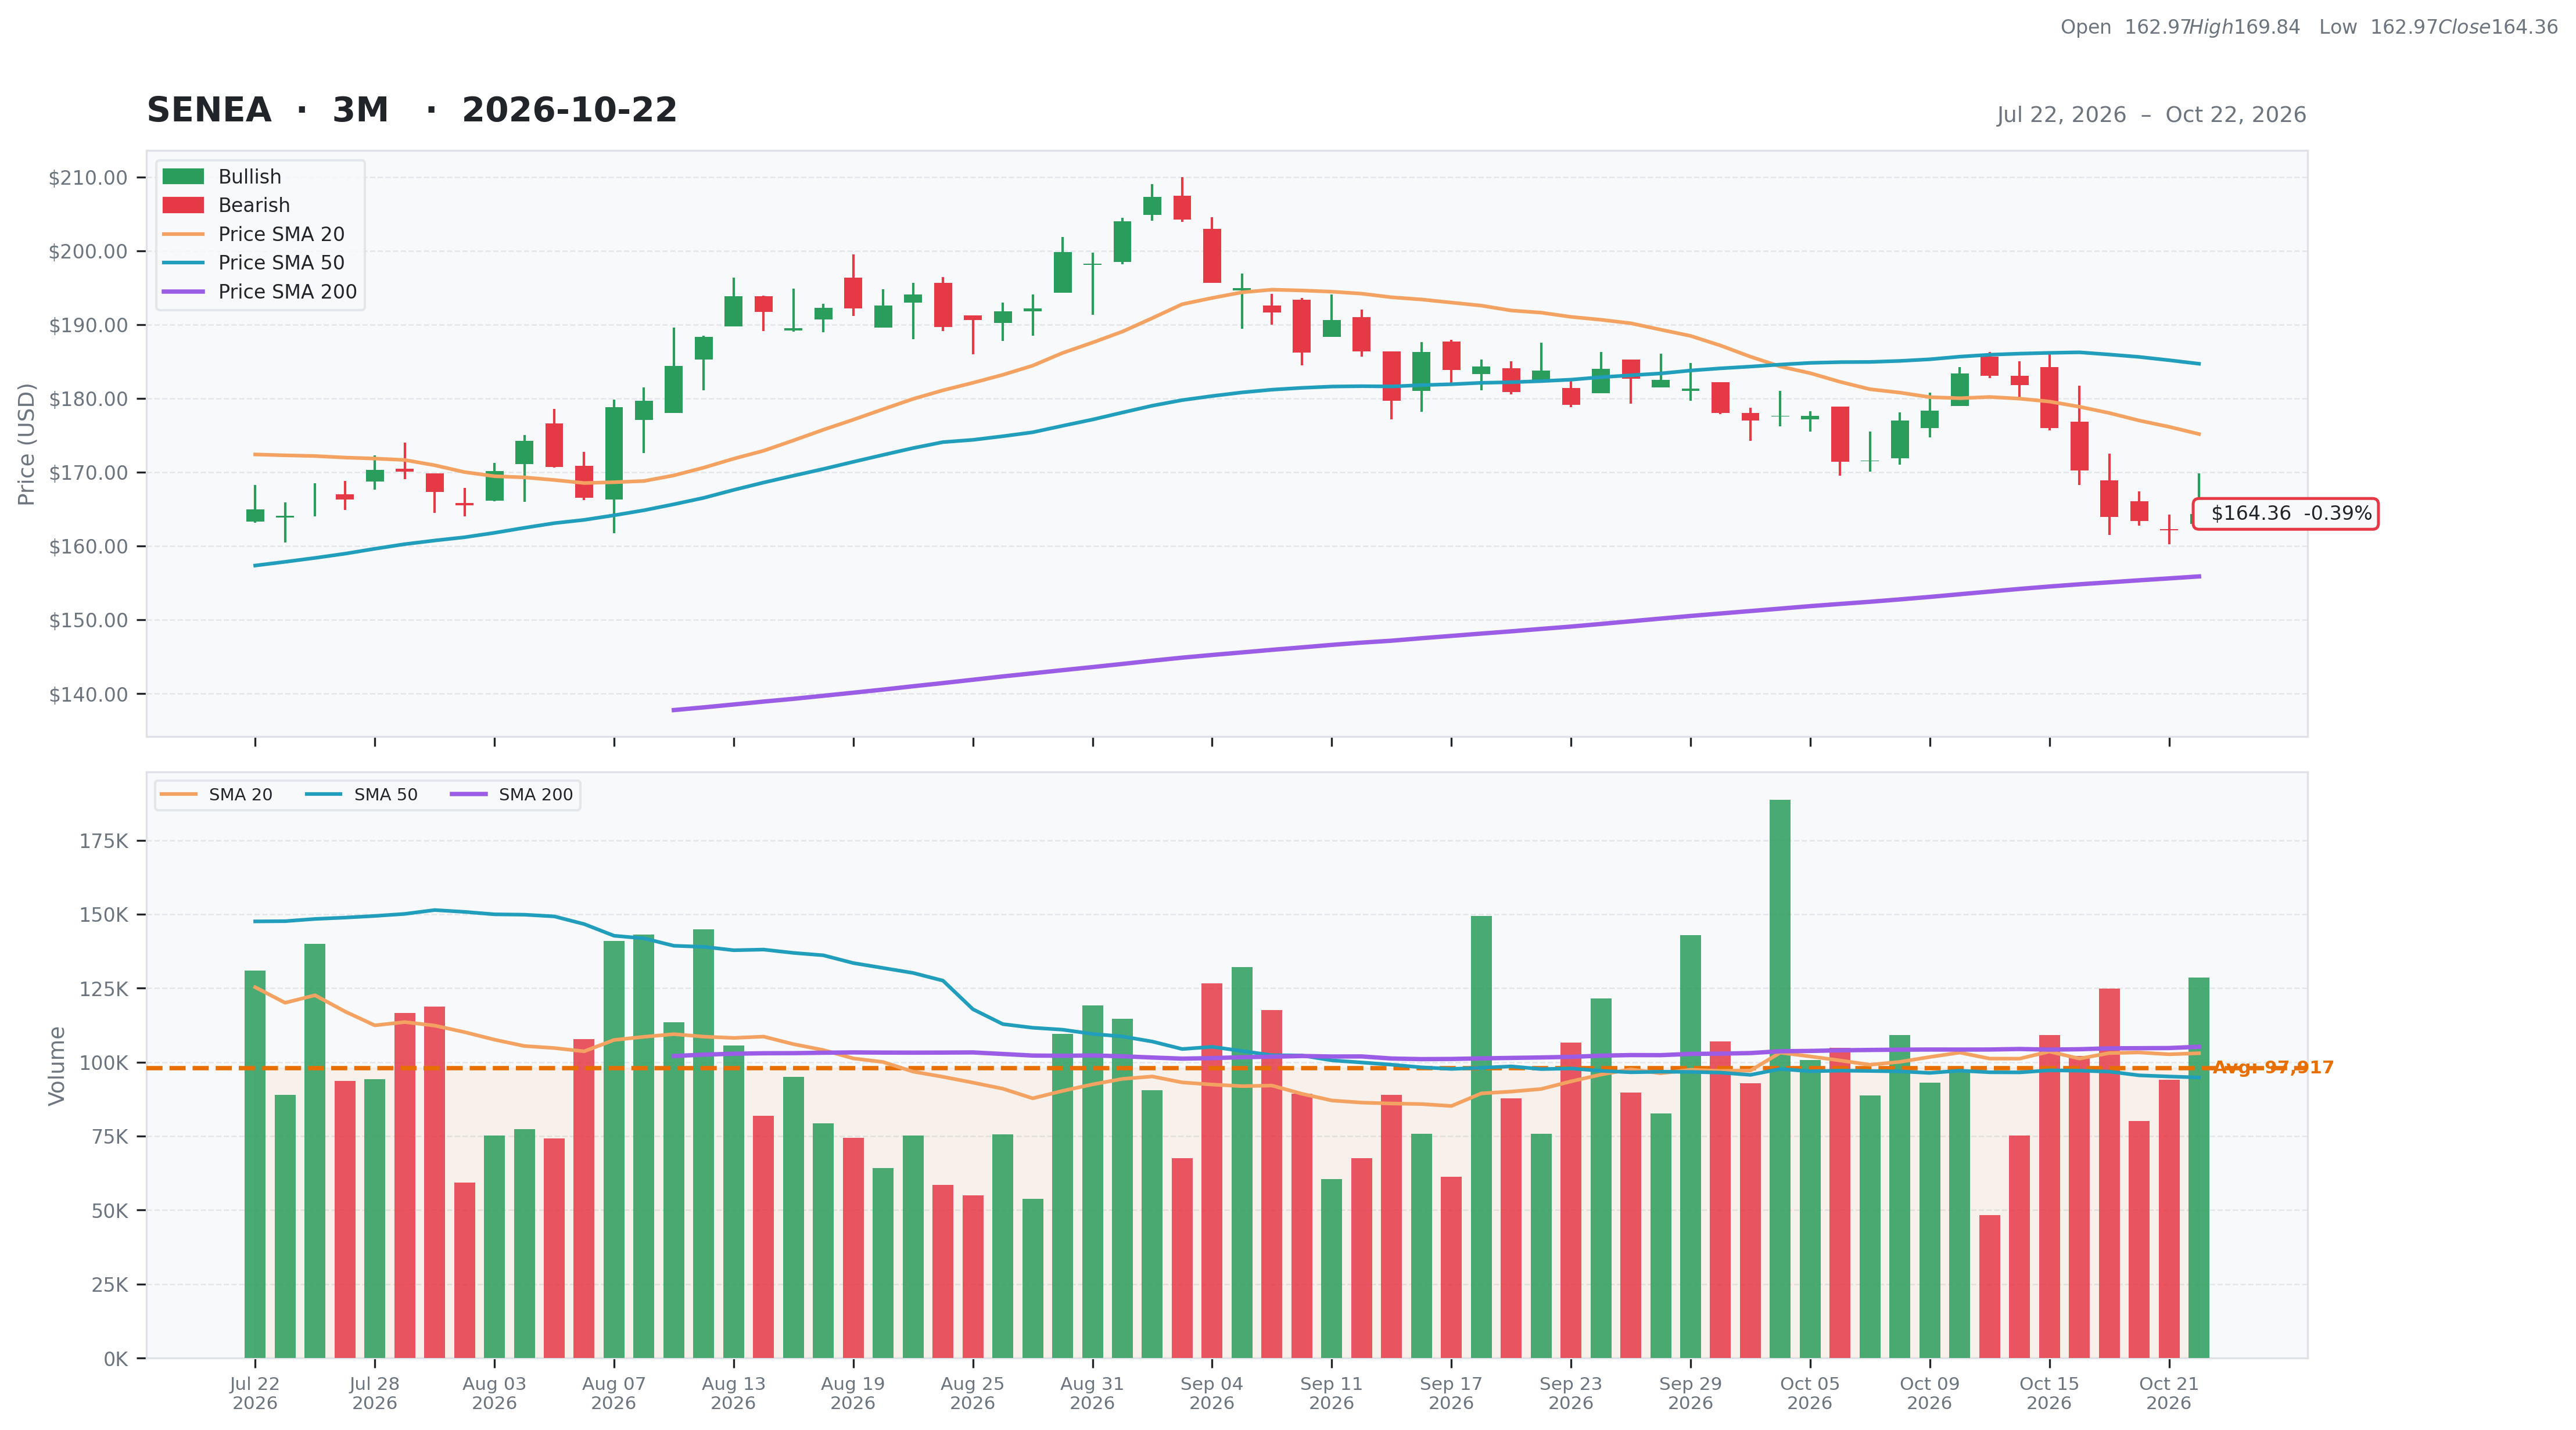
| Total | 61 | Current | $164.36 | 52W High | $207.30 -20.71% | Relative Strength | 0.21 | Beta | -0.03 |
| Business Quality | 5 | Weekly | $176.00 -6.61% | 52W Low | $101.18 62.44% | 3M | -0.01 | Short % | 0.07 |
| Financial Strength | 18 | Monthly | $183.81 -10.58% | Above 50DMA | $184.71 -11.02% | 6M | 0.22 | Risk Score | 10 |
| Growth Outlook | 11 | Quarterly | $166.22 -1.12% | Above 200DMA | $155.88 5.44% | 9M | 0.40 | ||
| Momentum | 4 | Yearly | $112.73 45.80% | 12M | 0.42 | ||||
| Valuation | Financial Strength | Growth/Profitability | |||
|---|---|---|---|---|---|
| Trailing P/E | 9.83 | Cash | 87M | Revenue Growth | 0.36% |
| Forward P/E | N/A | Debt | 240M | Earnings Growth | 0.33% |
| PEG Ratio | 0.83 | Debt/Equity | 31.02 | Qtr Earnings Growth | 0.31% |
| Price/Sales | 0.65 | Current Ratio | 3.77 | Gross Margin | 0.13% |
| Price/Book | 1.49 | Quick Ratio | 0.87 | Operating Margin | 0.07% |
| EV/Revenue | 0.74 | Operating CF | 280M | Profit Margin | 0.07% |
| EV/EBITDA | 6.41 | Free CF | 138M | EBITDA Margin | 0.12% |
| Ent Value | 1,308M | Return on Assets | 0.08% | ||
| Return on Equity | 0.17% | ||||
| Technical | Volume & Bollinger Bands | Analyst | |||
|---|---|---|---|---|---|
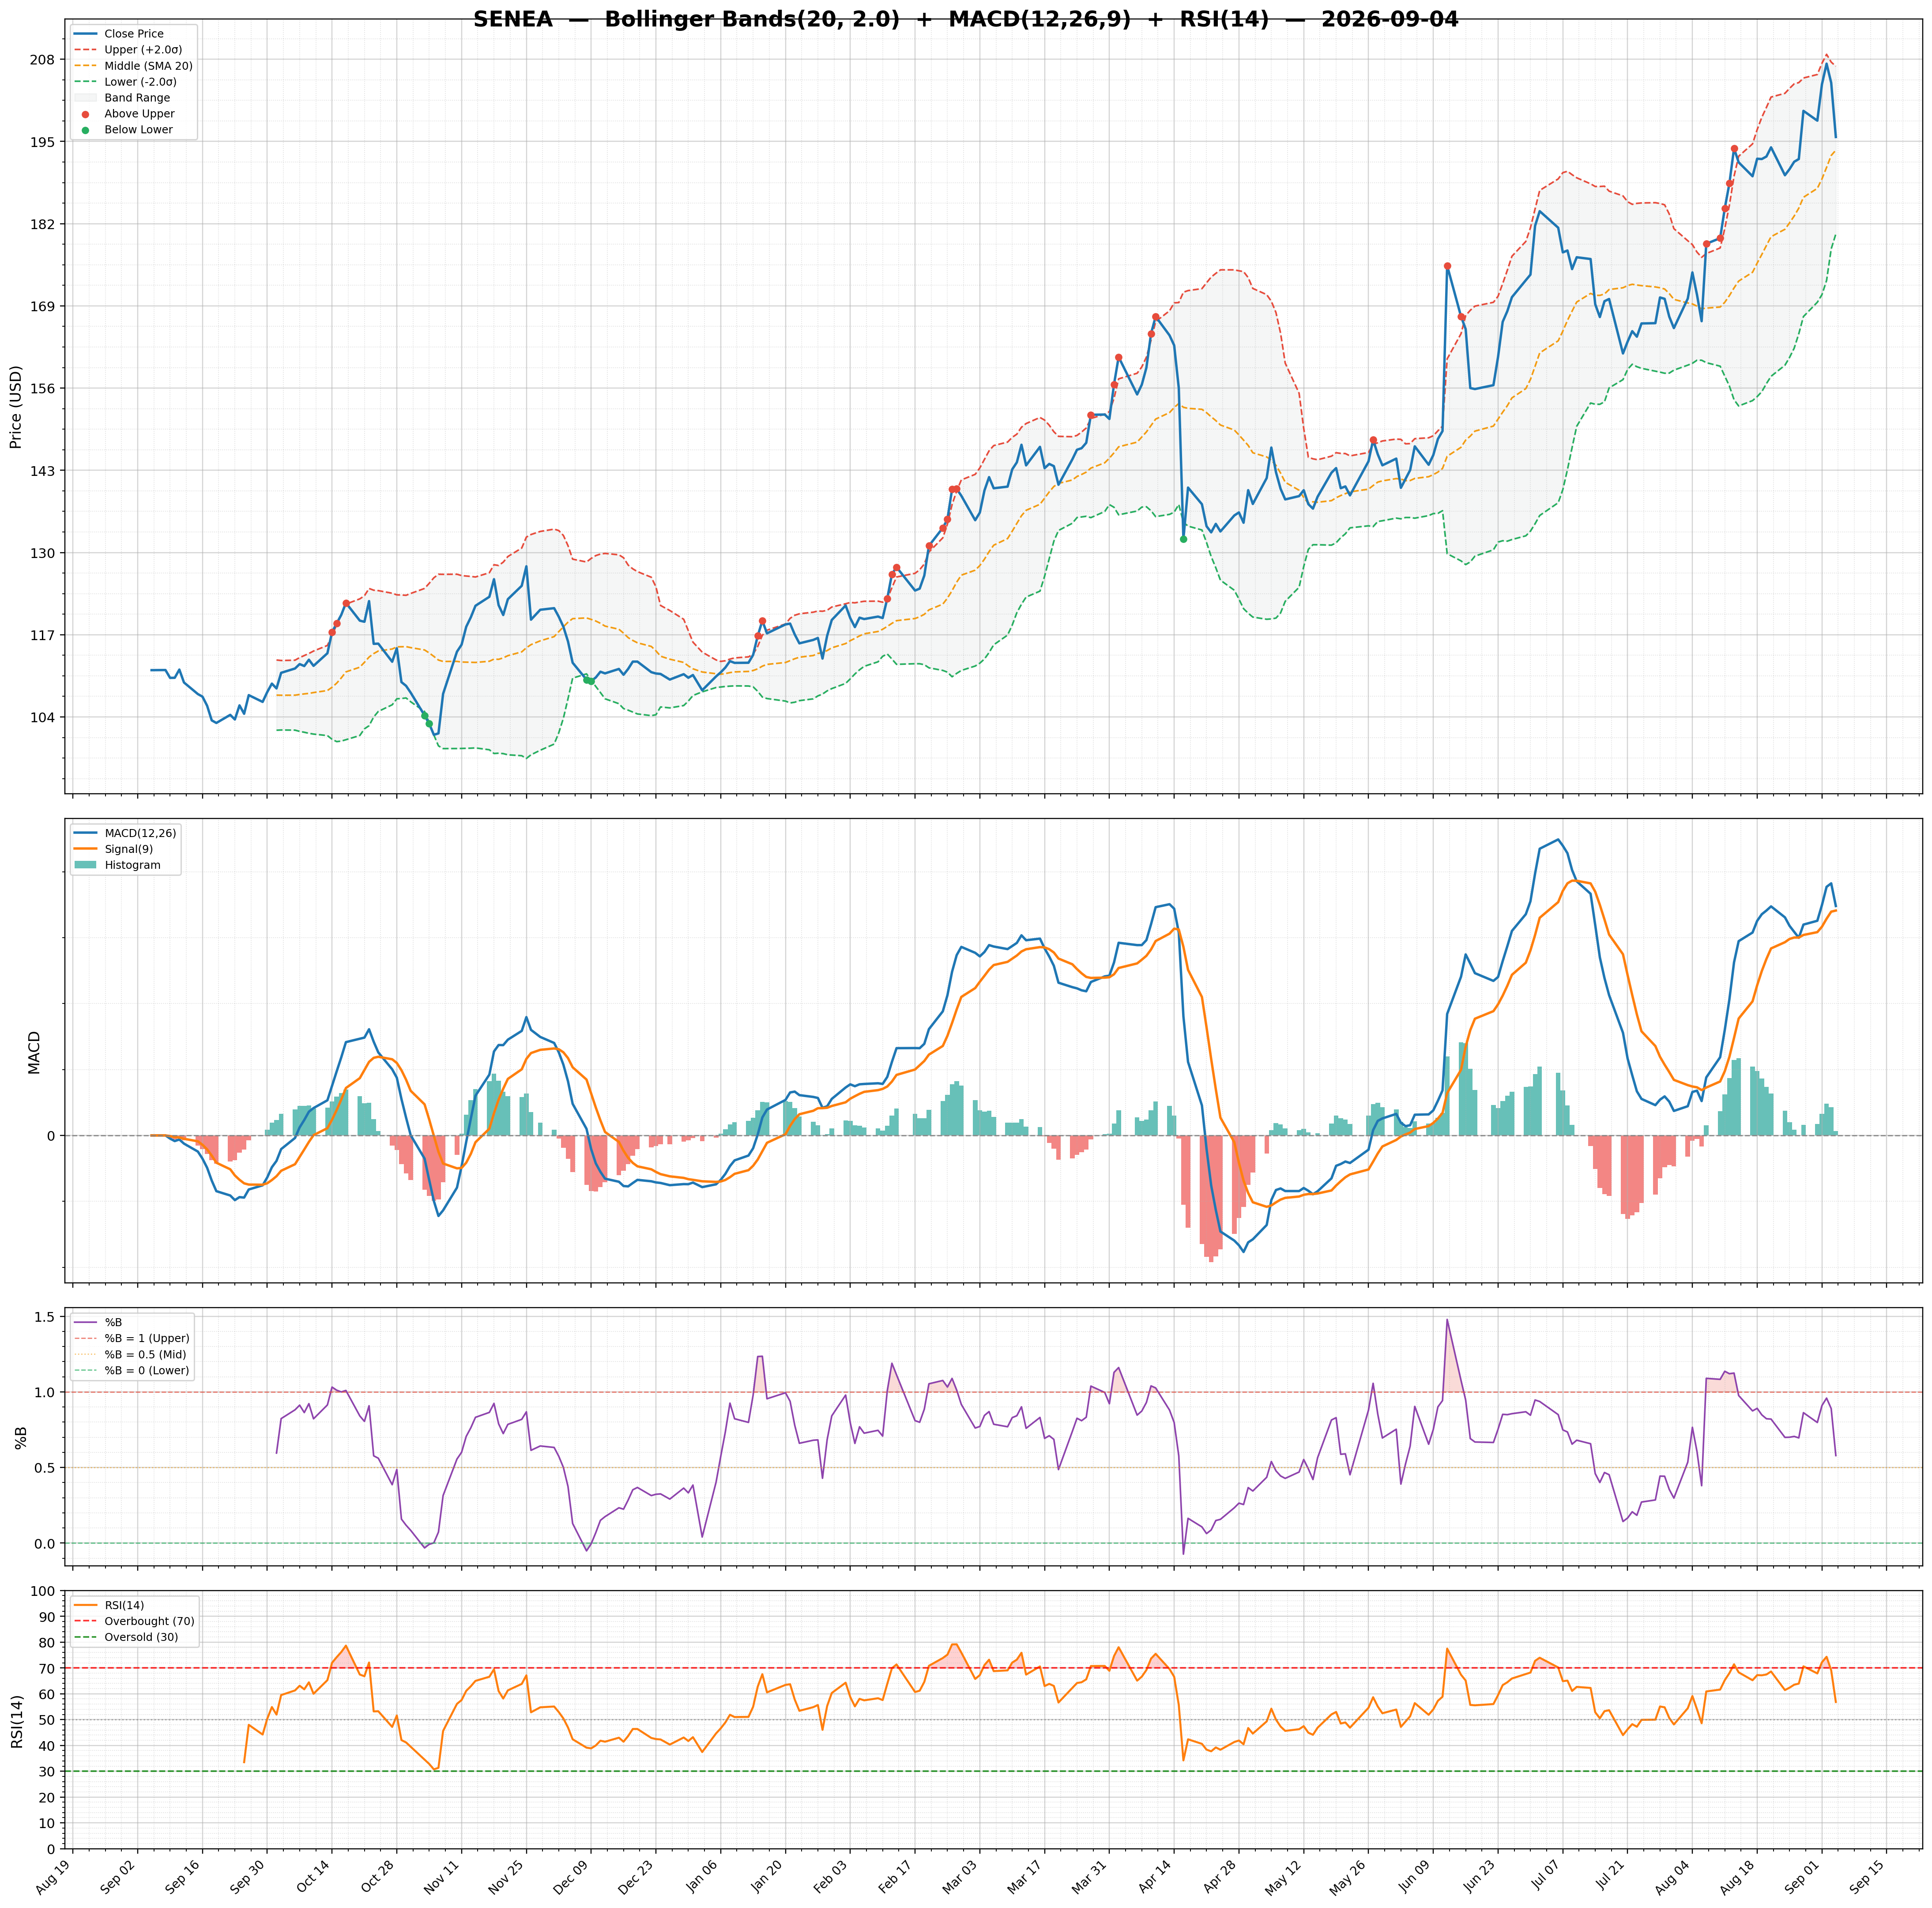
| RSI | 34.62 | Volume | 0.1M | Rating | none |
| Previous RSI | 30.89 | Avg Volume 20D | 0.1M | Target Mean | $202.00 |
| RSI Trend | Up | Relative Volume | 1.31 | Target High | $202.00 |
| MACD | -4.99 | Lower Band | 160.94 | Target Low | $202.00 |
| MACD Signal | -3.55 | Middle Band | 175.18 | Target Median | $202.00 |
| Histogram | -1.44 | Upper Band | 189.42 | Analysts | 1 |
| Previous Histogram | -1.54 | Bandwidth | 16.260 | Upside | 18.65% |
| Histogram Trend | Increasing | %B | 0.12 | ||