Smithfield Foods, Inc. (SFD)
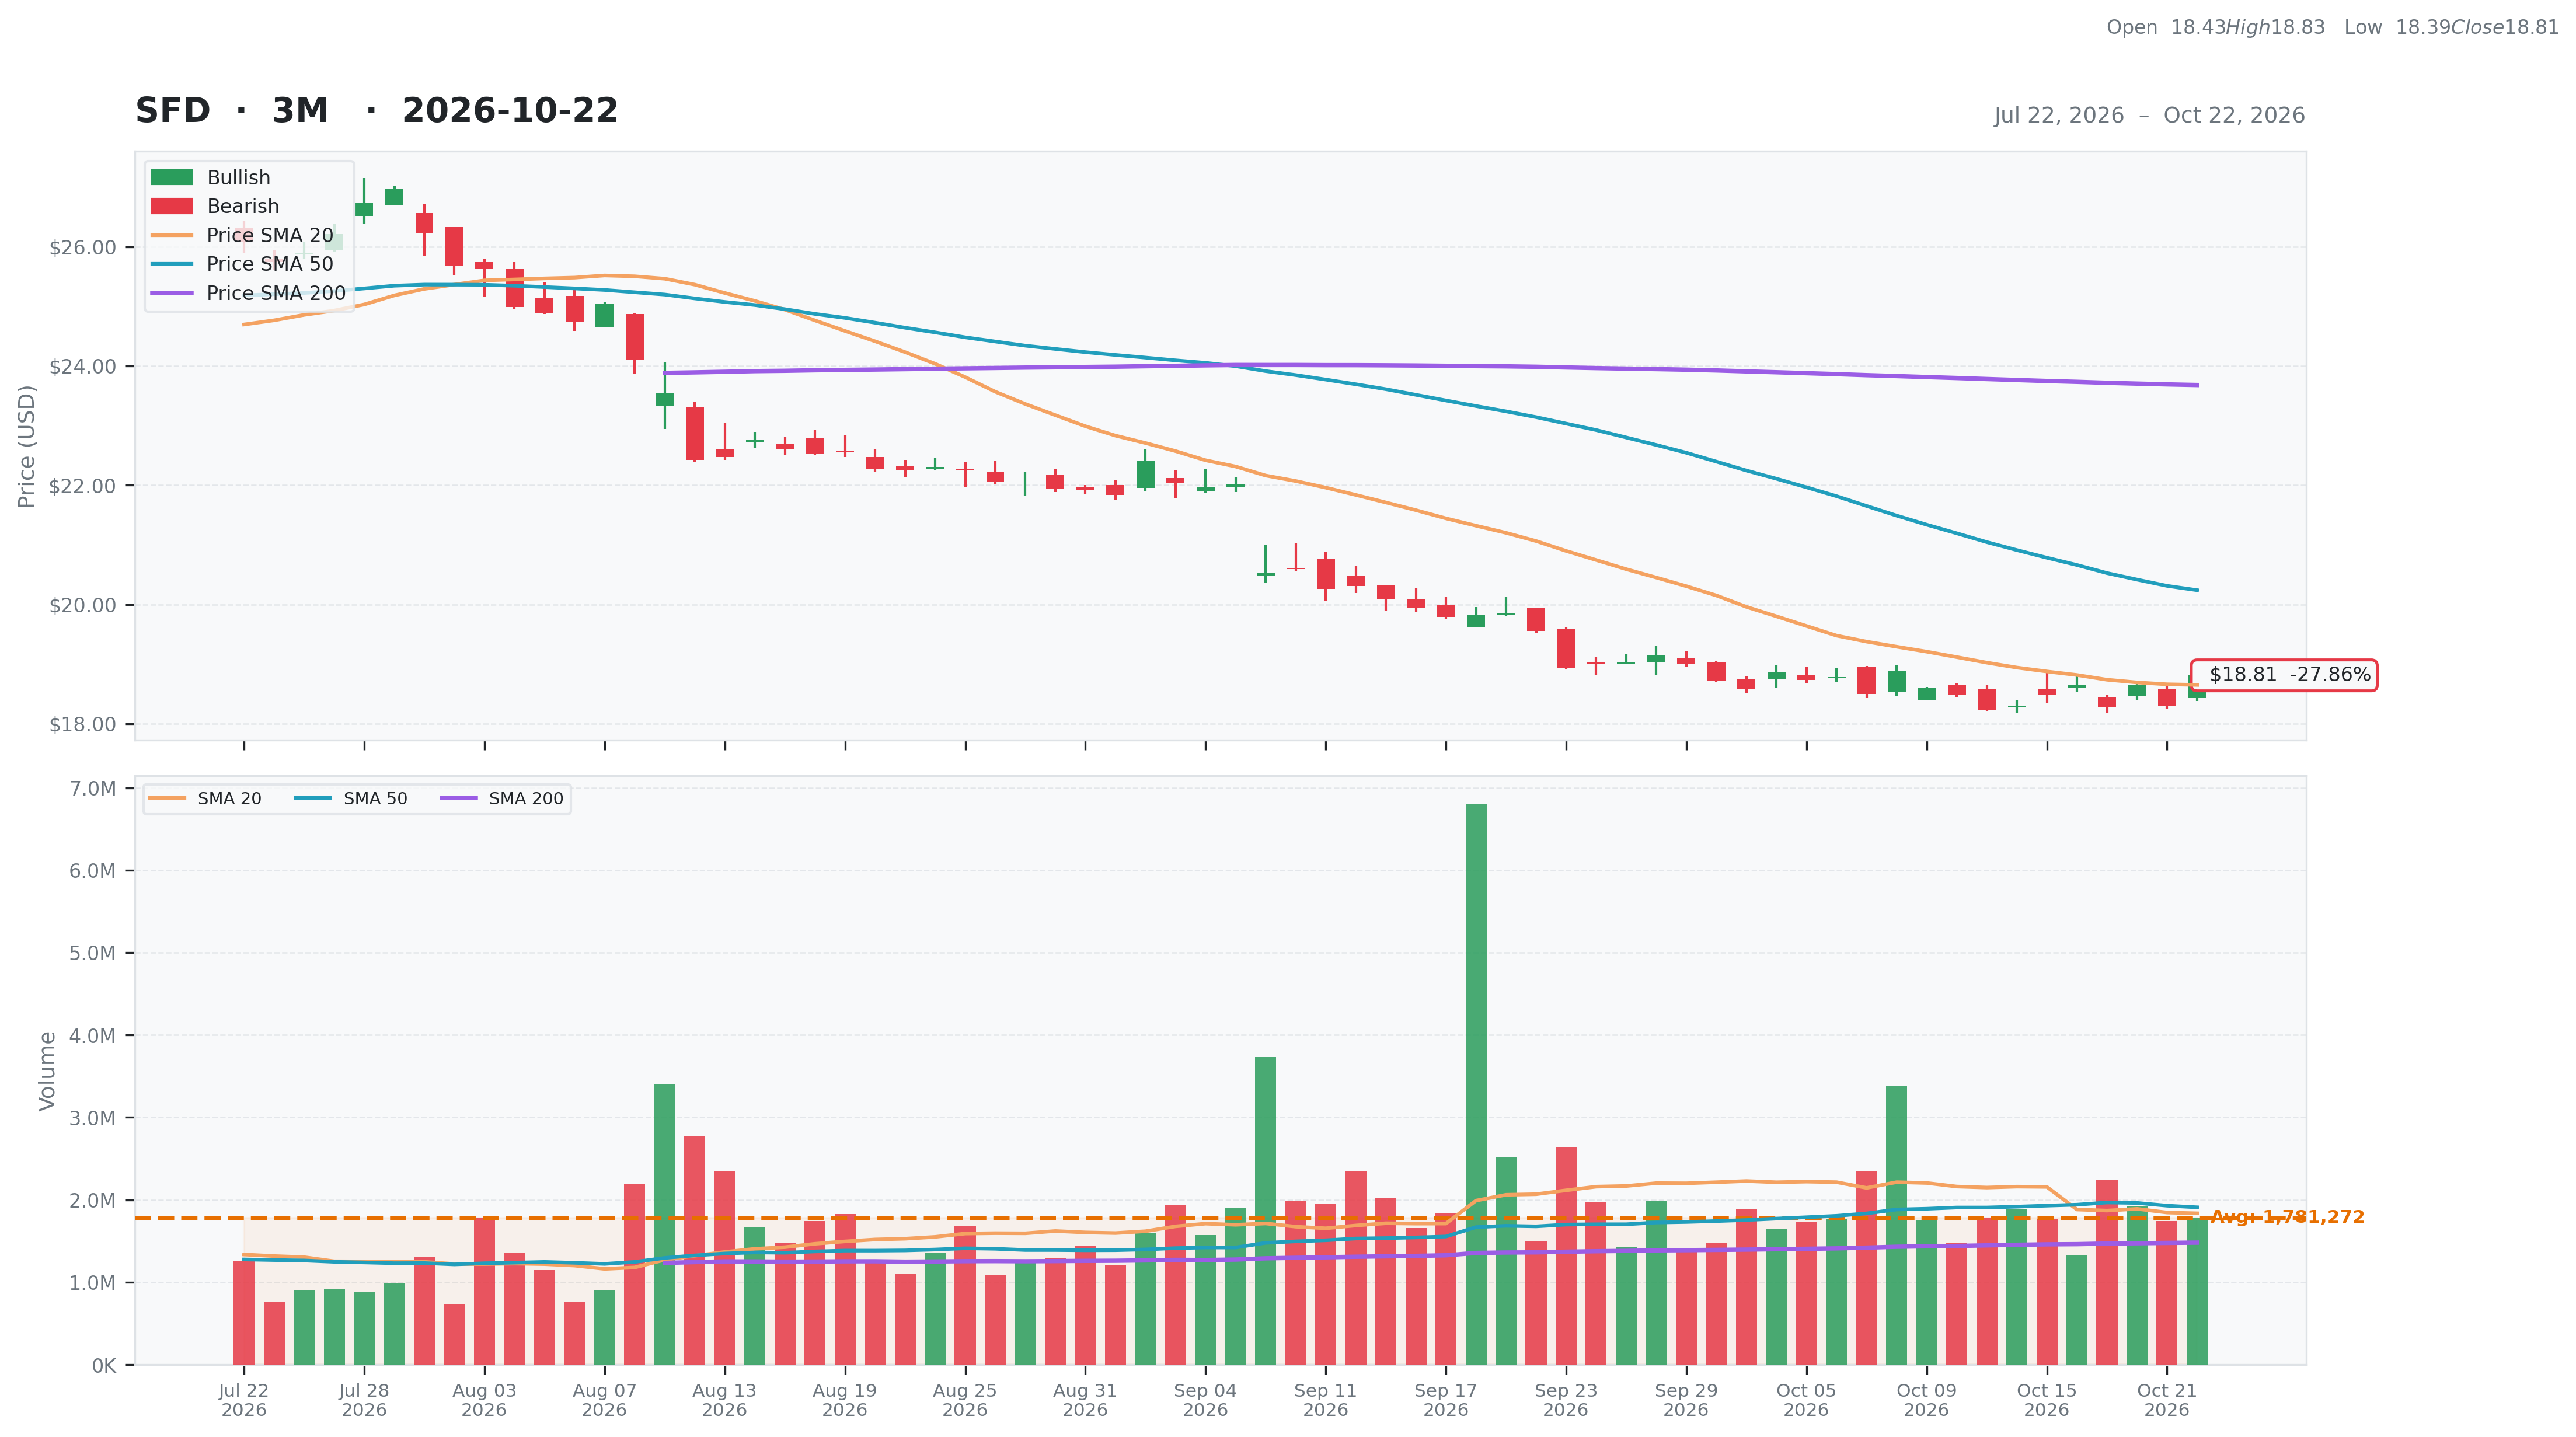
Consumer Defensive • Packaged Foods • $18.81 • MCap: 7,339,824,640
https://www.smithfieldfoods.com • Smithfield Foods, Inc., together with its subsidiaries, produces various packaged meats and fresh pork products in the United States and internationally. It operates through Packaged Meats, Fresh Pork, Hog Production, and Other segments. The Packaged Meats segment processes fresh meat into various packaged meats products, including bacon, sausage, hot dogs, deli and lunch meats, dry sausage products, ham products, ready-to-eat products, and prepared foods to retail and foodservice customers. This segment markets its packaged meat products under the Smithfield, Eckrich, Nathan's Famous, Farmland, Armour, Farmer John, Kretschmar, Krakus, John Morrell, Cook's, Gwaltney, Carando, Margherita, Curly's and Smithfield Culinary, as well as under private labels. The Fresh Pork segment processes live hogs into a variety of primal, sub-primal, and offal products, such as bellies, butts, hams, loins, trimmings, picnics, and ribs. This segment sells its fresh pork products to retail, foodservice and industrial customers, as well as to export markets, including China, Mexico, Japan, South Korea, and Canada. The Hog Production segment produces and raises its hogs on various company-owned farms and farms that are owned and operated by contract farmers. This segment also sells livestock feed and grains; and provides transportation and other ancillary services. The Other segment engages in the bioscience operations uses raw materials from hogs that process to manufacture heparin products, including an active pharmaceutical ingredient that mitigates the risk of blood clots; and produces fresh pork products in Mexico. The company was founded in 1936 and is headquartered in Smithfield, Virginia. Smithfield Foods, Inc. is a subsidiary of SFDS UK Holdings Limited.
ET
| Score | Price | 52 Week & Averages | Relative Strength | Risk | |||||
|---|---|---|---|---|---|---|---|---|---|
| Total | 56 | Current | $18.81 | 52W High | $28.82 -34.73% | Relative Strength | -0.22 | Beta | N/A |
| Business Quality | 5 | Weekly | $18.48 1.79% | 52W Low | $18.22 3.24% | 3M | -0.27 | Short % | 0.11 |
| Financial Strength | 12 | Monthly | $19.56 -3.83% | Above 50DMA | $20.24 -7.06% | 6M | -0.34 | Risk Score | 9 |
| Growth Outlook | 11 | Quarterly | $25.90 -27.37% | Above 200DMA | $23.68 -20.56% | 9M | -0.15 | ||
| Momentum | 3 | Yearly | $20.53 -8.40% | 12M | -0.08 | ||||
| Valuation | Financial Strength | Growth/Profitability | |||
|---|---|---|---|---|---|
| Trailing P/E | 6.93 | Cash | 1,350M | Revenue Growth | -0.02% |
| Forward P/E | 8.95 | Debt | 2,396M | Earnings Growth | 0.26% |
| PEG Ratio | N/A | Debt/Equity | 32.76 | Qtr Earnings Growth | 0.27% |
| Price/Sales | 0.47 | Current Ratio | 2.56 | Gross Margin | 0.13% |
| Price/Book | 1.05 | Quick Ratio | 1.21 | Operating Margin | 0.08% |
| EV/Revenue | 0.56 | Operating CF | 1,155M | Profit Margin | 0.07% |
| EV/EBITDA | 5.14 | Free CF | 528M | EBITDA Margin | 0.11% |
| Ent Value | 8,697M | Return on Assets | 0.07% | ||
| Return on Equity | 0.15% | ||||
| Technical | Volume & Bollinger Bands | Analyst | |||
|---|---|---|---|---|---|
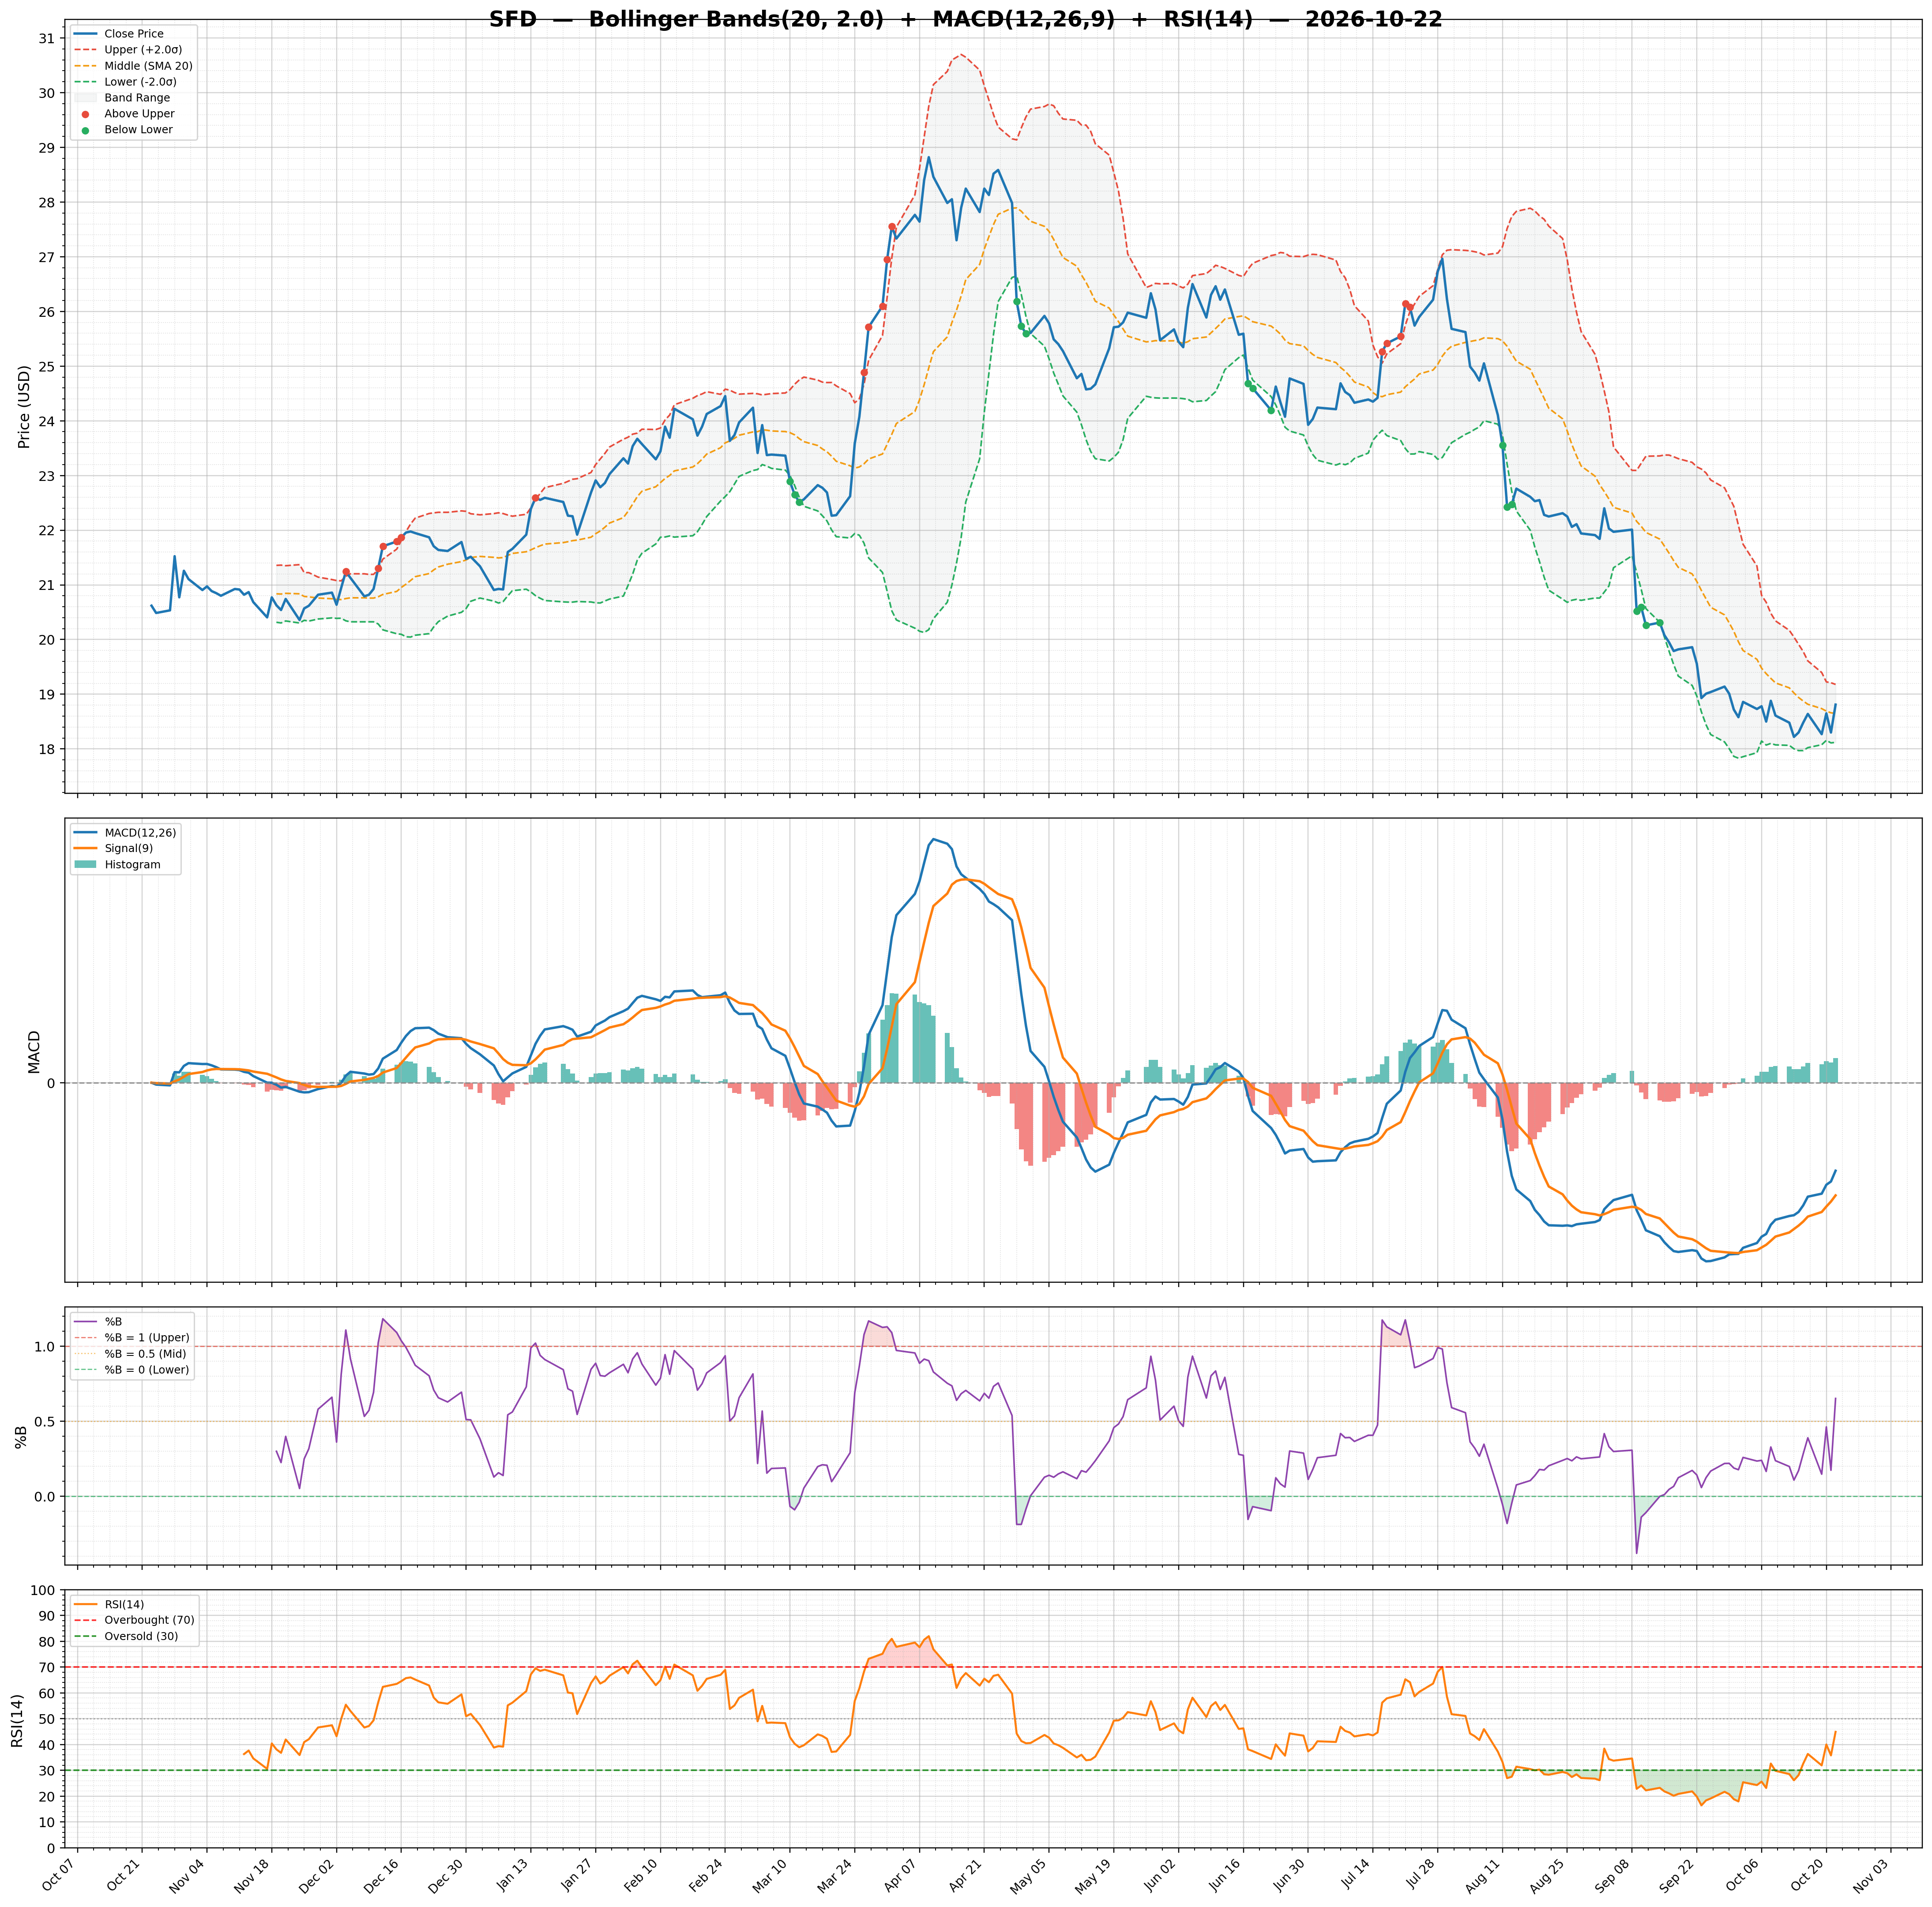
| RSI | 44.91 | Volume | 1.32M | Rating | buy |
| Previous RSI | 35.79 | Avg Volume 20D | 1.84M | Target Mean | $24.93 |
| RSI Trend | Up | Relative Volume | 0.86 | Target High | $29.00 |
| MACD | -0.50 | Lower Band | 18.12 | Target Low | $21.00 |
| MACD Signal | -0.64 | Middle Band | 18.65 | Target Median | $24.00 |
| Histogram | 0.14 | Upper Band | 19.18 | Analysts | 7 |
| Previous Histogram | 0.12 | Bandwidth | 5.680 | Upside | 33.74% |
| Histogram Trend | Increasing | %B | 0.65 | ||